EURUSD LIVE TRADEHello friends
Since the price has reached the specified important resistance, a correction in the price is expected. Therefore, you can enter the position with capital and risk management and move with it to the specified goals.
*Trade safely with us*
Eurusdlong

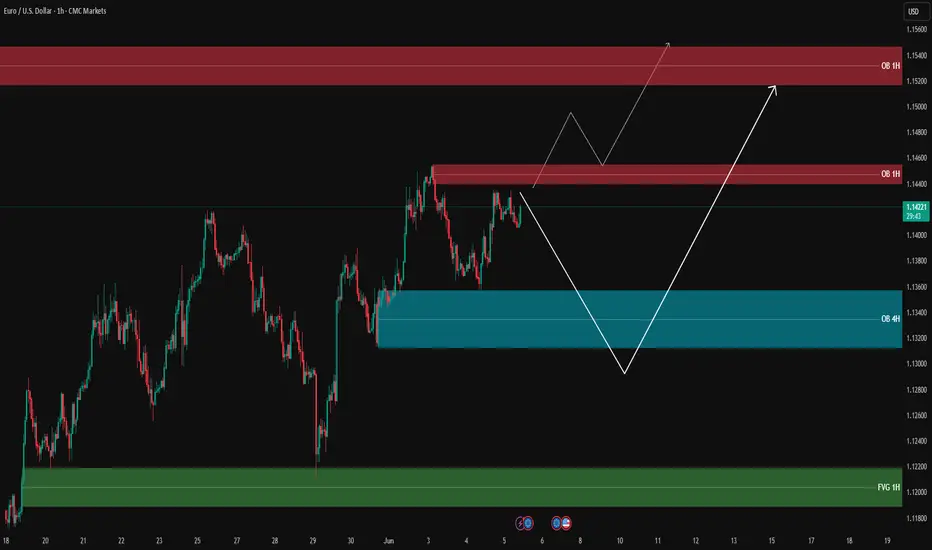
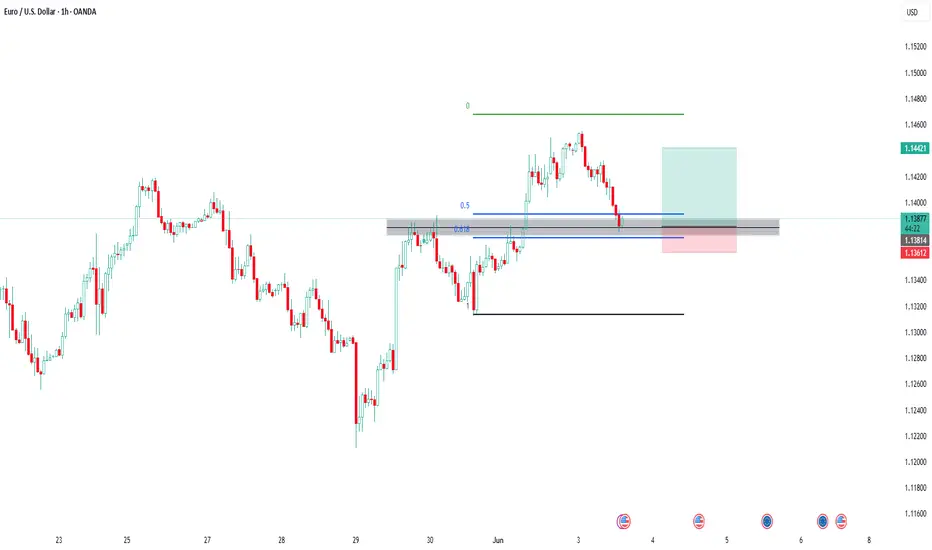
EUR/USD Analysis – Possible Scenarios🔹 Price is currently trading around 1.1421, consolidating between key supply and demand zones.
🔴 Supply Zone (Order Block 1H): 1.14360 – 1.14590
📌 Strong bearish reaction from this resistance area. First scenario: rejection from this OB and a move downward.
🔵 Demand Zone (Order Block 4H): 1.13050 – 1.13430
✅ If price fails to break the resistance, we could see a retracement to this OB. Bullish reaction here may offer long opportunities.
🟢 Fair Value Gap (FVG 1H): 1.11800 – 1.12220
📉 If OB 4H fails to hold, price could drop into this FVG area – a high-liquidity zone for potential reversal.
📊 Possible Scenarios:
1️⃣ Break and hold above OB 1H → price may extend toward next OB zone at 1.15150 – 1.15400
2️⃣ Rejection from OB 1H → pullback to OB 4H → possible long setup if confirmed
3️⃣ Break below OB 4H → deeper move into FVG 1H
‼️ Avoid premature entries – wait for valid confirmations.
🔍 Insight by ProfitaminFX
If this outlook aligns with your bias, or if you see it differently, feel free to share your perspective in the comments. Let’s grow together 📈
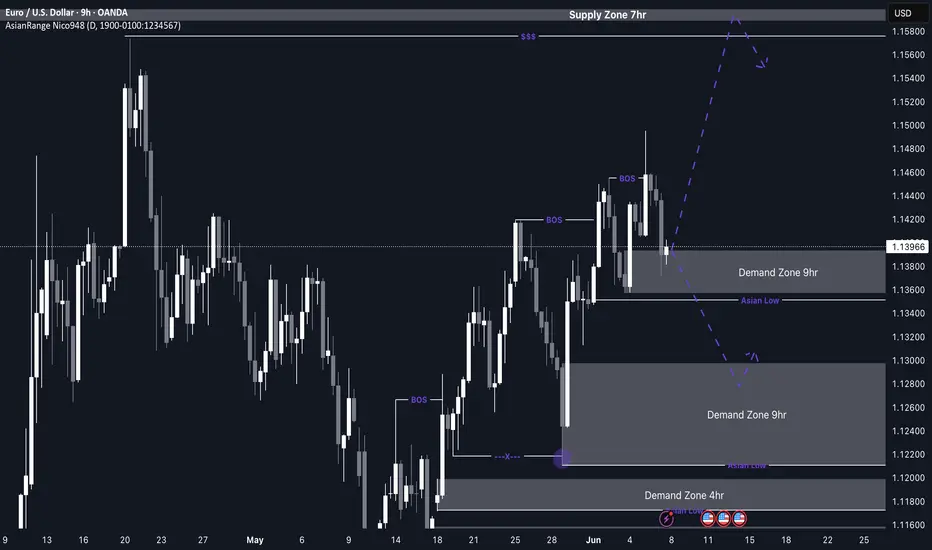
EUR/USD Potential buys from current zone or 1.12800My outlook for EU this week closely aligns with GU — both pairs are showing similar structure and direction. Price continues to form higher highs and higher lows, maintaining its bullish momentum.
Following the most recent break of structure to the upside, EU has now entered a 9H demand zone, where I’ll be watching for signs of accumulation and potential entry as the market opens on Monday.
If this current zone fails to hold, there’s a more discounted 9H demand zone just below, which could offer a cleaner long opportunity. Either way, both scenarios follow the pro trend, which adds conviction to the buy idea.
Confluences for EU Buys:
Price has broken structure to the upside and entered a clean 9H demand zone
There’s another refined 9H demand zone just below for additional confirmation
Plenty of upside liquidity remains untouched
Structure remains bullish on the higher timeframes, making this a pro trend setup
P.S. If price reacts well and continues pushing higher, I’ll be keeping an eye on the 7H supply zone above for any possible short-term bearish reaction.
Wishing everyone a successful and disciplined trading week ahead!
EURUSD Analysis – Short Bias Builds on Key Resistance RejectionEURUSD pair is currently testing a critical resistance zone around 1.1495–1.1500, with bearish rejection beginning to form on the 4H timeframe. The technical setup suggests a potential lower high forming within the context of a broader downtrend, supported by a confluence of horizontal resistance and bearish risk catalysts.
🔍 Technical Overview:
Resistance Zone: 1.1495–1.1575 (multi-timeframe key levels)
Support Levels to Watch: 1.1234 (range base) and 1.1086 (swing low)
Price Action: After a sustained rally, price is showing exhaustion near previous highs, and a rejection pattern is emerging, suggesting selling interest.
Risk Management: Stop placed above 1.1575 high, with downside targets near 1.1234 and extended toward 1.1086.
🧠 Fundamental Backdrop:
ECB Policy Outlook: Lagarde recently warned that a stronger euro and higher tariffs may hurt EU exports. This dovish tone could weigh on EUR sentiment in the medium term.
US Dollar Strengthening: The latest US labor market data (ADP, JOLTS) beat expectations, showing continued resilience in employment and wage growth. This supports the Fed's data-dependent approach, favoring a stronger USD.
Macro Tensions: Global trade concerns (Trump’s tariffs, weak China demand, Germany’s slowing job market) are adding pressure to EUR while supporting safe-haven USD flows.
ECB Consumer Expectations Survey (April): Highlights persistent inflation fears and deteriorating economic confidence.
⏳ Scenario Outlook:
✅ Bearish Bias Preferred below 1.1500 with confirmation of rejection.
🎯 Target Zone 1: 1.1234 – Strong structure & demand zone.
🎯 Target Zone 2 (Extended): 1.1086 – Major low from mid-May.
❌ Invalidation: A breakout and close above 1.1575 would neutralize the bearish outlook and open up higher targets toward 1.17.
Conclusion: The EURUSD pair presents a compelling short opportunity, with both technical resistance and macro pressure aligning for a retracement or reversal. Short setups are favored unless bulls reclaim and hold above the 1.1575 handle.

EURUSD(20250606) Today's AnalysisMarket news:
The European Central Bank cut three key interest rates by 25 basis points. Lagarde hinted that the rate cut cycle will end, and the market is no longer fully pricing in another 25 basis point rate cut this year.
Technical analysis:
Today's buying and selling boundaries:
1.1447
Support and resistance levels
1.1537
1.1503
1.1481
1.1412
1.1391
1.1357
Trading strategy:
If the price breaks through 1.1447, consider buying, and the first target price is 1.1481
If the price breaks through 1.1412, consider selling, and the first target price is 1.1391

EURUSD(20250605) Today's AnalysisMarket news:
U.S. economic data-① ADP employment increased by 37,000 in May, far below the expected 110,000 and the previous value of 62,000. ② The U.S. ISM non-manufacturing index in May fell to 49.9, shrinking for the first time in nearly a year, and the expected increase was from 51.6 to 52.
Technical analysis:
Today's buying and selling boundaries:
1.1401
Support and resistance levels:
1.1478
1.1449
1.1431
1.1372
1.1353
1.1324
Trading strategy:
If the price breaks through 1.1431, consider buying, and the first target price is 1.1449
If the price breaks through 1.1401, consider selling, and the first target price is 1.1372

EURUSD short term analysis in US sessionEURUSD is trading in the price range of 1.161 and 1.158. It is unlikely that there will be a breakout through this price range today. If the pair retreats slightly to 1.156, it is considered a good buy signal. Let's wait and see what the next short-term developments of EURUSD are.
I will send you the long term analysis of the pair tomorrow.

EUR/USD Long📍 Entry (Buy Limit):
1.1085
This is just above the 1.1000 psychological level but below previous minor structure at 1.1100.
Captures a shallow retest without risking being front-run by liquidity sweeps.
🛑 Stop Loss (SL):
1.0910
Below consolidation zone and wicks around 1.10
Provides enough space beneath the major breakout level while staying tight for R:R
🎯 Take Profit Targets:
TP1: 1.1500 (Previous weekly resistance, already tested but not broken)
TP2: 1.2000 (Next clean monthly structure level)
TP3 (macro): 1.2400 (Upper range of long-term channel, highly reactive zone)
⚖️ Risk/Reward:
Risk: ~175 pips
Reward:
• TP1: ~415 pips
• TP2: ~915 pips
• TP3: ~1,315 pips
R:R = 2.4 to 1, 5.2 to 1, 7.5 to 1

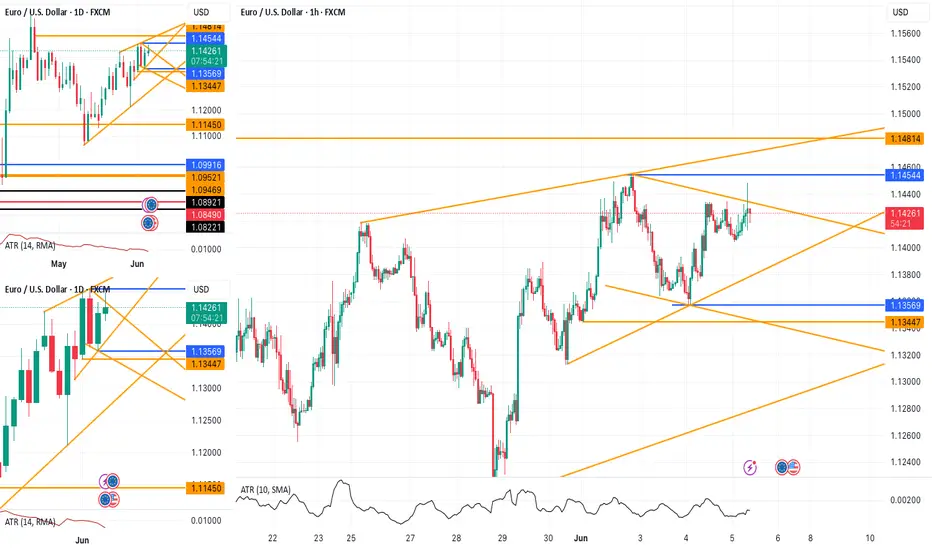
EURUSD Long Setup Above 1.14544 – Trendline in FocusFX:EURUSD is showing a potential long setup if price breaks above the 1.14544 level . The trade's potential is influenced by an ascending trendline around 1.14710 . If the market hesitates at this level, it may be wise to close the position or move the stop loss to breakeven .
ECB rate announcement in focusthe European Central Bank (ECB) will be in focus today at 12:15 pm GMT and is anticipated to reduce rates amid recent CPI inflation (Consumer Price Index) softening by more-than-expected in May to 1.9% at the headline year-on-year (YY) level from 2.2% in April. YY core inflation – a measure that excludes volatile energy, food, alcohol, and tobacco prices – also softened to 2.3% in May from 2.7% in April.
I believe the last thing the ECB wants to do is shock the markets today, so I would be very surprised if they maintained rates at current levels. The decision, however, will be far from unanimous, with divisions among the 26 members who make up the ECB’s decision-making body. Markets expect the central bank to reduce all three benchmark rates by 25 bps, which would lower the deposit facility rate to 2.00% and the refinancing rate to 2.15%. If the ECB proceeds with another rate cut, this would mark the eighth reduction since the central bank commenced its easing cycle in mid-2024.
With a rate cut already baked in, I think the question top of mind among investors is what comes next. The ECB will likely want to signal a pause following today's cut, albeit a ‘dovish pause’. In the ECB’s macroeconomic projections, analysts are also expecting notable downward revisions to inflation and growth. Therefore, it will be interesting to see how they convey this via language in their rate statement and in ECB President Christine Lagarde’s press conference.
However, I find it very unlikely that forward guidance will provide a clear path, and the central bank is likely to remain in a data-dependent mode.
While a dovish cut from the ECB could send the EUR/USD southbound today, I expect it to be short-lived if US employment data comes in lower than expected on Friday.
Despite a temporary push lower potentially unfolding in the pair today, I remain bullish EUR/USD. As shown on the chart, the pair is shaking hands with monthly resistance from US$1.1457. Those who regularly follow my research will know that I am not enthusiastic about this level, given the inability of price to push through monthly support at US$1.1134 in May. Should follow-through buying emerge and US$1.1457 bids are consumed, I will be watching monthly resistance as far north as US$1.2028-US$1.1930.
Written by FP Markets Chief Market Analyst Aaron Hill

EUR/USD Awaits ECB Decision Near 1.1400 Amid Rate Cut BetsCMCMARKETS:EURUSD FX:EURUSD EUR/USD is consolidating above the 1.1400 psychological level as markets brace for the European Central Bank’s monetary policy announcement. The ECB is widely expected to cut its Deposit Facility Rate by 25bps to 2.00%, marking its seventh consecutive rate cut since June 2024.
Technically, the pair continues to trade within a well-defined ascending channel, reflecting a broader bullish structure. Current price action is facing a minor resistance near 1.1421, which is the top of the short-term range and also a key trendline rejection zone. A clean breakout above this area could expose the monthly resistance near 1.1557.
However, if OANDA:EURUSD EUR/USD fails to breach this level initially, a pullback toward 1.1366 (channel base support) is possible before bulls regain control. The bullish setup remains valid as long as price holds above this support zone.
Traders should monitor the ECB press conference for signals on whether the central bank may pause further easing later this year.
Resistance : 1.1421 , 1.1557
Support : 1.1366 , 1.1250

Can it stabilize above 1.14?The euro against the US dollar traded in a narrow range during the North American session, with the current exchange rate consolidating near the 1.14 level as the market awaits the European Central Bank's (ECB) interest rate decision this Thursday.
In the US, the ADP employment data far missed expectations, with private sector employment increasing by only 37,000 in May—significantly below the market forecast of 115,000. This weak data triggered a decline in the US dollar, pushing the EUR/USD exchange rate to rebound to the 1.1400 zone. While the exchange rate is expected to continue its rebound momentum, its upside potential remains limited. If the key resistance level of 1.1418 is effectively broken, it could open the door for further upward movement to the 1.1450-1.1480 range.
Humans need to breathe, and perfect trading is like breathing—maintaining flexibility without needing to trade every market swing. The secret to profitable trading lies in implementing simple rules: repeating simple tasks consistently and enforcing them strictly over the long term.


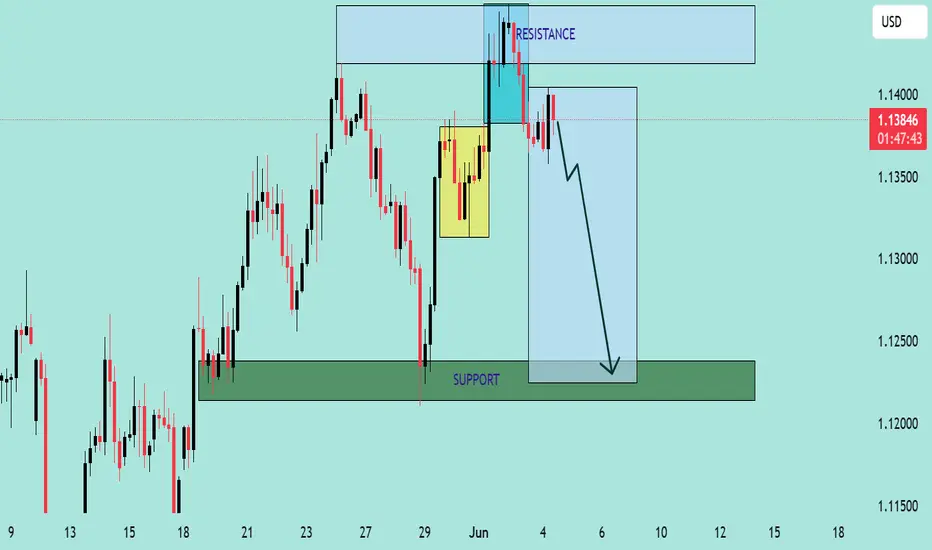
EUR/USD Bearish Reversal Setup Analysis EUR/USD Bearish Reversal Setup Analysis 🧠💼
The chart presents a clear bearish outlook on EUR/USD, with well-defined resistance and support zones, along with a projected short-term price trajectory. Here's a professional breakdown:
🔍 Key Technical Highlights
🔵 Resistance Zone (~1.1400 - 1.1430)
Price recently tested this resistance area and formed multiple wicks, signaling strong seller presence.
A bullish liquidity grab is evident in the highlighted cyan box, suggesting a fake breakout before reversal.
🟡 Supply Zone / Order Block
The yellow box marks a previous consolidation area (potential order block), which was revisited and rejected — reinforcing bearish intent.
🔽 Current Price Action
Price is trading around 1.1378, having broken structure and failed to maintain momentum above the resistance.
Sharp rejections and bearish engulfing candles imply strong selling pressure.
🟢 Support Zone (~1.1230 - 1.1260)
This is a previous demand area where price rallied strongly.
The large blue projection box and arrow suggest a bearish continuation targeting this support region.
📉 Bias: Bearish
Structure: Lower highs forming after liquidity grab.
Price Action: Bearish engulfing after resistance rejection.
Market Sentiment: Sellers appear in control after failing bullish breakout attempt.
🎯 Trade Idea
Entry: After confirmed rejection from resistance (~1.1370–1.1385)
TP: Around 1.1240 (support zone)
SL: Above recent highs (~1.1420)
Risk/Reward: Favorable R:R as the setup targets a large swing down.
EURUSD and GBPUSD Breakout?Hello traders, this is a complete multiple timeframe analysis of this pair. We see could find significant trading opportunities as per analysis upon price action confirmation we may take this trade. Smash the like button if you find value in this analysis and drop a comment if you have any questions or let me know which pair to cover in my next analysis.

EURUSD Trade Setup: Heres My Trade Plan!📈 EUR/USD Trade Outlook: Bullish Trend in Focus 🇪🇺💵
I'm currently watching EUR/USD, and it’s holding a strong bullish trend — with clear higher highs and higher lows across the board 🔁. On the 4-hour timeframe, price has pulled back into equilibrium, and I’m eyeing a potential buy opportunity if the structure continues to hold 🛒.
📚 Looking at historical price action, this setup has played out reliably in the past. That said, it's important to acknowledge that deeper pullbacks can occur — often sweeping liquidity below previous lows before resuming the trend 💧.
⚠️ This is a real risk, so consider conservative position sizing and always manage your risk appropriately.
💬 Drop a comment below if you're watching this setup too — I’d love to hear your take!
❗️Disclaimer: This is not financial advice. The content shared is for educational and informational purposes only. Please do your own analysis and trade responsibly.

Euro Pulls Back – Eyes on ECB and Tariff TurmoilCMCMARKETS:EURUSD FX:EURUSD EUR/USD pulled back from a six-week high of 1.1454 to trade near 1.1379, down 0.52% on Tuesday, as strong U.S. labor market data and revived trade tensions lifted the dollar. April JOLTS job openings rose to 7.39M, beating expectations, signaling a resilient U.S. economy despite a 3.7% drop in factory orders.
In parallel, Trump’s announcement to double tariffs on steel and aluminum has reignited trade war concerns. Markets are also watching for a potential Trump–Xi call later this week.
Meanwhile, the Euro lost ground after May HICP inflation in the Eurozone fell to 1.9%, below the ECB’s 2% target. With core inflation slowing as well, markets have priced in a 25 bps rate cut at Thursday’s ECB meeting.
Technically, OANDA:EURUSD EUR/USD is still trading within a rising channel but rejected key minor resistance zone just below the descending trendline. A confirmed breakout above this area could open the path toward monthly resistance near 1.1559. On the downside, Support Zone 1 (around 1.1375) must hold to maintain the bullish bias; further weakness may expose Support Zone 2 (around 1.1338)
Resistance : 1.1445 , 1.1559
Support : 1.1375 , 1.1338

Elliott Wave Insight Into EUR/USD’s Recent MovesThe EUR/USD chart has delivered a clean Elliott Wave sequence, which helps us forecast what may come next.
Wave Count Overview
The structure leading up to the high shows a clear five-wave impulsive rally, ending at Wave 3 in yellow.
This was followed by a corrective A-B-C zigzag, with:
A sharp Wave A down
A shallow Wave B bounce
A clean Wave C drop, matching Wave A in length, bottoming at the 100% Fibonacci projection around 1.10711.
Why This Matters
Elliott Wave theory tells us that a completed zigzag correction—especially when followed by a consolidation like a triangle—often leads to a continuation in the direction of the larger trend. If this consolidation is indeed a Wave 4 triangle, Wave 5 may soon emerge with strength.
What to Watch For:
Breakout from the current flag/triangle pattern.
Confirmation via price closing above the Wave B high.
Strong bullish momentum and rising volume as signs Wave 5 is kicking off.
Conclusion
EUR/USD may be gearing up for a Wave 5 breakout, following a classic zigzag correction and potential triangle consolidation. If this pattern breaks to the upside, it could offer a great trend continuation trade opportunity.

Has EUR/USD entered a medium-term correction?The EUR/USD has experienced a corrective pullback in a range-bound manner, touching the 1.14 level during the European session, approaching the Bollinger Band Midline support at 1.129. Earlier, the exchange rate retreated after encountering resistance near the 1.1450 key resistance level. Influenced by Euro-U.S. economic data divergences, the broader European market weakened, exerting downward pressure on the euro. Ahead of this week's ECB monetary policy meeting, the pair is likely to remain range-bound between the 1.1350 support and 1.1500 resistance levels.
If the ECB signals further monetary easing, the exchange rate may decline to test the 1.1350 support zone, with a potential extension of the downward move targeting the Bollinger Band Midline at 1.1292. Conversely, if the market deems the rate-cut expectations to be fully priced in and the ECB delivers a neutral policy stance, this could prompt the EUR/USD to retest the 1.1500 resistance level.
Humans need to breathe, and perfect trading is like breathing—maintaining flexibility without needing to trade every market swing. The secret to profitable trading lies in implementing simple rules: repeating simple tasks consistently and enforcing them strictly over the long term.
Trading Strategy:
buy@1.13500-1.13600
TP:1.13800-1.13900

EUR USD Trade Setup 1 hour timeframe EUR USD Trade Setup 1 hour timeframe
EUR USD has formed a Bullish Break and Retest pattern on the 1 hour timeframe and the price is currently at the retest level.
EURUSD Bullish Signal | Technical + Custom AlgoSmart Trend Signal | Technical Analysis + Custom Algorithm
This signal is the result of a combination of classic technical trend analysis and a proprietary software I personally developed.

EUR/USD Eyes More Upside PotentialDuring the European session, the price showed a trend of first fluctuating and then rising sharply. Currently, the price is at 1.1433, higher than the intraday moving average of 1.1380, indicating that the bulls are in the dominant position. According to ING (International Netherlands Group), the EUR/USD has some intraday resistance at 1.1425, and above this level, it is expected to rise to 1.1500 in the short term. The euro has formed a bottom above 1.1200 and started a new round of upward movement against the US dollar. The EUR/USD has broken through the resistance level of 1.1280, with a bullish trend. The first major resistance level is at 1.1450. If the closing price is above the 1.1450 level, it may lay the foundation for another wave of upward movement. In this case, the currency pair may even break through the resistance level of 1.1500. The next major target for the bulls may be near the resistance level of 1.1580.
Humans need to breathe, and perfect trading is like breathing—maintaining flexibility without needing to trade every market swing. The secret to profitable trading lies in implementing simple rules: repeating simple tasks consistently and enforcing them strictly over the long term.
Trading Strategy:
buy@1.1300-1.1350
TP:1.1450-1.1500

EURUSD 4hEURUSD 4h
I threw a bucket into the sea, God
I have no control over my heart
I'm done today's speech, an analysis of the Euro to Dollar currency pair on the 4-hour time frame
which I published in early May
on the Trading View site
Let's see how far it turns out to be right, okay?
