EUR/USD 1-Hour Timeframe – Long Position Setup
Entry Point: Initiate a long position slightly below 1.13513.
Stop-Loss Range: Set between 1.13056 and 1.13041 to manage risk.
Target Levels:
Primary Target: A breakout above 1.13822.
Secondary Target: A potential retest of 1.14304.
Important Note:
Avoid entering a long position if the price falls below 1.13056, as this may indicate a bearish reversal.
Tags: OANDA:EURUSD
Eurusdlong

EUR/USD Update: Bullish Outlook Towards 1.14190 and BeyondHi Everyone,
As we projected in our analysis last week, EUR/USD corrected throughout the week and approached a retest of the 1.12000 level.
We expect the price to potentially retest 1.12000 and confirm it as support before advancing further to challenge the May 26 high of 1.14190. This would further reinforce our outlook for a potential long-term bullish trend.
Of course, the price could also challenge the 1.14190 high without a second retracement, should there be strong buying pressure early in the week. A successful breach of this level would likely drive the price higher towards the 1.15240 level.
We will provide further updates on the expected path for EUR/USD should the price reach this target.
The longer-term outlook remains bullish, with expectations for the rally to extend toward the 1.2000 level, provided the price holds above the key support at 1.10649.
We will continue to update you throughout the week with how we’re managing our active ideas and positions. Thanks again for all the likes/boosts, comments and follows — we appreciate the support!
All the best for the week ahead. Trade safe.
BluetonaFX

Can look for buy opportunities?EUR/USD Analysis Based on Engulfing Zones:
The red zone that has been marked is based on a weekly engulfing sell. The market has already touched this zone and dropped from there.
Now, among the green zones marked, the first one is taken from a 4H (4-hour) engulfing pattern, which has slightly less potential compared to the weekly one. However, the market can still go for a buy from here.
For now, wait until the market taps into any of the buy zones—then we can look for buy opportunities.
Three zones have been marked.
DYOR (Do Your Own Research)! Not Financial Advice.

Story behind EURUSD chart and US10Y and DE10Y risk premiumLet’s have a look at the Currency and Bond markets today after an eventful last few weeks in both markets. After Moody’s downgrade of the US Gov bonds the markets look seemingly quiet. There has been no sudden spike in the US10Y. But it makes lot of sense to look beneath the hood and compare the Bond and the currency markets. Today we are looking into the 2 largest currency pairs, i.e. FX:EURUSD and the largest bond markets i.e. US10Y and German 10Y.
It is astounding to observe how the Fib retracement levels from the peak and troughs in the FX:EURUSD and TVC:US10 - TVC:DE10Y charts coincide. Both indicators at @ 0.618 Fib levels. As anyone would expect when the FX:EURUSD makes new highs the diff between TVC:US10Y and TVC:DE10Y hits new highs as investors long the FX:EURUSD chart and in that way hedge the risk in the TVC:US10Y without going short TVC:US10Y which will then adversely affect the investors portfolio. Institutional investors have been unwinding the long position in the TVC:US10Y by going long EUR, YEN and CHF in the currency markets without explicitly selling the US10Y.
Going back to the charts, what can we expect in the medium to long term? In my expectation both the charts can reach 0.786 Fib level and subsequently the 1.0 Levels. This will take the FX:EURUSD from 1.13 to 1.18 by the end of 2025 and then to our long-term target of 1.25. If those levels hold onto in the currency markets, then the risk premium of TVC:US10Y over TVC:DE10Y which is denoted in the chart by TVC:US10Y - TVC:DE10Y will go from 1.9% to 2.1% and then top out at 2.3%. May be this is the way USD will lose some of its market share as world reserve currency status.
Verdict: USD Reserve currency status weakening. Buoyant FX:EURUSD marching towards 1.25. TVC:US10Y - TVC:DE10Y can reach 2.3%.

What's your view ( scenerio 1 or 2 )
---
📈 EUR/USD Weekly Chart – Wave 4 in Progress?
Wave 3 looks complete and price is now hovering in a key correction zone, hinting at the start of Wave 4.
Two possible paths are unfolding:
🔴 Scenario 1: Shallow Wave 4 correction → breakout to Wave 5, targeting 1.16667 and beyond.
🔵 Scenario 2: Deeper Wave 4 correction → retest of demand zone near 1.08, followed by a strong Wave 5 rally.
🧠 Elliott Wave traders, it’s time to stay sharp!
The reaction near the mid-box and support zone could define the next major move for the Euro.
💬 What’s your bias here — is this the start of Wave 5 or a fakeout before a deeper drop?
Comment your view 👇
#EURUSD #ElliottWave #ForexWeekly #GreenFireForex #WaveAnalysis #TechnicalAnalysis #SupplyAndDemand
---

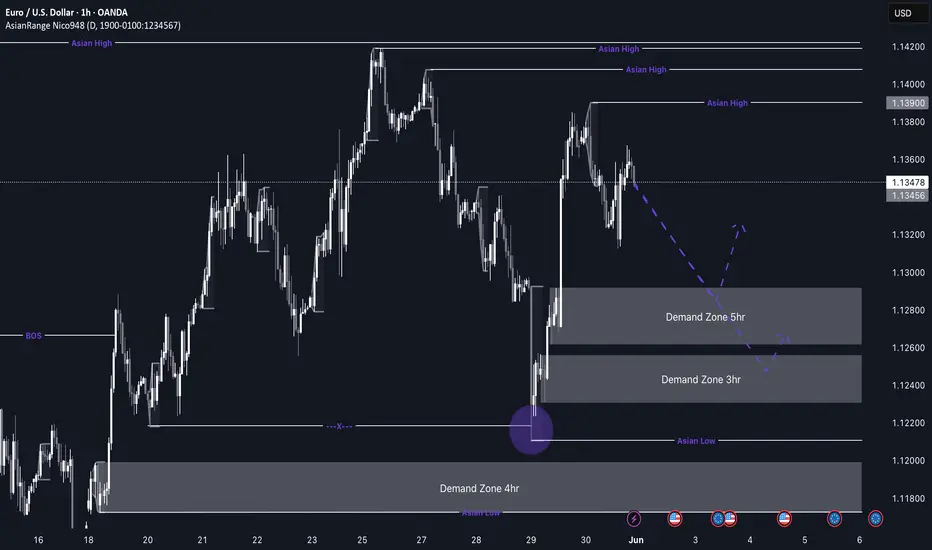
EUR/USD Potential longs to the upsideEU Weekly Outlook — Bullish Pro-Trend Setup in Focus
This week, my EU analysis is centered around the pro-trend movement to the upside. Price has recently broken structure and in doing so, has left behind clean demand zones on the 5H and 3H timeframes. I’ll be watching closely to see when price decides to mitigate these levels for a potential long setup.
Since price is still a bit far from these zones, short-term sells may be possible, but with no strong nearby supply, I’ll be staying patient and letting price action guide me. The key is to avoid marrying any one bias and remain adaptable.
Confluences for EU Buys:
- Strong bullish structure on higher timeframes
- Clean and unmitigated 5H and 3H demand zones
- Plenty of liquidity above, including Asia highs
- This is a pro-trend trade, aligning with market flow
- DXY analysis supports a bullish EU outlook
P.S. If price shifts and breaks structure to the downside, then we could consider short-term sell setups — but for now, I’m focused on the long opportunity forming from demand.
Have a great trading week and stay sharp! 🧠💹
EUR/USD 4H Outlook - Wave 5 SetupElliott Wave Structure:
We're mid-cycle of a larger impulsive wave count:
Wave (1) through (4) appear completed
Price is now potentially building the early phase of wave (5)
Subwaves within this current cycle also show clean internal structure:
Latest corrective wave (4) held just above invalidating level at 1.12236
Strong confluence at 71% Fib + demand + structure → ideal wave (4) termination
Price Action & Confluence:
Break and retest of the descending correction confirms bullish continuation
Higher low formed above major structure (X), aligning with wave (4) bottom
Trendline + EMA + volume spike on reaction = institutional interest
Key Levels:
🔴 Invalidation: 1.12236 (break below invalidates wave (4) structure)
📈 Targets for Wave (5):
Short-term: 1.1480 (prior high)
Medium-term: 1.1983 (measured move of wave (5) projection)
🚀 Summary:
EUR/USD is primed for a bullish wave (5) extension. With a clean wave count, a confirmed bounce off the 71% retracement, and price holding above invalidation, bulls are in control unless 1.12236 breaks.

EURUSD,GBPUSD and AUDUSD Analysis todayHello traders, this is a complete multiple timeframe analysis of this pair. We see could find significant trading opportunities as per analysis upon price action confirmation we may take this trade. Smash the like button if you find value in this analysis and drop a comment if you have any questions or let me know which pair to cover in my next analysis.

EUR/USD - BUY BUY BUY!Here in my personal Opinion I can see a few potential reasons to buy with high confidence.
Firstly- Weekly timeframe is showing a Bullish movement with us closing last week with a strong volume candle.
Secondly- On the Daily time frame we can see this is a high possibility of a 5th leg of elliots wave to finish this Bullish run.
Thirdly- The Daily has pushed out of the 71% level from the first demand zone. Following this on the 4H Time frame we can notice this previous push has also giving a strong Liqudity Grab into the new 71% level telling me Buyers are still highly in control.
I will be looking to trade into Buy side Liquidity after this Volume gap has been filled
Follow along for more updates

Bullish Breakout in EUR/USD: Key Levels to Watch This WeekHi everyone,
EUR/USD had a strong week, climbing higher from the May 12 low and further reinforcing our view of a potential long-term bullish trend.
We anticipate further upside towards the 1.13768–1.13940 zone, followed by a possible pullback toward the 1.1200 area. We’ll share more updates on the expected path for EUR/USD if and when price reaches that zone.
The longer-term outlook remains bullish, and we expect the rally to extend towards the 1.2000 level, as long as price holds above the 1.10649 support.
We’ll be keeping you updated throughout the week with how we’re managing our active ideas. Thanks again for all the likes/boosts, comments and follows — we appreciate the support!
All the best for the week ahead. Trade safe.
BluetonaFX

EURUSD is Ready for a Bullish MoveHello Traders
In This Chart EURUSD HOURLY Forex Forecast By FOREX PLANET
today EURUSD analysis 👆
🟢This Chart includes_ (EURUSD market update)
🟢What is The Next Opportunity on EURUSD Market
🟢how to Enter to the Valid Entry With Assurance Profit
This CHART is For Trader's that Want to Improve Their Technical Analysis Skills and Their Trading By Understanding How To Analyze The Market Using Multiple Timeframes and Understanding The Bigger Picture on the Charts

EURUSD Analysis - Waiting for movement
EURUSD has broken above the 1H resistance and has retested it, which is now acting as temporary support.
🔄 If price starts ranging around this level, we could see a short-term bearish move of a few dozen pips, targeting the buy-side liquidity and unfilled orders highlighted on the chart.
📈 However, if price gains bullish momentum from here, there's a potential for a 100-pip upward move.
We’re currently watching how price interacts with the supply and demand zones, to align our entries with it on the lower timeframes.
🔍 Insight by ProfitaminFX
If this outlook aligns with your bias, or if you see it differently, feel free to share your perspective in the comments. Let’s grow together 📈

EUR USD Trade Setup 1 hour timeframe EUR USD has formed a demand level around price 1.12600 and the market is slowly approaching this level, we need to wait for price to tap on the demand zone before making any trading decisions.

EURUSD Reaches Key Resistance – Reversal or BreakoutEURUSD has rallied back to the 1.1382 resistance level, a zone where price previously rejected multiple times. Current structure suggests price is approaching a decision point, where it may either:
Form a double top or head-and-shoulders reversal
Or break out toward 1.1573, the next major resistance
Key Levels:
Resistance: 1.13825 → Critical decision zone
Support: 1.11442 → First major downside target
Deep Support: 1.10846 → Recent low
Scenarios to Watch:
🔹 Bearish Case (Primary Setup)
Price fails to break above 1.1382
Reversal candlestick forms below resistance
Breakdown may target:
1.1144 (first support)
1.1084 (continuation target)
🔹 Bullish Case (Less Likely Unless Confirmed)
Break and close above 1.1382
Bullish continuation to 1.1573
Would signal shift in medium-term trend bias
Chart Pattern Notes:
Price has made multiple lower highs, but also held structure
A triple top or reversal setup is forming unless bulls break decisively
Bearish wedge and neckline structures from past price action support downside risk
Fundamental Watch:
USD volatility from Fed speakers, PMI data
Eurozone risk sentiment and ECB inflation comments
Correlation with DXY (which is near support)
Conclusion:
📌 Rejection at 1.1382 likely leads to downside toward 1.1144
📌 Break above 1.1382 invalidates bearish setup and targets 1.1573
Wait for confirmation candle or momentum before execution.

EUR USD Entry Setup EUR USD has formed a bullish break and retest and has also retraced back to the 50-618 FIB retracement level.
The trend is bullish so we will continue to look for buying opportunities

Deciphering EURUSD —Highest Level Since 2018 (1.40)This was a hard chart, I couldn't quite put my finger on it. I had to check multiple timeframes and several indicators, it was all mixed, plus, I had the geopolitical landscape in mind which made it even harder. All is clear after looking at the monthly timeframe. The weekly and daily MACD were also of help. MA200 revealed the trend. The RSI as well.
Here is the conclusion: The Euro is going to rally against the dollar. Next long-term target is 1.40 as shown on the chart. There will be a strong rise on this pair.
Current monthly candle is quite revealing, this month will close ultra-strong, super bullish signal. Four months closing green. Rising volume.
I don't know how you trade this stuff but the trend is up. Betting with the trend can increase positive results. EURUSD is going up. Up, up, up, up, up, up, up.
Namaste.

Last. Chance yo meet profit. (EURUSD)
Trade Idea (Short-Term Setup):
1. Sell Setup (Short-term correction - Wave 4)
Entry: Near current price (1.13730), especially if bearish confirmation appears on a lower timeframe (like bearish engulfing, break of structure).
Target: Bullish OB zone around 1.12910–1.12867.
Stop Loss: Just above the recent high or red zone (~1.14127).
Risk-Reward: Looks favorable (~1:2 or more).

EUR/USD Breakdown Imminent – Rising Wedge at Major ResistanceOn the 1H chart, EUR/USD has developed a Rising Wedge pattern, a classical bearish reversal formation. The pair has been moving higher within a tightening structure, marked by converging trendlines—indicating weakening bullish momentum.
What makes this pattern more compelling is that it’s occurring just below a well-defined Major Resistance Zone around 1.1380–1.1400, where previous attempts to break higher have failed. This area has historically acted as a strong supply zone, increasing the probability of a reversal.
🔍 Key Technical Components:
Rising Wedge Pattern: The wedge reflects a temporary uptrend with weakening strength. Bullish candles are getting smaller, and volume appears to be fading (not shown here but typically expected in this setup).
Black Mind Curve Support: A custom support curve illustrating the underlying parabolic trend. Once this is broken, it often leads to a steeper selloff.
Change of Character (CHOCH): Around the 1.1260 level, there's a possible shift from bullish to bearish structure. If price breaks and closes below this level, it will likely confirm a momentum reversal.
Target Projection: The measured move and previous structural support suggest a drop toward 1.11479, which coincides with a prior demand zone. This also aligns with a potential liquidity sweep beneath recent lows.
🔔 Price Action Signals to Watch:
Bearish engulfing candles or strong rejections from the wedge’s upper boundary.
Breakdown below the lower wedge line and the curved support.
CHOCH confirmation – market structure shift from bullish to bearish around 1.1260.
Retest of the wedge breakout level, followed by continuation to the downside.
📌 Trading Plan (Not Financial Advice):
Entry: On break and retest of wedge support.
Stop Loss: Above the wedge high or resistance (~1.1400).
Target: 1.11479 for first take-profit level; partials can be taken at 1.1260 if needed.
📉 Bias:
Short-Term Bearish – Only upon wedge breakdown and confirmation.
🧠 Minds Section (Expanded for Traders' Perspective)
EUR/USD is approaching a critical technical juncture. We are seeing a textbook rising wedge formation into a major resistance zone, signaling exhaustion of bullish strength. While the pair has enjoyed upward momentum, price action is showing signs of slowing, and the structure is no longer sustainable.
This pattern often traps late buyers before reversing. We are closely watching the lower wedge boundary and curved support—a breakdown here will likely trigger bearish momentum, especially with the CHOCH area near 1.1260 acting as a structure-defining level.
If sellers gain control and the breakdown confirms, there’s high probability for a fall to 1.11479, targeting prior demand zones and potential liquidity pockets.
Now is the time to be cautious if long, or begin planning short setups. Wait for confirmation—no need to rush the trade.

EURUSD,GBPUSD,AUDUSD and NZDUSD possible bounce?Hello traders, this is a complete multiple timeframe analysis of this pair. We see could find significant trading opportunities as per analysis upon price action confirmation we may take this trade. Smash the like button if you find value in this analysis and drop a comment if you have any questions or let me know which pair to cover in my next analysis.

EURUSD H4 Chart Outlook for Shorter Term 26-30 May 25You are seeing EURUSD H4 Chart, Right EURUSD is standing in mid-term Bullish Trend with Bullish Channel
Kindly follow the Zones Accordingly and always place SL
Disclaimer: Forex is Risky

EURUSD Weekly PerspectiveOn ICT Cycles, Maybe EUR Can Go Higher To Buyside Equals..
But it needs confirmation from the shorter-term views and confirmation from the dollar index.
Over time, this idea will be updated according to the coming days.
CPI profile was able to make a good climb and probably provides a fairly good confirmation for the continuation of the upward trend.
Have a good week and trades.

EURUSD Breaking Above Resistance Line; Wave 5 In PlayEURUSD moved nicely higher in April, into the 1.15–1.16 area, a resistance where pair slowed down at the end of wave 3, that put retracement in play. However, a pullback has been made in three waves, so its seen as temporary within the broader uptrend. We saw some deeper retracement down to 1,1, near the 38.2% Fib from where we can see some nice turn up, above the trendline resistance so it appears that bulls are in play for wave 5. Therefore, be aware of more upside afte some intraday dips. Support is at 1.1266 area.
GH
