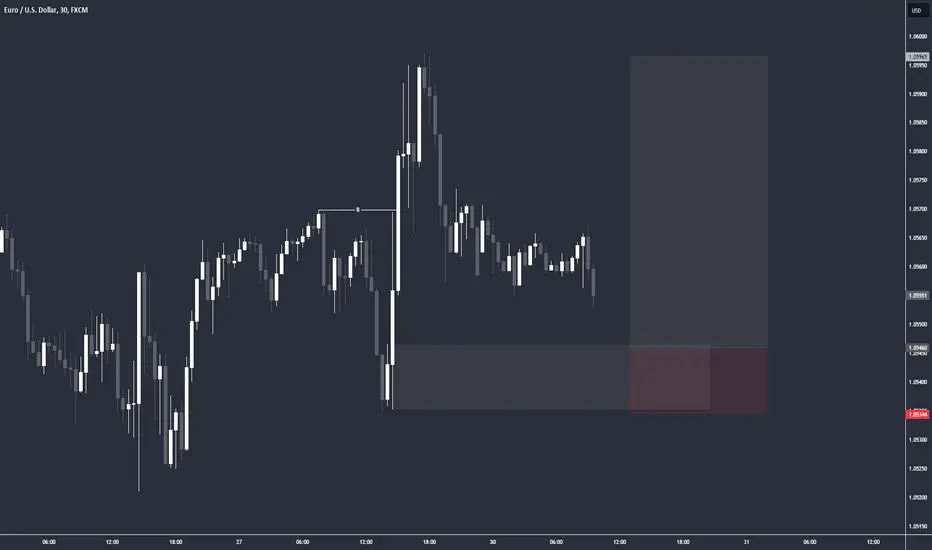
Long Position traders looks happy! EURUSD {08/11/2023}Educational Analysis says EURUSD may go long according to my technical.
This is not an entry signal. I have no concerns with your profit and loss from this analysis.
Why long?
Broker FXCM.
Bull/Long Traders look positive on the long position of this pair, The Last lower high has been respected, Which means the market is in bullish trades for this pair.
EURUSD fair value gaps are unfilled in a 4-hour time frame.
The last Analysis is jointly connected in this updated one.
So, trade is already on with RR is 1: 50.44
I HAVE NO CONCERNS WITH YOUR PROFIT OR LOSS.
Happy Trading, Fxdollars.
Eurusdlongsetup

EURUSD Top-down analysis We are monitoring the EUR/USD pair with the intention of entering a trade at the pivot line. This setup is believed to offer a favorable risk-reward ratio. You should stay vigilant and watch for confirmation of this potential trading opportunity on your chart (📊) to make an informed decision (👀).

The USD fell, extending the decline from last week. Will the EURThe U.S. dollar edged lower in early European trading Monday, falling to a six-week low and extending last week's decline on a less hawkish stance from the Federal Reserve.
At 03:20 ET (08:20 GMT), the Dollar Index, which tracks the greenback against a basket of six other currencies, fell 0.1% to 104.782, after falling more than 1% last week, the sharpest decrease since the middle of last year.
The dollar has weakened since the Federal Reserve's policy-setting meeting last week, when the central bank offered dovish signals about more interest rate hikes.
EUR/USD rose 0.1% to 1.0743, with the euro rising to levels last seen in September on dollar weakness, rather than any form of regional economic strength. Which area?
This tone was reinforced by Friday's official jobs report, which showed that US nonfarm payrolls grew less than expected in October. The data suggests the US labor market is cooling. more, which has been the main driver of the Fed's hawkish stance this year.

EUR/USD Pullback scenario, 1.0660 possibleDear traders, EUR/USD has reached the 1.0720 bullish target
which I have been saying for 2 weeks. However, the price has overshot
the target and extended well beyond it.
That being said, EUR/USD has a chance of a pullback now. The price can
reach 1.0660 in the coming days. So, watch out for bearish price action
and and consider selling if you get the appropriate entry

xauusd sell limitxauusd sell limit with risking 1 percent seeing that the other must take a lot of liquidity

EUR/USD at channel support + Pinbar; reversal imminent?Dear traders, I understand most of you are waiting for an uptrend
in EUR/USD. Well, it might be just around the corner.
I will give you the technical reasons on why EUR/USD might move upwards.
Firstly, notice the pinbar candlestick in the daily chart , which usually leads
to trend reversals.
Secondly, notice how the price has bounced back from the channel support .
So, a combination of these two factors can make EUR/USD move towards
1.0720 in the coming days.
However, the channel is a bearish channel and a breakdown of this would cause
quite a big fall in EURUSD. So, you need to keep this in mind.

EUR/USD reaching towards the resistance at 1.0720Hello traders, in my last week's EUR/USD update I advised buying
when the price was near 1.0550. That buy trade generated nearly
100 pips profit.
Currently, EUR/USD looks all set to reach the top of the price channel
at 1.0720. That area also happens to the 100-day EMA level on the daily
chart. So, it needs to be seen how price reacts if it reaches the 1.0720 level.

EUR/USD reversal underway, 1.0720 in sightDear traders, I understand most of you are waiting for an uptrend
in EUR/USD. Well, it might have just began
I will give you the technical reasons on why EUR/USD might move upwards.
Firstly, notice the pinbar candlestick in the daily chart, which usually leads
to trend reversals.
Secondly, notice how the price has bounced back from the channel support.
So, a combination of these two factors can make EUR/USD move towards
1.0720 in the coming days.
However, the channel is a bearish channel and a breakdown of this would cause
quite a big fall in EURUSD. So, you need to keep this in mind.

EURUSD - Potential downside to imbalance ✅Hello traders!
‼️ This is my perspective on EURUSD.
Technical analysis: Now price is in bearish order block and we could see a rejection only if price changes the structure on lower timeframe. I see a potential downside price to fill the imbalance lower.
Like, comment and subscribe to be in touch with my content!

EURUSD 4H Midday updateA narrow range has dominated trading in the EUR/USD pair since the morning, awaiting the release of US economic data, which is expected to cause mixed trading in the markets.
The general expected tendency for today: Neutral
Pivot Price: 1.06295
Resistance prices: 1.06634 & 1.06871 & 1.07067
Support prices: 1.06054 & 1.05840 & 1.05567

EURUSD: The USD increased before the Fed's decision, EURUSD...EUR/USD fell 0.1% to 1.0562, after data showed prices rose just 2.9% in the euro zone in October, the slowest pace since July 2021.
ECB policymaker Joachim Nagel said on Tuesday that the European Central Bank must keep interest rates high enough for long enough as inflation in the euro zone has not been overcome despite a significant decline. told in the past year.
However, this data leads to the perception that the ECB has completed its tightening and the euro could weaken further if Fed Chairman Powell is seen to take a hawkish stance at the end of the session.

EUR/USD Buy Idea 31/10/23Trade Details
Buy Limit
Entry: 1.05566
Take Profit 1: 1.05817
Take Profit 2: 1.06250
Take Profit 3:
Stop Loss: 1.05467 (10 PIPS)
Key Notes
Order flow: Bullish
Trend: Bullish
Structure: Broken
Entry at order block
Disclaimer:
This is just a sample template and should not be used as financial advice. Always do your own research before making any trading decisions.

EUR/USDAnalysis of the euro against the dollar: We will witness a decline next week to rebound from the strongest support

EUR/USD Buy Idea 30/10/23Trade Details
Buy Limit
Entry: 1.05460
Take Profit 1: 1.05683
Take Profit 2: 1.05965
Take Profit 3:
Stop Loss: 1.05344
Key Notes
Order flow: Bullish
Trend: Bullish
Structure: Broken
Entry at order block (Demand)
Disclaimer:
This is just a sample template and should not be used as financial advice. Always do your own research before making any trading decisions.
EURUSD BUY FROM STRONG SUPPORT ZONE!!!HELLO TRADERS,,
As i am watching this pair is currently trade as we had analysis in our previous chart
which is attached in comments and successfully achieved given Tp's now i am expecting euro will drop more till the weekly support zone as we know the ECB Interest rates of Oct noting changed
and ECB President Christine Lagarde had a dovish speech in previous week for euro so we are expecting more downside to the strong support zone ahead and then we will get buying trades from that zone with a very low risk and looking for higher rewards
This is just Trade Idea kindly share Ur thoughts on EURUSD Pair it will help traders community
we appreciate Ur loves and support Stay tune with Us for more updates

Weekly chart analysis for EUR/USD: Signs of reversal?Hello traders, sometimes, it is essential to analyze the charts in the weekly
timeframe to get the bigger picture of the trend. Of course, it doesn't mean
that you must take your entries on the weekly timeframe.
So, if you look at the weekly chart of EUR/USD, the very first thing that you would
notice is the weekly support around the 1.05 area is unbroken .
Secondly, if are seeing the formation of a base in the level between 1.05-1.06.
So, in the coming trading sessions, if we see a strong impulsive move to 1.0650
and beyond, expect EUR/USD to reach 1.08 and even higher over the course of
the next few weeks.

EURUSD and GBPUSD Top-down analysisHello traders, this is a complete multiple timeframe analysis of this pair. We see could find significant trading opportunities as per analysis upon price action confirmation we may take this trade. Smash the like button if you find value in this analysis and drop a comment if you have any questions or let me know which pair to cover in my next analysis.

EURUSD - H4\D1EURUSD
Locally, the price is moving in an ascending channel, and the corrective movement in this range may continue to the level of 1.07500. To consider the possibility of selling and continuing the downward movement, it is better to wait for the consolidation of the channel level and retest. with targets up to 1.00000 (parity)
What can you expect?
You can consider entering from the nearest levels of 1.05500 with a small risk, in theory, with a target of 1.07500.
It is better not to take increased risks; correction is being traded. Cancel the idea if the price consolidates at the channel level.
Long
Targets 1.06374 – 1.06954 – 1.07500

EUR/USD Buy Idea 23/10/23Trade Details
Buy Limit
Entry: 1.05501
Take Profit 1: 1.05706
Take Profit 2: 1.06172
Take Profit 3:
Stop Loss: 1.05423
Key Notes
Order flow: Bullish
Trend: Bullish
Structure: Broken
Entry at Golden Zone
Disclaimer:
This is just a sample template and should not be used as financial advice. Always do your own research before making any trading decisions.

EUR/USD Buy Idea 24/10/23Trade Details
Buy Limit
Entry: 1.05540
Take Profit 1: 1.06108
Take Profit 2: 1.06940
Take Profit 3:
Stop Loss: 1.05370
Key Notes
Order flow: Bullish
Trend: Bullish
Structure: Broken
Entry at Golden Zone
Disclaimer:
This is just a sample template and should not be used as financial advice. Always do your own research before making any trading decisions.

EURUSD Trades Looking For Long, But Daily is Down.{25/10/2023}Educational Analysis says EURUSD may go long according to my technical.
This is not an entry signal. I have no concerns with your profit and loss from this analysis.
Why long?
Broker OANDA.
After a downtrend on the daily timeframe, A 4-hour time frame looks promising up to the recent lower high,
Long setup after eating stop loss from Short Sellers,
Because EU fair value gaps are unfilled in a 4-hour time frame.
The last Analysis is jointly connected in this updated one.
So, trade is already on with RR is 1: 4.45
I HAVE NO CONCERNS WITH YOUR PROFIT OR LOSS.
Happy Trading, Fxdollars.

EUR USD trade on swing mode. {22/10/2023}Educational Analysis says EURUSD may go long according to my technical.
This is not an entry signal. I have no concerns with your profit and loss from this analysis.
Why long?
Broker OANDA.
Because EU fair value gaps are unfilled in a 4-hour time frame.
So, trade is already on with RR is 1: 41
I HAVE NO CONCERNS WITH YOUR PROFIT OR LOSS.
Happy Trading, Fxdollars.

Buying the dips in EUR/USDHello traders, EUR/USD was strongly bullish yesterday.
However, currently, we are witnessing a pullback in EUR/USD.
Price is currently reaching towards the 1.06 key level. However,
if this area holds, and price doesn't go below the 1.0580-1.06
level, I would definitely consider a buying EUR/USD.
Buying the dips in EUR/USD seems like a wise strategy.
