EURUSD Setup | CPI Fades, Fed Focus & Gold Leads Dollar ReboundEURUSD is showing signs of exhaustion after soft US CPI failed to extend the rally beyond 1.1495. While markets initially priced in a dovish Fed response, recent commentary and gold’s rejection from its highs suggest the dollar may be gearing up for a short-term recovery. With Gold pulling back and yields stabilizing, EURUSD could now follow suit lower into key support levels—especially if the Fed maintains a patient tone at this week’s meeting.
🔹 EURUSD (4H) Analysis
📉 Bias: Bearish
💡 Context:
EURUSD stalled just below 1.1500 after the CPI miss and now sits at a high-liquidity reversal zone. With DXY stabilizing and gold already rolling over, EURUSD may lag behind but eventually follow the same path. If the Fed leans hawkish or even neutral (ignoring political pressure), it could catalyze a drop toward 1.1268 and below.
📊 Technical Levels:
Resistance Zone: 1.1495–1.1530
Target 1: 1.1268
Target 2: 1.1086
Invalidation: Daily close above 1.1530 (or strong bullish follow-through after FOMC)
🪙 Leading Asset Clue:
Gold has already rejected major resistance (3,390–3,403) and is now pulling lower. Historically, EURUSD tends to follow when metals stall—especially if driven by real yields and Fed dynamics.
⚠️ Fundamentals to Watch:
🏦 FOMC Rate Decision & Dot Plot (June 12)
📈 US PPI + Jobless Claims (June 13)
💬 Fed Chair Powell's Press Conference
📰 Any shift in ECB or Fed rate cut timelines
🧠 Risk Factors:
Fed surprise dovish shift due to CPI softness
Market overreacts to rate cut expectations
Geopolitical risk-off flows favoring EUR
✅ Summary: Bias and Watchpoints
EURUSD
Bearish
Fed holding firm vs. ECB easing bias
Fed turning dovish post-CPI (Top Risk)
FOMC Rate Decision, PPI, Powell
📌 Final Note:
Gold is leading the turn as dollar strength resurfaces. EURUSD may lag initially but the macro context favors downside from this key resistance zone. Watch the Fed for confirmation—positioning into 1.1268 and 1.1086 looks attractive if the dollar gains traction post-FOMC.
Eurusdoutlook

EUR/USD Rally Extends – Eyes on 1.20000 as Momentum BuildsHi Everyone,
As outlined in our analysis last week (idea linked below), EUR/USD continued to the upside and reached the 1.15240 level.
We expect price action to extend further toward the 1.16564 level, which would reinforce our long-term bullish outlook.
A confirmed break above this resistance would likely open the door for a move toward 1.18325, where we anticipate encountering dynamic resistance.
We will provide further updates on the projected path for EUR/USD should price reach this level.
The longer-term outlook remains bullish, with expectations for the rally to extend toward the 1.2000 level, provided the price holds above the key support at 1.10649.
We will continue to update you throughout the week with how we’re managing our active ideas and positions. Thanks again for all the likes/boosts, comments and follows — we appreciate the support!
All the best for a good end to the week. Trade safe.
BluetonaFX

EURUSD(20250612) Today's AnalysisMarket news:
① The EU hopes that the trade negotiations will be extended beyond the suspension period set by Trump. ② Bessant: As long as "sincerity" is shown in the negotiations, the Trump administration is willing to extend the current 90-day tariff suspension period beyond July 9. ③ Trump will hold multiple bilateral talks during the G7 summit. ④ The total customs revenue of the United States in May reached a record high of US$23 billion, an increase of nearly four times year-on-year. ⑤ Lutnick: One deal after another will be reached.
Technical analysis:
Today's buying and selling boundaries:
1.1463
Support and resistance levels:
1.1556
1.1521
1.1499
1.1427
1.1404
1.1369
Trading strategy:
If the price breaks through 1.1499, consider buying in, and the first target price is 1.1521
If the price breaks through 1.1463, consider selling in, and the first target price is 1.1427

EURUSD - TIME TO SHORT Team, last time we have successfully SHORT the EURUSD and now we are back on it again
This time we have better short position
NOTE: Last few days we have been killing the UK100/FTSE100 with such great opportunity.
Please follow the PRICE target accordingly to the CHART
Target 1 1.147200 to 1.4650
Target 2 at 1.1455-1.1450
Once it reach the 1st Target take 50% profit
Good luck and enjoy the profit

EURUSD SHORT FORECAST Q2 W24 D10 Y25EURUSD SHORT FORECAST Q2 W24 D10 Y25
Professional Risk Managers👋
Welcome back to another FRGNT chart update📈
Diving into some Forex setups using predominantly higher time frame order blocks alongside confirmation breaks of structure.
Let’s see what price action is telling us today!
💡Here are some trade confluences📝
✅Weekly order block
✅15' order block
✅4 hour order block
✅Tokyo ranges to be filled
🔑 Remember, to participate in trading comes always with a degree of risk, therefore as professional risk managers it remains vital that we stick to our risk management plan as well as our trading strategies.
📈The rest, we leave to the balance of probabilities.
💡Fail to plan. Plan to fail.
🏆It has always been that simple.
❤️Good luck with your trading journey, I shall see you at the very top.
🎯Trade consistent, FRGNT X

Will the U.S. Dollar Bear go out to lunch and take a break?In this video I go over the case for the U.S. Dollar bear taking a break and price action getting a pullback across the EUR/USD, GBP/USD and USD/JPY.
I took a 42% profit on EUR/USD longs and currently keeping an eye on a short opportunity if weakness starts to creep in on the price action.
Long term, I remain U.S. Dollar bearish across the board however pullbacks are always expected during a macro price move.
If we trade higher, so be it and I will evaluate what the next position will be.
As always, Good Luck & Trade Safe.

Week of 6/8/25: EU AnalysisPrice has reached the extreme of daily bearish structure and we can see a rejection of the 4h latest push to make another high. We're following 1h internal bearish structure to at least take out the weak low, thus making 1h structure bearish and following that to the 4h extreme swing low.
Major news:
Core CPI - Wednesday

EURUSD Analysis todayHello traders, this is a complete multiple timeframe analysis of this pair. We see could find significant trading opportunities as per analysis upon price action confirmation we may take this trade. Smash the like button if you find value in this analysis and drop a comment if you have any questions or let me know which pair to cover in my next analysis.

EURUSD LIVE TRADEHello friends
Since the price has reached the specified important resistance, a correction in the price is expected. Therefore, you can enter the position with capital and risk management and move with it to the specified goals.
*Trade safely with us*

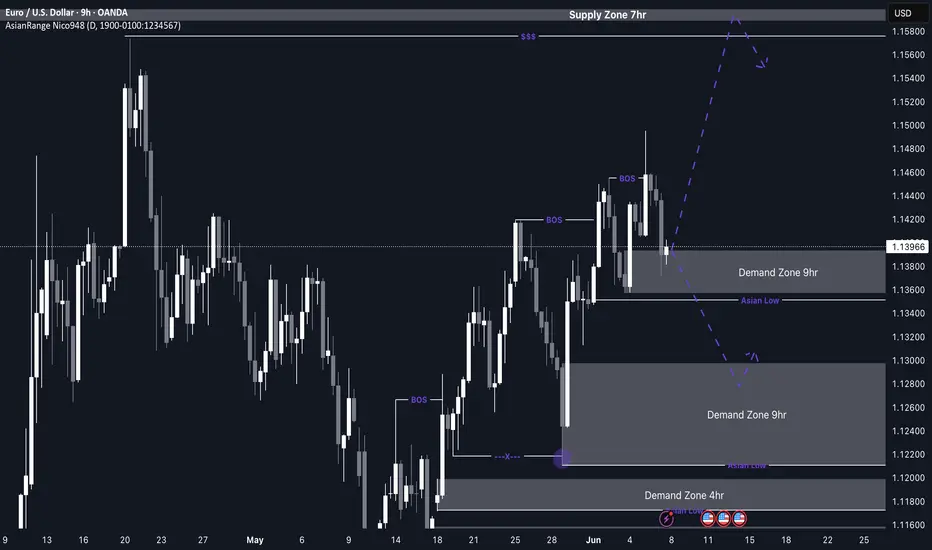
EUR/USD Potential buys from current zone or 1.12800My outlook for EU this week closely aligns with GU — both pairs are showing similar structure and direction. Price continues to form higher highs and higher lows, maintaining its bullish momentum.
Following the most recent break of structure to the upside, EU has now entered a 9H demand zone, where I’ll be watching for signs of accumulation and potential entry as the market opens on Monday.
If this current zone fails to hold, there’s a more discounted 9H demand zone just below, which could offer a cleaner long opportunity. Either way, both scenarios follow the pro trend, which adds conviction to the buy idea.
Confluences for EU Buys:
Price has broken structure to the upside and entered a clean 9H demand zone
There’s another refined 9H demand zone just below for additional confirmation
Plenty of upside liquidity remains untouched
Structure remains bullish on the higher timeframes, making this a pro trend setup
P.S. If price reacts well and continues pushing higher, I’ll be keeping an eye on the 7H supply zone above for any possible short-term bearish reaction.
Wishing everyone a successful and disciplined trading week ahead!
EURUSD Analysis – Short Bias Builds on Key Resistance RejectionEURUSD pair is currently testing a critical resistance zone around 1.1495–1.1500, with bearish rejection beginning to form on the 4H timeframe. The technical setup suggests a potential lower high forming within the context of a broader downtrend, supported by a confluence of horizontal resistance and bearish risk catalysts.
🔍 Technical Overview:
Resistance Zone: 1.1495–1.1575 (multi-timeframe key levels)
Support Levels to Watch: 1.1234 (range base) and 1.1086 (swing low)
Price Action: After a sustained rally, price is showing exhaustion near previous highs, and a rejection pattern is emerging, suggesting selling interest.
Risk Management: Stop placed above 1.1575 high, with downside targets near 1.1234 and extended toward 1.1086.
🧠 Fundamental Backdrop:
ECB Policy Outlook: Lagarde recently warned that a stronger euro and higher tariffs may hurt EU exports. This dovish tone could weigh on EUR sentiment in the medium term.
US Dollar Strengthening: The latest US labor market data (ADP, JOLTS) beat expectations, showing continued resilience in employment and wage growth. This supports the Fed's data-dependent approach, favoring a stronger USD.
Macro Tensions: Global trade concerns (Trump’s tariffs, weak China demand, Germany’s slowing job market) are adding pressure to EUR while supporting safe-haven USD flows.
ECB Consumer Expectations Survey (April): Highlights persistent inflation fears and deteriorating economic confidence.
⏳ Scenario Outlook:
✅ Bearish Bias Preferred below 1.1500 with confirmation of rejection.
🎯 Target Zone 1: 1.1234 – Strong structure & demand zone.
🎯 Target Zone 2 (Extended): 1.1086 – Major low from mid-May.
❌ Invalidation: A breakout and close above 1.1575 would neutralize the bearish outlook and open up higher targets toward 1.17.
Conclusion: The EURUSD pair presents a compelling short opportunity, with both technical resistance and macro pressure aligning for a retracement or reversal. Short setups are favored unless bulls reclaim and hold above the 1.1575 handle.

ECB Cuts Rates. EUR/USD Spikes to 1.5-Month HighECB Cuts Rates. EUR/USD Spikes to 1.5-Month High
Yesterday, as widely expected, the European Central Bank (ECB) cut interest rates for the eighth time since May 2024. According to ForexFactory, the main refinancing rate was lowered from 2.40% to 2.15% (having stood at 4.50% in May 2024).
According to Reuters:
→ ECB President Christine Lagarde stated that interest rates are now at a “good level”, despite the extremely high uncertainty caused by tariff threats from President Donald Trump.
→ Following the press conference, markets interpreted the message as a sign that the ECB is unlikely to cut rates again at its next meeting in July.
In response to the ECB's decision, the EUR/USD rate jumped to its highest level in a month and a half, but later retreated (as indicated by the arrow) back to previous levels.
Technical Analysis of the EUR/USD Chart
Four days ago, while analysing the EUR/USD chart, we:
→ drew an ascending channel;
→ suggested that bullish momentum could push the EUR/USD rate up to the psychological level of 1.1500 during the current week.
In fact, at yesterday’s peak, the rate came very close to 1.1500. However, a candlestick with a long upper shadow had formed on the EUR/USD chart, by the end of the day. Additionally, this morning, the 1.1450 level has acted as a resistance zone.
This suggests bearish activity, which could pull the rate down towards the lower boundary of the local channel (outlined in black), and possibly even attempt a breakout below it.
This article represents the opinion of the Companies operating under the FXOpen brand only. It is not to be construed as an offer, solicitation, or recommendation with respect to products and services provided by the Companies operating under the FXOpen brand, nor is it to be considered financial advice.

EURUSD(20250606) Today's AnalysisMarket news:
The European Central Bank cut three key interest rates by 25 basis points. Lagarde hinted that the rate cut cycle will end, and the market is no longer fully pricing in another 25 basis point rate cut this year.
Technical analysis:
Today's buying and selling boundaries:
1.1447
Support and resistance levels
1.1537
1.1503
1.1481
1.1412
1.1391
1.1357
Trading strategy:
If the price breaks through 1.1447, consider buying, and the first target price is 1.1481
If the price breaks through 1.1412, consider selling, and the first target price is 1.1391

EUR/USD Awaits ECB Decision Near 1.1400 Amid Rate Cut BetsCMCMARKETS:EURUSD FX:EURUSD EUR/USD is consolidating above the 1.1400 psychological level as markets brace for the European Central Bank’s monetary policy announcement. The ECB is widely expected to cut its Deposit Facility Rate by 25bps to 2.00%, marking its seventh consecutive rate cut since June 2024.
Technically, the pair continues to trade within a well-defined ascending channel, reflecting a broader bullish structure. Current price action is facing a minor resistance near 1.1421, which is the top of the short-term range and also a key trendline rejection zone. A clean breakout above this area could expose the monthly resistance near 1.1557.
However, if OANDA:EURUSD EUR/USD fails to breach this level initially, a pullback toward 1.1366 (channel base support) is possible before bulls regain control. The bullish setup remains valid as long as price holds above this support zone.
Traders should monitor the ECB press conference for signals on whether the central bank may pause further easing later this year.
Resistance : 1.1421 , 1.1557
Support : 1.1366 , 1.1250

Market Analysis: EUR/USD Trims GainsMarket Analysis: EUR/USD Trims Gains
EUR/USD started a downside correction from the 1.1450 resistance.
Important Takeaways for EUR/USD Analysis Today
- The Euro struggled to clear the 1.1450 resistance and declined against the US Dollar.
- There was a break below a key bullish trend line with support at 1.1395 on the hourly chart of EUR/USD at FXOpen.
EUR/USD Technical Analysis
On the hourly chart of EUR/USD at FXOpen, the pair gained pace for a move above the 1.1300 zone, as mentioned in the previous analysis. The Euro tested the 1.1450 resistance and recently corrected gains against the US Dollar.
The pair dipped below 1.1400. There was a break below a key bullish trend line with support at 1.1395. It even traded below the 23.6% Fib retracement level of the upward move from the 1.1209 swing low to the 1.1454 high.
The pair is showing some bearish signs, and upside potential might remain limited. Immediate resistance is near the 50-hour simple moving average at 1.1395.
The next major resistance is near the 1.1450 zone. An upside break above the 1.1450 level might send the pair toward the 1.1500 resistance. Any more gains might open the doors for a move toward the 1.1550 level.
On the downside, immediate support on the EUR/USD chart is seen near the 50% Fib retracement level of the upward move from the 1.1209 swing low to the 1.1454 high at 1.1330. The next major support is near the 1.1300 level. A downside break below the 1.1300 support could send the pair toward the 1.1210 level.
This article represents the opinion of the Companies operating under the FXOpen brand only. It is not to be construed as an offer, solicitation, or recommendation with respect to products and services provided by the Companies operating under the FXOpen brand, nor is it to be considered financial advice.

EURUSD Trade Setup: Heres My Trade Plan!📈 EUR/USD Trade Outlook: Bullish Trend in Focus 🇪🇺💵
I'm currently watching EUR/USD, and it’s holding a strong bullish trend — with clear higher highs and higher lows across the board 🔁. On the 4-hour timeframe, price has pulled back into equilibrium, and I’m eyeing a potential buy opportunity if the structure continues to hold 🛒.
📚 Looking at historical price action, this setup has played out reliably in the past. That said, it's important to acknowledge that deeper pullbacks can occur — often sweeping liquidity below previous lows before resuming the trend 💧.
⚠️ This is a real risk, so consider conservative position sizing and always manage your risk appropriately.
💬 Drop a comment below if you're watching this setup too — I’d love to hear your take!
❗️Disclaimer: This is not financial advice. The content shared is for educational and informational purposes only. Please do your own analysis and trade responsibly.

Euro Pulls Back – Eyes on ECB and Tariff TurmoilCMCMARKETS:EURUSD FX:EURUSD EUR/USD pulled back from a six-week high of 1.1454 to trade near 1.1379, down 0.52% on Tuesday, as strong U.S. labor market data and revived trade tensions lifted the dollar. April JOLTS job openings rose to 7.39M, beating expectations, signaling a resilient U.S. economy despite a 3.7% drop in factory orders.
In parallel, Trump’s announcement to double tariffs on steel and aluminum has reignited trade war concerns. Markets are also watching for a potential Trump–Xi call later this week.
Meanwhile, the Euro lost ground after May HICP inflation in the Eurozone fell to 1.9%, below the ECB’s 2% target. With core inflation slowing as well, markets have priced in a 25 bps rate cut at Thursday’s ECB meeting.
Technically, OANDA:EURUSD EUR/USD is still trading within a rising channel but rejected key minor resistance zone just below the descending trendline. A confirmed breakout above this area could open the path toward monthly resistance near 1.1559. On the downside, Support Zone 1 (around 1.1375) must hold to maintain the bullish bias; further weakness may expose Support Zone 2 (around 1.1338)
Resistance : 1.1445 , 1.1559
Support : 1.1375 , 1.1338

EUR USD Trade Setup 1 hour timeframe EUR USD Trade Setup 1 hour timeframe
EUR USD has formed a Bullish Break and Retest pattern on the 1 hour timeframe and the price is currently at the retest level.
Euro Dollar(EUR/USD), are institutional investors still bullish?The European Central Bank (ECB) unveils a new monetary policy decision this Thursday, June 5, and the consensus is for further cuts in all three ECB interest rates. The ECB's key rate (the main rate at which banks refinance with the ECB) currently stands at 2.40% and should be cut to 2.15% according to the analyst consensus, in other words, a return of the ECB's key rate to the neutral zone for the Eurozone economy (neither restrictive nor accommodative). However, institutional traders are still predominantly bullish on the euro-dollar rate, so let's take stock of the overall technical situation.
1) Institutional traders are still buying the euro-dollar rate (EUR/USD)
Every Friday, the CFTC's Commitment Of Traders (COT) report provides access to the positioning of institutional traders (asset management traders and hedge fund traders) on EUR/USD futures contracts. Net positioning represents the difference between buy and sell positions. If the net position curve is above zero and following an upward trend, then institutional investors are buying. This is precisely the case for the EUR/USD institutional net position, with over 60% of institutional investors buying. As for the absolute net position, it is well above zero and has been trending upwards for the past three months.
The chart below shows the weekly Japanese candlesticks for the EUR/USD rate, as well as the net position of institutional traders on the EUR/USD rate in the form of the percentage of buy positions.
The second chart below is a histogram revealing the institutional net position in absolute terms (yellow line), which is following an upward trend and broke through descending resistance several weeks ago.
2) In terms of technical analysis, the EUR/USD rate is backed by support at $1.10/$1.12, but remains covered by major resistance at $1.15.
The monthly chart gives an opinion on the medium/long-term trend. A study of the monthly chart of the euro-dollar exchange rate highlights a bullish signal that has been given over the last two months. This is the bullish technical breakout of a downtrend line that joins all the most prominent peaks since the 2008 financial crisis. If this graphic signal is not invalidated by a bearish reintegration, then the trend will remain bullish for the euro-dollar rate in the medium term, with corrections still possible in the short term.
This market view would therefore be invalidated in the event of a break of support at $1.10/$1.12 on the basis of a minimum weekly close.
Long-term chart showing monthly Japanese candlesticks for the euro-dollar rate, highlighting the bullish technical breakout of resistance in place since the 2008 financial crisis.
DISCLAIMER:
This content is intended for individuals who are familiar with financial markets and instruments and is for information purposes only. The presented idea (including market commentary, market data and observations) is not a work product of any research department of Swissquote or its affiliates. This material is intended to highlight market action and does not constitute investment, legal or tax advice. If you are a retail investor or lack experience in trading complex financial products, it is advisable to seek professional advice from licensed advisor before making any financial decisions.
This content is not intended to manipulate the market or encourage any specific financial behavior.
Swissquote makes no representation or warranty as to the quality, completeness, accuracy, comprehensiveness or non-infringement of such content. The views expressed are those of the consultant and are provided for educational purposes only. Any information provided relating to a product or market should not be construed as recommending an investment strategy or transaction. Past performance is not a guarantee of future results.
Swissquote and its employees and representatives shall in no event be held liable for any damages or losses arising directly or indirectly from decisions made on the basis of this content.
The use of any third-party brands or trademarks is for information only and does not imply endorsement by Swissquote, or that the trademark owner has authorised Swissquote to promote its products or services.
Swissquote is the marketing brand for the activities of Swissquote Bank Ltd (Switzerland) regulated by FINMA, Swissquote Capital Markets Limited regulated by CySEC (Cyprus), Swissquote Bank Europe SA (Luxembourg) regulated by the CSSF, Swissquote Ltd (UK) regulated by the FCA, Swissquote Financial Services (Malta) Ltd regulated by the Malta Financial Services Authority, Swissquote MEA Ltd. (UAE) regulated by the Dubai Financial Services Authority, Swissquote Pte Ltd (Singapore) regulated by the Monetary Authority of Singapore, Swissquote Asia Limited (Hong Kong) licensed by the Hong Kong Securities and Futures Commission (SFC) and Swissquote South Africa (Pty) Ltd supervised by the FSCA.
Products and services of Swissquote are only intended for those permitted to receive them under local law.
All investments carry a degree of risk. The risk of loss in trading or holding financial instruments can be substantial. The value of financial instruments, including but not limited to stocks, bonds, cryptocurrencies, and other assets, can fluctuate both upwards and downwards. There is a significant risk of financial loss when buying, selling, holding, staking, or investing in these instruments. SQBE makes no recommendations regarding any specific investment, transaction, or the use of any particular investment strategy.
CFDs are complex instruments and come with a high risk of losing money rapidly due to leverage. The vast majority of retail client accounts suffer capital losses when trading in CFDs. You should consider whether you understand how CFDs work and whether you can afford to take the high risk of losing your money.
Digital Assets are unregulated in most countries and consumer protection rules may not apply. As highly volatile speculative investments, Digital Assets are not suitable for investors without a high-risk tolerance. Make sure you understand each Digital Asset before you trade.
Cryptocurrencies are not considered legal tender in some jurisdictions and are subject to regulatory uncertainties.
The use of Internet-based systems can involve high risks, including, but not limited to, fraud, cyber-attacks, network and communication failures, as well as identity theft and phishing attacks related to crypto-assets.

EUR/USD Rises to 4-Week HighEUR/USD Rises to 4-Week High
As shown on the EUR/USD chart today, the euro rose to a 4-week high against the US dollar this morning.
The euro's strength relative to the US dollar is supported by traders’ expectations ahead of the ECB's interest rate decision, scheduled for Thursday at 15:15 GMT+3.
This upcoming event is notable not only because the ECB is expected to cut rates from 2.40% to 2.15% (for the seventh consecutive time), but also due to the broader context shaped by ECB President Christine Lagarde’s recent remarks on the euro’s status as a reserve currency.
At the same time, the US dollar is weakening amid growing trade concerns—on Friday, the US President Donald Trump announced plans to double tariffs on steel and aluminum to 50%. He also accused China of breaching the recent trade truce.
Technical Analysis of the EUR/USD Chart
Seven days ago, when analysing the EUR/USD chart, we:
→ observed bullish sentiment;
→ highlighted the importance of the 1.1400 resistance level;
→ suggested that bears might attempt to strike back.
Since then, the price has pulled back from the mentioned level (as indicated by the arrow), but found support at the lower boundary of the ascending channel. The current bullish momentum could push EUR/USD towards the psychological level of 1.1500 during the week ahead.
This article represents the opinion of the Companies operating under the FXOpen brand only. It is not to be construed as an offer, solicitation, or recommendation with respect to products and services provided by the Companies operating under the FXOpen brand, nor is it to be considered financial advice.

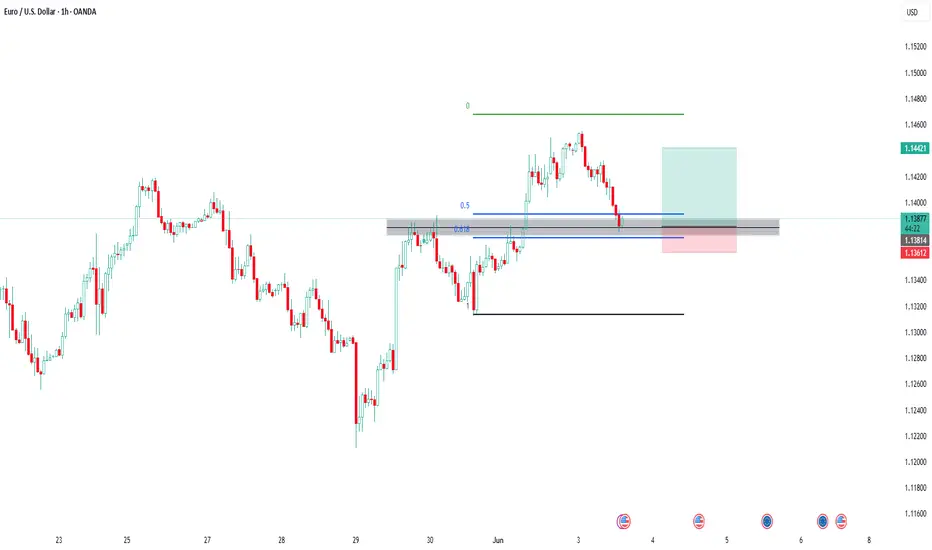
EURUSD Long Setup Brewing – Here's My Trade Plan!Keeping an eye 👀 on EURUSD – price has just broken market structure 📈 to the upside, and we're seeing clear higher highs 🔼 and higher lows 🔽 forming on the 4H timeframe 🕓.
Price has now rallied into a premium zone 💰, and i'm watching for a retracement 🔁 into my Fibonacci 61.8% 📐✨ point of interest for a potential long entry 🟢.
✅ Entry criteria?
Wait for price to pull back ⬅️ and then give us a break of market structure again 💥.
I'll be looking for confirmations on the 30min or 15min ⏱️ timeframes.
🚫 Not financial advice ✌️

EUR/USD Update: Bullish Outlook Towards 1.14190 and BeyondHi Everyone,
As we projected in our analysis last week, EUR/USD corrected throughout the week and approached a retest of the 1.12000 level.
We expect the price to potentially retest 1.12000 and confirm it as support before advancing further to challenge the May 26 high of 1.14190. This would further reinforce our outlook for a potential long-term bullish trend.
Of course, the price could also challenge the 1.14190 high without a second retracement, should there be strong buying pressure early in the week. A successful breach of this level would likely drive the price higher towards the 1.15240 level.
We will provide further updates on the expected path for EUR/USD should the price reach this target.
The longer-term outlook remains bullish, with expectations for the rally to extend toward the 1.2000 level, provided the price holds above the key support at 1.10649.
We will continue to update you throughout the week with how we’re managing our active ideas and positions. Thanks again for all the likes/boosts, comments and follows — we appreciate the support!
All the best for the week ahead. Trade safe.
BluetonaFX

Week of 6/1/25: EU AnalysisEU 1h and 4h structure are bearish, but there was a large rejection of the daily CHoCH last week leading to large bullish price movement. Our 1h internal structure is bullish, so we will follow that trend for now.
Major news:
PMI - Monday
PMI/ADP NFP - Wed
Unemployment Claims - Thurs
NFP/Unemployment rate - Friday
