EURUSD(20250430) Today's AnalysisMarket news:
The European Central Bank expects prices to rise 2.9% over the next 12 months, up from 2.6% in February, according to a monthly survey released on Tuesday. This is the highest level since April 2024. The three-year indicator rose slightly to 2.5%. The ECB's first five-year forecast was 2.1%.
Technical analysis:
Today's buying and selling boundaries:
1.1391
Support and resistance levels:
1.1443
1.1424
1.1411
1.1372
1.1359
1.1340
Trading strategy:
If the price breaks through 1.1391, consider buying, the first target price is 1.1411
If the price breaks through 1.1372, consider selling, the first target price is 1.1359
Eurusdprediction

EURUSD SHORT FORECAST Q2 W18 D30 Y25EURUSD SHORT FORECAST Q2 W18 D30 Y25
Professional Risk Managers👋
Welcome back to another FRGNT chart update📈
Diving into some Forex setups using predominantly higher time frame order blocks alongside confirmation breaks of structure.
Let’s see what price action is telling us today!
💡Here are some trade confluences📝
✅Weekly order block rejection
✅Daily order block rejection
✅Intraday 15' order blocks
✅Tokyo ranges to be filled
🔑 Remember, to participate in trading comes always with a degree of risk, therefore as professional risk managers it remains vital that we stick to our risk management plan as well as our trading strategies.
📈The rest, we leave to the balance of probabilities.
💡Fail to plan. Plan to fail.
🏆It has always been that simple.
❤️Good luck with your trading journey, I shall see you at the very top.
🎯Trade consistent, FRGNT X

EURUSD SHORT FORECAST Q2 W18 D29 Y25
EURUSD SHORT FORECAST Q2 W18 D29 Y25
Professional Risk Managers👋
Welcome back to another FRGNT chart update📈
Diving into some Forex setups using predominantly higher time frame order blocks alongside confirmation breaks of structure.
Let’s see what price action is telling us today!
💡Here are some trade confluences📝
✅Weekly order block rejection
✅Daily order block rejection
✅Intraday 15' order block
✅Tokyo ranges to be filled
🔑 Remember, to participate in trading comes always with a degree of risk, therefore as professional risk managers it remains vital that we stick to our risk management plan as well as our trading strategies.
📈The rest, we leave to the balance of probabilities.
💡Fail to plan. Plan to fail.
🏆It has always been that simple.
❤️Good luck with your trading journey, I shall see you at the very top.
🎯Trade consistent, FRGNT X
EUR/USD – Symmetrical Triangle Breakdown SetupHello guys!
Let's dive into the chart of eurusd!
If the bottom line of the triangle is broken with strong bearish momentum, it would confirm the breakdown. After the breakdown, the best approach is to wait for a pullback toward the broken support (now acting as resistance) and enter a short position on bearish rejection signals.
The target zone for the drop lies around 1.1200–1.1230, as highlighted in the blue support area on the chart.
____________________
Plan:
Breakdown Confirmation: Wait for a clear break below the bottom line.
Entry: Short on pullbacks toward the triangle's bottom after the breakdown.
Target: 1.1200–1.1230 support zone.
Invalidation: Breaking back above the top line of the triangle would invalidate the setup.

SMC Precision Short on EURUSD | SMT + Liquidity Grab = Clean Set📉 EURUSD 15M | Smart Money Concept (SMC) Trade Idea
🔍 Market Structure & Bias:
- High Timeframe POI (1H): Price tapped into a 1H Supply Zone, indicating potential short setups aligning with HTF bias.
- Break of Structure (BOS):Clean BOS to the downside confirms market intent shifting bearish.
🧠 Smart Money Logic :
- Liquidity Grab: Price swept liquidity above the equal highs and immediately rejected the 1H supply zone.
- Refinement: On the 15M, an entry block (OB) formed right after the SMT
- Mitigation: Price mitigated a lower timeframe demand and then gave an impulsive move down confirming intent.
- Entry: Entered short at the mitigation of the refined 15M supply zone.
- Stop Loss: Above the recent high (liquidity sweep).
- Target:
TP1:At the internal liquidity low (marked green @ 1.13152).
TP2:Final target at external liquidity below swing low @ 1.12637
Trade Details :
- 📍 Entry: 1.1372
- 🛑 Stop Loss: 1.1391
- 🎯 Take Profits:
TP1: 1.13152
TP2: 1.12637
Thanks for your time..

EURUSD(20250428) Today's AnalysisMarket news:
The Fed's subsequent policy path considers two scenarios: First, there is no substantial progress in the negotiations between the United States and its trading partners. After 90 days, the US tariffs are still high. Weakened economic demand may prompt the Fed to cut interest rates starting in July, and the annual rate cut may reach 100 basis points; second, the negotiations are fruitful, tariffs are reduced, and the demand shock is small, but inflationary pressure continues. The Fed may postpone easing and only cut interest rates slightly in December. For the market, although the easing comes early in the first scenario, the "recession-style" rate cut may suppress risky assets.
Technical analysis:
Today's buying and selling boundaries:
1.1357
Support and resistance levels:
1.1434
1.1405
1.1386
1.1327
1.1308
1.1280
Trading strategy:
If the price breaks through 1.1357, consider buying, the first target price is 1.1386
If the price breaks through 1.1327, consider selling, the first target price is 1.1308

EURUS possible bearish reversal correction for 1.1100 & 1.1000#eurusd weekly key reversal bar, made a new high closed towards the low which is early indication for bearish reversal. better to wait for 61.8, 70.0 and 79.0 fib level for correction to short to manage drawdown. stop loss above key reversal bar high. initial target might be 1.1100 and next one 1.1000 if breaks below the 1.1100. use low risk in reversal trade.

EurUsd- Pay attention to 1.1310Recap:
As discussed in last week's update, EURUSD bulls started losing momentum, and a correction became likely.
Current situation:
• The move from 1.1400 to 1.1577 appears to have been a blow-off top.
• Price is now stuck in the middle of the range, showing signs of weakness.
Key level to watch:
• 1.1310 is critical support.
• A confirmed break below could open the path toward the 1.1100 area.
Trading plan:
➡️ I am closely monitoring the 1.1310 zone for a potential breakdown and continuation lower.
Disclosure: I am part of Trade Nation's Influencer program and receive a monthly fee for using their TradingView charts in my analyses and educational articles.

EURUSD SHORT FORECAST Q2 W18 D28 Y25EURUSD SHORT FORECAST Q2 W18 D28 Y25
Professional Risk Managers👋
Welcome back to another FRGNT chart update📈
Diving into some Forex setups using predominantly higher time frame order blocks alongside confirmation breaks of structure.
Let’s see what price action is telling us today!
💡Here are some trade confluences📝
✅Weekly order block rejection
✅Daily order block rejection
✅Intraday 15' order block
✅Tokyo ranges to be filled
🔑 Remember, to participate in trading comes always with a degree of risk, therefore as professional risk managers it remains vital that we stick to our risk management plan as well as our trading strategies.
📈The rest, we leave to the balance of probabilities.
💡Fail to plan. Plan to fail.
🏆It has always been that simple.
❤️Good luck with your trading journey, I shall see you at the very top.
🎯Trade consistent, FRGNT X

EURUSD Analysis todayHello traders, this is a complete multiple timeframe analysis of this pair. We see could find significant trading opportunities as per analysis upon price action confirmation we may take this trade. Smash the like button if you find value in this analysis and drop a comment if you have any questions or let me know which pair to cover in my next analysis.

EURUSDEURUSD needs some more correction, once we see reaction from the highlighted levels and correction have completed then we will look for buys after.
Disclosure: We are part of Trade Nation's Influencer program and receive a monthly fee for using their TradingView charts in our analysis.

Targeting 1.185: Strategies for Navigating Euro Volatility!A few thoughts on the results of the analysis of Friday's stock exchange reports on the euro/dollar pair
We noticed a portfolio that has entered the market with a target of 1.185, and only have 12 days until expiration. With the current volatility at 10.23, the future price at expiration is expected to be in the range of 1.0993 to 1.1849 — a 95% probability. Interesting, right?
Now, let’s consider two possible scenarios.
The first option : if the price is rapidly moving towards 1.185, it might be wise to think about selling the asset. Why? Because this price will act as a strong resistance level. Two reasons:
First , the expected price range is based on a mathematical formula and statistical data. Second , using leverage embedded in options that are deep out of the money (i.e., far from the current price) presents an excellent opportunity to create a synthetic short position without any risk, even if the market continues to move upward! Sounds unreal? Start learning about options, and a new world of opportunities will open up for you. Your perspective on risk and opportunities will change dramatically!
OK, now let's get back to the point of the post. The second option : if the price consolidates above 1.1436 on the futures, this could signal a buying opportunity.
Taking into account other factors (you can dig deeper using our website's data), the current sentiment is quite bullish and the continuation of the uptrend seems more likely than a correction.
Which path will you choose? Share your thoughts in the comments!
That’s where our market research comes in. Think of it as your “bias detector.” We’ve developed and use it daily to get a second opinion on trades. It’s like having a pro trader whisper, “Hey, this isn’t looking good— think twice.”.
P.S. No pressure, just a chance to trade smarter! No Valuable Data, No Edge!

#EURUSD: Our Last Trade Mitigated Early, Now Swing Trade Active?EURUSD, in our previous recommendation, advised everyone to sell swing trades. However, the price was mitigated by a narrow margin. The DXY index suggests further price growth in the coming weeks. Please ensure you manage your risk while trading. This is our concept only and does not guarantee the movements we’ve shown in our analysis. Therefore, please conduct your own analysis before taking any swing entry.
Good luck and trade safely.
Wishing you good luck and safe trading!
Thank you for your support! 😊
If you’d like to contribute, here are a few ways you can help us:
- Like our ideas
- Comment on our ideas
- Share our ideas
Team Setupsfx_
❤️🚀

EURUSD(20250425) Today's AnalysisMarket news:
Federal Reserve-①Hamack: If economic data is clear, the Fed may cut interest rates in June
②Waller: It will take until July to get a clearer understanding of how tariffs affect the economy. If tariffs lead to higher unemployment, interest rate cuts may be initiated. ③The Atlanta Fed GDPNow model predicts that the US GDP growth rate in the first quarter will be -2.5%. ④Kashkari: The frequent announcements from Washington have brought challenges to policymakers and everyone.
Technical analysis:
Today's buying and selling boundaries:
1.1366
Support and resistance levels:
1.1448
1.1417
1.1397
1.1335
1.1315
1.1284
Trading strategy:
If the price breaks through 1.1397, consider buying, the first target price is 1.1417
If the price breaks through 1.1366, consider selling, the first target price is 1.1335

EUR/USD: Is the Uptrend Losing Steam?EUR/USD has had an exceptionally strong month, gaining over 7% from bottom to top – one of the best performances in EUR’s history against the dollar.
But now, things are starting to shift.
🧭 Possible Long-Term Trend Change?
Beyond the impressive rally, the bigger story might be the potential shift in the long-term trend. However, after such a sharp move up, a correction is not only likely – it may already be underway.
🔍 Technical Outlook:
- Price pushed above the key 1.15 psychological level but failed to hold momentum.
- A bearish consolidation is forming.
- A classic Head and Shoulders pattern appears to be developing, with a neckline near 1.13.
- A break of that level could open the door for a deeper retracement, with a target around 1.11.
🛠️ Trading Plan:
I’m looking to sell rallies, ideally near 1.1450, to maintain a 1:3 risk-to-reward ratio.
Disclosure: I am part of Trade Nation's Influencer program and receive a monthly fee for using their TradingView charts in my analyses and educational articles.

EUR/USD Consolidates: What's Next? FenzoFx—EUR/USD declined from $1.1571, as anticipated, due to overbought signals from the Stochastic and RSI 14 indicators. The pair now trades below the 50-period simple moving average, near $1.1350.
The Stochastic Oscillator has dropped below 20, suggesting the U.S. dollar is overvalued short-term. As long as the price remains above the $1.1259 support, the bullish outlook holds. Potential upside targets include $1.147 and $1.1571.
Bearish Scenario: If the price falls below $1.1259, bearish momentum may drive EUR/USD toward the next support at $1.1146.
>>> No Deposit Bonus
>>> %100 Deposit Bonus
>>> Forex Analysis Contest
All at FenzoFx Decentralized Forex Broker

EURUSD(20250424) Today's AnalysisMarket News:
The United States hit a 16-month low in April. The total number of new home sales in the United States in March was an annualized to a new high since September 2024.
Technical analysis:
Today's buying and selling boundaries:
1.1354
Support and resistance levels:
1.1485
1.1436
1.1404
1.1303
1.1272
1.1223
Trading strategy:
If the price breaks through 1.1354, consider buying, the first target price is 1.1404
If the price breaks through 1.1303, consider selling, the first target price is 1.1272

EURUSD Short Term Buy Idea Update!!!Hi Traders, on April 15th I shared this idea "EURUSD Short Term Buy Idea"
Expected retraces and further continuation higher until the strong support zone holds. You can read the full post using the link above.
Price moved as per the plan!!!
Retraces happened as expected and then the price moved higher further.
If you enjoy this idea, don’t forget to LIKE 👍, FOLLOW ✅, SHARE 🙌, and COMMENT ✍! Drop your thoughts and charts below to keep the discussion going. Your support helps keep this content free and reach more people! 🚀
--------------------------------------------------------------------------------------------------------------------
Disclosure: I am part of Trade Nation's Influencer program and receive a monthly fee for using their TradingView charts in my analysis.

EURUSD SHORT FORECAST Q2 W17 D23 Y25EURUSD SHORT FORECAST Q2 W17 D23 Y25
Professional Risk Managers👋
Welcome back to another FRGNT chart update📈
Diving into some Forex setups using predominantly higher time frame order blocks alongside confirmation breaks of structure.
Let’s see what price action is telling us today!
Trade confluences
- Weekly order block rejection
- Daily bearish close
- Intraday breaks of structure
- 15’ order block created
- Tokyo ranges to be filled
🔑 Remember, to participate in trading comes always with a degree of risk, therefore as professional risk managers it remains vital that we stick to our risk management plan as well as our trading strategies.
📈The rest, we leave to the balance of probabilities.
💡Fail to plan. Plan to fail.
🏆It has always been that simple.
❤️Good luck with your trading journey, I shall see you at the very top.
🎯Trade consistent, FRGNT X

EURUSD - Expecting Short Term RetracesH4 - Strong bullish move ended with a bearish divergence.
While measuring this strong bullish move using the Fibonacci retracement tool we have two key support zones that has formed (marked in green).
So based on this I expect short term bearish moves now towards the Fibonacci support zones.
If you enjoy this idea, don’t forget to LIKE 👍, FOLLOW ✅, SHARE 🙌, and COMMENT ✍! Drop your thoughts and charts below to keep the discussion going. Your support helps keep this content free and reach more people! 🚀
--------------------------------------------------------------------------------------------------------------------
Disclosure: I am part of Trade Nation's Influencer program and receive a monthly fee for using their TradingView charts in my analysis.

EURUSD and GBPUSD Analysis todayHello traders, this is a complete multiple timeframe analysis of this pair. We see could find significant trading opportunities as per analysis upon price action confirmation we may take this trade. Smash the like button if you find value in this analysis and drop a comment if you have any questions or let me know which pair to cover in my next analysis.

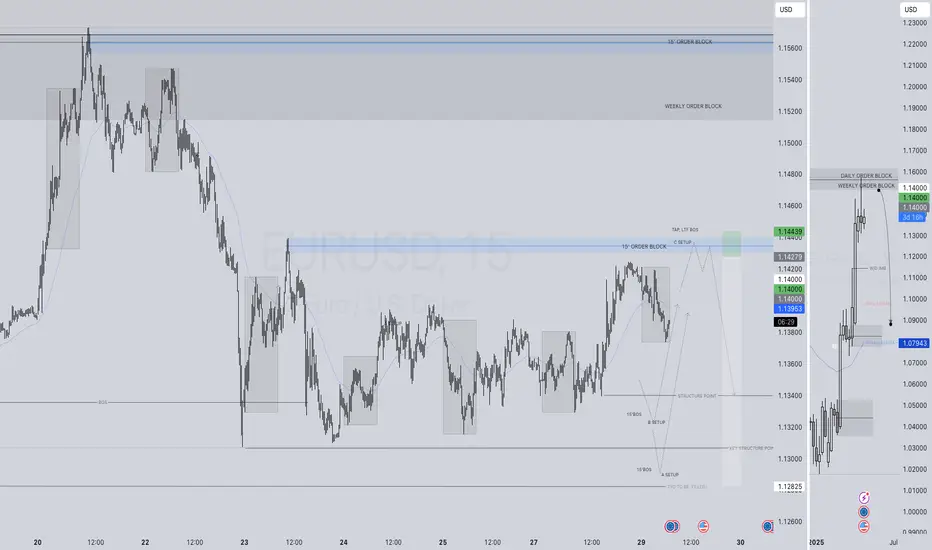
EURUSD SHORT FORECAST Q2 W17 D23 Y25 - CONTINUEDEURUSD SHORT FORECAST Q2 W17 D23 Y25
Summary
- Weekly Order Block
- Daily Order Block
- 15' Order Block
- Break of 15' structure
Requirements
- Setup A) Continued 15' breaks of structure. Price action pull back to point of interest.
- Setup B) Lower time frame break of structure via current 15' order block for immediate short.
- Setup C) Tap entry post break of structure
FRGNT X
🔑 Remember, to participate in trading comes always with a degree of risk, therefore as professional risk managers it remains vital that we stick to our risk management plan as well as our trading strategies.
📈The rest, we leave to the balance of probabilities.
💡Fail to plan. Plan to fail.
🏆It has always been that simple.
❤️Good luck with your trading journey, I shall see you at the very top.
🎯Trade consistent, FRGNT X

EURUSD SHORT FORECAST Q2 W17 D23 Y25EURUSD SHORT FORECAST Q2 W17 D23 Y25
Summary
- Weekly Order Block
- Daily Order Block
- 15' Order Block
- Break of 15' structure
Requirements
- Setup A) Continued 15' breaks of structure. Price action pull back to point of interest.
- Setup B) Lower time frame break of structure via current 15' order block for immediate short.
FRGNT X
IG - JCFRGNT
