FX Liquidity 'Worse Than Covid' Amid Tariff Shock. Long EUR/USD?Liquidity Seizes Up: Dealers Report Conditions 'Worse Than Covid' Amid Tariff Turmoil
The intricate plumbing of the global foreign exchange market, typically the world's deepest and most liquid financial arena, experienced a severe blockage in recent days, with dealers reporting liquidity conditions even more challenging than during the peak of the Covid-19 crisis in early 2020. Triggered by the sudden announcement of potential sweeping tariffs by former US President Donald Trump, the ability to execute large trades without significantly moving prices evaporated, creating treacherous conditions for market participants before a temporary pause on the tariff implementation offered a brief respite.
Reports indicate that available liquidity for a single transaction, or "clip," in major currency pairs plummeted to lows around $20 million. While this figure might still sound substantial, it represents a dramatic reduction from the norms in the multi-trillion dollar-a-day spot FX market, where clips of $50 million, $100 million, or even more could typically be absorbed with minimal market impact, especially in benchmark pairs like EUR/USD.
This liquidity drought occurred paradoxically alongside a spike in overall trading volumes. Both algorithmic trading systems and human traders on principal desks were highly active, reacting to the news flow and heightened volatility. However, this surge in activity masked a fundamental deterioration in market quality. High volume accompanied by low liquidity signifies frantic, often smaller, trades occurring across widening bid-ask spreads, with market makers unwilling or unable to provide firm quotes for substantial sizes. It's the market equivalent of a crowded room where everyone is shouting, but no one is willing to make a firm commitment.
Why 'Worse Than Covid'? Unpacking Dealer Sentiment
The comparison to the Covid-19 crisis is stark and revealing. The initial wave of the pandemic in March 2020 caused unprecedented volatility across all asset classes as the world grappled with lockdowns and economic shutdowns. FX liquidity certainly suffered then, with spreads widening dramatically. However, dealers suggest the current environment, driven by tariff uncertainty, felt different, and arguably worse, for several reasons:
1. Nature of the Shock: Covid-19, while devastating, was primarily a health crisis with economic consequences. Central banks globally responded with massive, coordinated liquidity injections and policy easing, providing a clear backstop (even if the initial shock was severe). The tariff announcement, however, represents a political and policy shock. Its potential impact is multifaceted – affecting inflation, growth, supply chains, corporate earnings, and international relations – and far harder to model. The policy path forward, including potential retaliation from other countries, is deeply uncertain.
2. Central Bank Reaction Function: During Covid, the playbook for central banks was relatively clear: provide liquidity and ease financial conditions. In response to potential tariffs, the central bank reaction is much less certain. Tariffs could be inflationary (raising import costs), potentially pushing central banks towards tighter policy, while simultaneously being negative for growth, which might argue for easing. This ambiguity makes it harder for markets to price in a predictable policy response, adding another layer of uncertainty that dampens risk appetite and liquidity provision.
3. Fundamental Uncertainty vs. Panic: While Covid induced panic, the underlying driver was identifiable. The tariff threat introduces deep uncertainty about the fundamental rules of global trade. This makes it exceptionally difficult for market makers, who provide liquidity, to price risk accurately. When risk becomes unquantifiable, the natural reaction is to withdraw, reduce quote sizes, and widen spreads significantly to avoid being caught on the wrong side of a large, unhedged position.
The Tariff Trigger: A Wrench in the Works
Donald Trump's proposal for a "reciprocal" or blanket tariff system, potentially starting at 10% on all imports with higher rates for specific countries, fundamentally challenges the existing global trade framework. The announcement immediately forced market participants to reassess:
• Inflation Outlook: Tariffs directly increase the cost of imported goods, potentially fueling inflation and impacting interest rate expectations.
• Economic Growth: Trade wars can disrupt supply chains, raise business costs, reduce export competitiveness (due to retaliation), and dampen consumer and business confidence, weighing on growth.
• Currency Valuations: Currencies of countries heavily reliant on exports to the US, or those potentially facing steep retaliatory tariffs, came under pressure. The US dollar itself experienced volatility as markets weighed the inflationary impact against the potential growth slowdown and risk-aversion flows.
This complex interplay of factors, combined with the political uncertainty surrounding the implementation and potential scope of such policies, created a perfect storm for volatility. Algorithmic systems, programmed based on historical correlations and data, struggled to navigate a potential regime shift driven by policy pronouncements. Human traders, facing heightened risk and uncertainty, became more cautious. Liquidity providers, facing the risk of being adversely selected (i.e., only trading when the market is about to move sharply against them), drastically reduced their exposure.
The Impact: Beyond the Trading Desks
The evaporation of liquidity has real-world consequences:
• Increased Transaction Costs: Corporates needing to hedge currency exposure for international trade face higher costs (wider spreads).
• Execution Risk: Asset managers rebalancing global portfolios find it harder and more expensive to execute large trades, potentially suffering significant slippage (the difference between the expected execution price and the actual price).
• Systemic Risk: In highly leveraged markets, poor liquidity can exacerbate sell-offs. Margin calls, as reportedly seen alongside the tariff news, can force leveraged players to liquidate positions rapidly into an illiquid market, potentially triggering a domino effect.
The temporary pause in the tariff implementation announced subsequently provided some relief, likely allowing liquidity to recover partially from the extreme lows. However, the underlying uncertainty hasn't disappeared. Until there is greater clarity on the future direction of US trade policy, the FX market is likely to remain susceptible to bouts of nervousness and reduced liquidity.
Should You Long EUR/USD Based on This? A Cautious No.
While the liquidity situation is dire and reflects significant market stress, using poor FX liquidity itself as a primary reason to take a directional view, such as longing EUR/USD, is generally flawed logic.
Here's why:
1. Liquidity is Not Direction: Market liquidity reflects the ease and cost of transacting, not necessarily the fundamental direction of an asset price. Poor liquidity is a symptom of high volatility, uncertainty, and risk aversion. While these factors can influence currency direction (e.g., risk aversion often benefits perceived safe-haven currencies), the liquidity state itself isn't the driver. Both buyers and sellers face the same poor liquidity.
2. Universal Impact: The reported liquidity crunch affected the global spot FX market. While specific pairs might have been hit harder at times, the underlying issue was broad-based risk aversion and dealer pullback, impacting EUR/USD, USD/JPY, GBP/USD, and others. It doesn't inherently favor the Euro over the Dollar.
3. Focus on Fundamentals and Sentiment: A decision to long EUR/USD should be based on a broader analysis of:
o Relative Monetary Policy: Expectations for the European Central Bank (ECB) versus the US Federal Reserve (Fed).
o Economic Outlook: Growth prospects in the Eurozone versus the United States.
o Risk Sentiment: Is the broader market mood risk-on (often favoring EUR) or risk-off (which can sometimes favor USD, though the tariff news complicated this)?
o Tariff Impact Analysis: How would the proposed tariffs, if implemented, differentially impact the Eurozone and US economies? Would potential EU retaliation harm the US more, or vice-versa?
4. Increased Trading Risk: Poor liquidity makes any trade riskier and more expensive. Spreads are wider, meaning entry and exit costs are higher. Slippage on stop-loss orders or take-profit orders is more likely. Executing large sizes is challenging. Therefore, even if you have a strong fundamental view to long EUR/USD, the current liquidity environment makes executing and managing that trade significantly more difficult and costly.
Conclusion
The recent seizure in FX liquidity, reportedly surpassing the severity seen during the Covid crisis onset, underscores the market's extreme sensitivity to geopolitical and policy uncertainty. The threat of sweeping tariffs injected a level of unpredictability that forced liquidity providers to retreat, even amidst high trading volumes. While the temporary pause offers breathing room, the fragility remains. For traders, this environment demands heightened caution, smaller position sizes, and wider stop-losses. Critically, basing directional trades like longing EUR/USD solely on the state of market liquidity is misguided. Such decisions must stem from a thorough analysis of economic fundamentals, policy outlooks, and risk sentiment, while acknowledging that poor liquidity significantly raises the cost and risk of executing any strategy.
Eurusdprediction

EURUSD: Watch for buys around 1.09625!Hey traders!
EURUSD has played out beautifully according to yesterday’s analysis, hitting our key levels with precision. The bullish momentum remains intact, and I'm still targeting the previous week's high at 1.11450.
Before the next leg up, I anticipate a pullback towards the Asian session low around 1.09625. This level could serve as a potential liquidity grab and demand zone, a perfect spot for buyers to step back in.
✅ Watch for bullish rejections or confirmation candles around 1.09625 to signal that buyers are defending the level. If confirmed, it could be the start of a solid move back to the upside.
📊 What’s your bias on EURUSD today? Bullish or bearish?
Let me know in the comments below! 👇
If you found this idea helpful, please consider supporting it with a boost, your support means a lot! 🙏🔥
Previous Idea
How it played out

EURUSD POSSIBLE TRADE SETUPPotential Trade Setup on EURUSD
EURUSD is on a strong 3-week rally correction that was almost got rejected on Friday due to the UK and US GDP data that came pretty strong and weak respectively.
That said, I am still quite anticipating for a possible correction to continue towards the 50% fib level at 1.0650, before we can start looking for a possible buy entry in the long term.
Trading Plan:
1. BUY if the resistance gets broken and retest successfully.
2. SELL if the current region acts as resistance for rejection towards the downside with an engulfing called on the 4H chart.
Targets:
1. Can be 1:2 for either entries.
Tips:
1. The RSI (1d) indicates an Overbought but easing gradually towards the 50 level.
Please like, follow, and comment!!
You may find more details in the chart!
Thank you and Trade Responsibly!
❤️PS: Please support with a like or comment if you find this analysis useful for your trading day❤️

EUR/USD Bearish OutlookEUR/USD technically looks bearish here as marked on the chart. I am planning a Short/Sell Position her,e you guys manage your risk according

EURUSD(20250410) Today's AnalysisMarket news:
Only 13 hours after it came into effect, Trump announced the suspension of the reciprocal tariff policy for most economies for 90 days for negotiations. Trump also said that he had been considering the suspension in the past few days. He now suspends the reciprocal measures because he feels that everyone has overreacted, and seems a bit panicked and a bit scared. He will consider exempting some American companies; the White House said that a 10% global tariff will still be imposed during the negotiations, and previously announced industry tariffs such as automobiles, steel and aluminum are not included in the suspension.
Technical analysis:
Today's buying and selling boundaries:
1.0985
Support and resistance levels:
1.1165
1.1098
1.1054
1.0916
1.0873
1.0806
Trading strategy:
If the price breaks through 1.0985, consider buying, the first target price is 1.1054
If the price breaks through 1.0916, consider selling, the first target price is 1.0873

EURUSD is Ready for a Bullish MoveHello Traders
In This Chart EURUSD HOURLY Forex Forecast By FOREX PLANET
today EURUSD analysis 👆
🟢This Chart includes_ (EURUSD market update)
🟢What is The Next Opportunity on EURUSD Market
🟢how to Enter to the Valid Entry With Assurance Profit
This CHART is For Trader's that Want to Improve Their Technical Analysis Skills and Their Trading By Understanding How To Analyze The Market Using Multiple Timeframes and Understanding The Bigger Picture on the Charts

EUR/USD Short Setup – Entry at Resistance, Targeting 1.08942"Entry Point: Around 1.10456
Stop Loss: Around 1.10833
Take Profit (EA Target Point): Around 1.08942
Risk-Reward Ratio: Appears favorable (approximately 1:2)
🔍 Key Observations:
Resistance Zone (Supply Area):
Price hit a strong resistance (marked with a purple zone) and showed signs of rejection with wicks.
The resistance aligns with the entry zone, suggesting a potential reversal area.
Moving Averages:
EMA 30 (Red) ≈ 1.09966 and EMA 200 (Blue) ≈ 1.09607
Price is currently above both EMAs, which is typically bullish, but the setup anticipates a pullback or correction.
Bearish Engulfing Pattern:
A possible bearish engulfing candlestick appears near the entry zone, indicating seller strength.
Break of Minor Support (RESISTANCE POINT):
If price breaks below this level, it would likely confirm the short setup toward the target.
✅ Confirmation Needed:
A clean break and close below the support (resistance point) to confirm entry.
Momentum indicators (RSI, MACD) could provide additional confidence if available.
⚠️ Risk Notes:
Since the price is still above both EMAs, this trade counters the short-term trend, so proper stop management is key.
Watch for news events, especially since this pair reacts strongly to economic data (note the calendar icon at the bottom right).

EURUSD SHORT UPDATED Q2 W15 D9 Y25EURUSD SHORT UPDATED Q2 W15 D9 Y25
Welcome Traders! Let's be dynamic. Here an image of my updated thoughts regarding EURUSD short position. Can price action snap the lows of Asia, creating bearish price actions, Leaving a point of interest for us to short from?
Lets see how it plays!
Until then !
FRGNT X
Markets in Flux: EUR/USD Chart Hints at BreakoutGood morning Traders,
Trust you are well.
Below is my analysis of the current price action on EURUSD amidst the trade war.
Overview
EUR/USD is trading within a descending channel, showing signs of a potential bullish breakout. Price recently rejected the 1.08115 support zone with a strong wick, suggesting buyer interest. Globally, trade tensions are escalating—President Trump reintroduced 34% tariffs on China, with China responding in kind. The EU is also planning a 25% tariff on U.S. goods, sparking further risk-off sentiment. US hinting at further extending tariff on China to 50%.
Idea
This analysis suggests a buy-the-dip opportunity near 1.08115, with a likely breakout toward 1.10127 and beyond. Safe havens like CHF and JPY are gaining, reflecting rising risk aversion. Despite the short-term USD strength, prolonged trade wars could eventually weigh on the dollar.
Conclusion
EUR/USD is gearing up for a move. I will watch for a dip to support before a bullish push around 1.08115 and 1.07689. With trade wars heating up and risk sentiment dipping, commodities and currencies are about to get spicy.
Do trade with caution.
Cheers and Happy trading!

EURUSD – Why This Key Level Could Decide the Next Big MoveAt the moment, EURUSD is maintaining a bearish market structure on both the 1-hour and 4-hour timeframes. Price action has been consistently forming lower highs and lower lows, which is a clear indication of sustained selling pressure in the market.
Zooming in, we’ve noticed that previous support zones are no longer being respected, which further supports the bearish narrative. These failed supports are now acting as weak resistance zones, and price is cutting through them with minimal hesitation — a sign that buyers are losing control while sellers continue to dominate the market.
One of the key technical levels on our radar is marked by a horizontal red line, currently acting as minor support. A candle close below this level would be highly significant. It would indicate that the temporary consolidation or hesitation we're seeing is breaking to the downside. If this scenario plays out, it could trigger a strong bearish continuation, with increased volume likely to enter the market from breakout traders and institutions scaling in.
The chart points to a clearly defined target area for this move, located in the 1.07500 to 1.07800 range, which is marked in green. This is a strong historical support zone — one that has previously held and sparked reversals. We anticipate that if price reaches this area, we may begin to see a slowdown in bearish momentum and a potential reversal setup.
1 hour trend
Trade Plan
Bearish Bias While Below the Red Line
If price closes below the red line (~1.09200), I’ll be watching for follow-through to the downside.
Entry opportunity may exist on the retest of this broken level, provided price shows rejection or continuation patterns.
Target area: 1.07500–1.07800 (green support zone)
Bullish Setup at Key Support
Should price reach the green zone, I’ll wait for confirmation before entering a long position.
Ideal signs: bullish candlestick patterns, slowing momentum, volume divergence, or strong reaction wicks.
Potential upside target: reversion back to broken structure or trendline zone.
Fundamental Analysis: U.S.-EU Tariff Situation
In addition to the technical structure, we also need to be mindful of the fundamental backdrop, particularly the recent escalation in tariff-related discussions between the U.S. and the European Union.
The Biden administration is reportedly exploring a fresh round of tariffs on EU imports in response to long-standing disagreements around digital services taxes and subsidies in the aviation industry. These talks have gained momentum recently, with the potential for announcements in the coming days or weeks.
Should these tariffs be confirmed, it would likely:
Weigh heavily on the Euro, especially if the EU responds with retaliatory measures.
Increase uncertainty in trade flows, damaging investor confidence in the region.
Trigger a flight to the U.S. dollar as a safe haven asset, further fueling EURUSD downside.
On the flip side, if negotiations lead to a positive resolution or postponement of tariffs, the Euro could see some relief, which may coincide with a bounce from the green support zone on the chart potentially lining up with our long bias at that level.
Conclusion
The EURUSD pair is currently offering a clean, high-probability setup driven by both technical and fundamental factors. With the market respecting bearish structure on the lower timeframes and support levels being broken with ease, the path of least resistance remains to the downside at least until the 1.07500–1.07800 zone is reached.
From there, a shift in momentum could present a great opportunity to switch bias and look for a long entry with favorable risk-reward.
This trade idea remains valid as long as price respects structure. Always manage risk and stay updated with any breaking news around U.S.–EU trade talks, as those developments could heavily influence the direction of EURUSD in the coming sessions.
__________________________________________
Thanks for your support!
If you found this idea helpful or learned something new, drop a like 👍 and leave a comment, I’d love to hear your thoughts! 🚀
Make sure to follow me for more price action insights, free indicators, and trading strategies. Let’s grow and trade smarter together! 📈

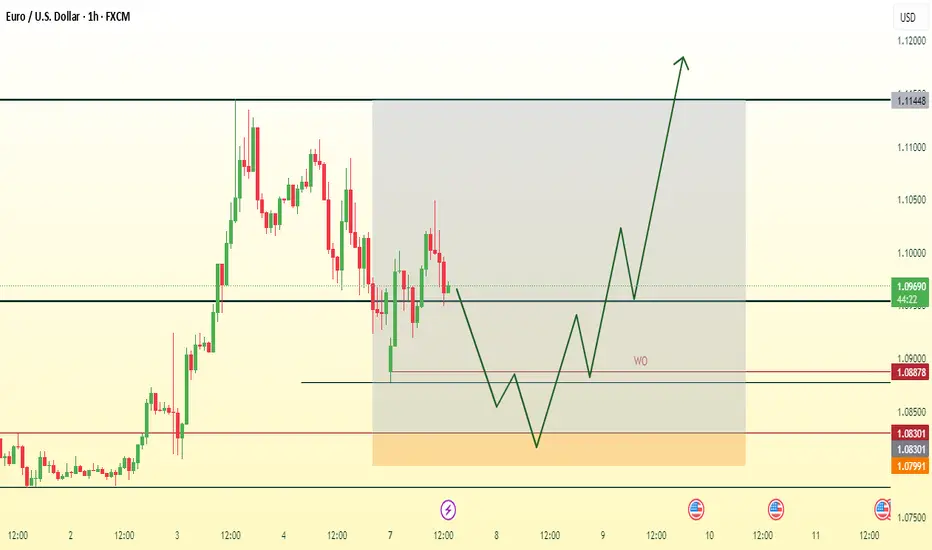
Bulls Take Control – Can EURUSD Reach 1.1150 Again?1. What happened (recap):
Last week, EURUSD reached the 1.1150 zone, a level that hasn't been touched since August-September last year. After that, the pair started a correction. Although the week started with a gap down yesterday, bulls took control and pushed the pair higher.
2. Key Question:
Has EURUSD completed its correction, or is another drop coming?
3. Why I expect further upside:
• 🔑 A retest of the formed support at 1.09 occurred during yesterday’s New York session, followed by a fresh rebound.
• 📊 The drop from 1.1150 appears corrective in nature, suggesting the possibility of a new leg up.
• 🎯 As long as 1.09 holds, my strategy is to buy dips with the primary target being a retest of the 1.1150 resistance zone.
4. Trading Plan:
📌 I’m looking for buying opportunities on dips, aiming to retest the 1.1150 resistance area. This scenario is invalidated only by a daily close below 1.09.
Disclosure: I am part of Trade Nation's Influencer program and receive a monthly fee for using their TradingView charts in my analyses and educational articles.

EURUSD Sell and Buy Trading Plan Update!!!Hi Traders, on March 19th I shared this "EURUSD Sell and Buy Trading Plan"
I expected short term bearish moves towards the Fibonacci support zones and then continuation higher. You can read the full post using the link above.
Price moved as per the plan here!!!
If you enjoy this idea, don’t forget to LIKE 👍, FOLLOW ✅, SHARE 🙌, and COMMENT ✍! Drop your thoughts and charts below to keep the discussion going. Your support helps keep this content free and reach more people! 🚀
-------------------------------------------------------------------------------------------------------------------
Disclosure: I am part of Trade Nation's Influencer program and receive a monthly fee for using their TradingView charts in my analysis.

EURUSD LONG/BUYBy utilizing Fibonacci retracement levels, historical patterns, , we can formulate a hypothesis that the market might follow a similar trajectory if bullish sentiment prevails.

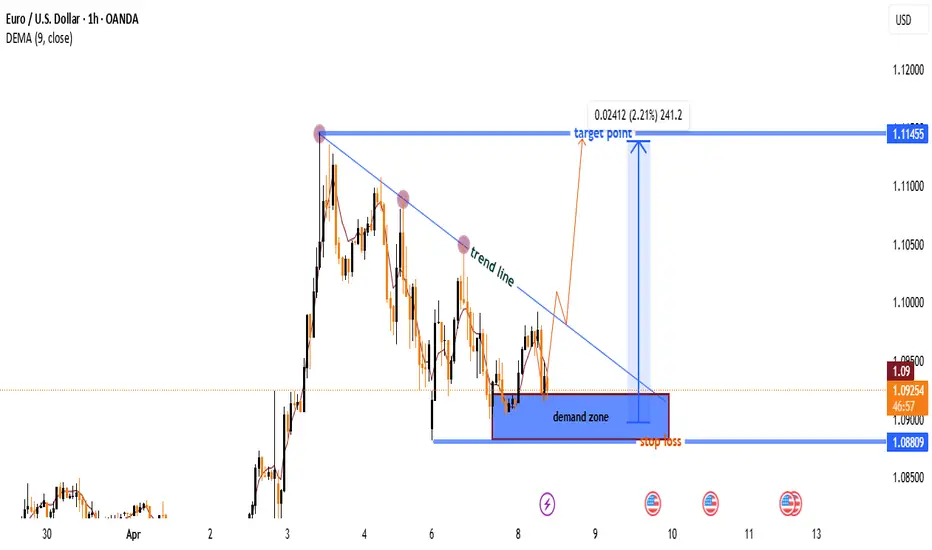
EUR/USD Bullish Reversal Setup from Demand Zone–1HChart AnalysisEUR/USD 1H Chart Analysis
🔵 Trend Line:
* Price was respecting a falling trend line
* Lower highs marked with 🔴 red dots showing bearish pressure
🟦 Demand Zone (Support Area):
* Price is currently hovering around a demand zone
* Marked by a blue box — this is where buyers are stepping in
* Think of this as a "bounce zone"
📍Marked with 🟦 blue dots as key bounce points
🚀 Potential Bullish Breakout: • If price breaks the trend line — get ready for lift-off
* Entry idea: ✅ Buy near the bottom of the blue zone
* Target: 🎯 1.11455
* Profit potential: +241 pips (2.21%)
* Move marked with 🟧 upward arrow path
❌ Stop Loss: • Just below the demand zone at 1.08809
* Marked with a ⚠️ stop sign to avoid large losses
📉 DEMA (9): • Yellow moving average line — shows recent momentum
* Right now, price is slightly below it, but a break above can support bullish case
Summary:
Buy Setup
✅ Entry: Around 1.09000 (🟦 demand zone)
🎯 Target: 1.11455
⚠️ Stop Loss: 1.08809
📈 Risk:Reward — Great!
EURUSD(20250408) Today's AnalysisToday's buying and selling boundaries:
1.0944
Support and resistance levels
1.1113
1.1050
1.1009
1.0879
1.0838
1.0775
Trading strategy:
If the price breaks through 1.0944, consider buying, the first target price is 1.1009
If the price breaks through 1.0879, consider selling, the first target price is 1.0838

#eurusd(April8)Levels where price reactions are most likely to occur during the day. Naturally, at each level, you can have buy and sell positions and you can freely use the levels for a new order or for TP of your postions. The levels are updated daily!
The results of price reaction to these levels will be shown in the upcoming videos.
You should note that the levels are based on price action knowledge, and no indicators are used to determine these levels. Therefore, the reaction ranges could occur a few pips above or below the levels marked on the charts!

Result: #eurusd (april7)The price has moved about 340 pips relative to the specified levels. The strategy a trader uses to enter the market and how much of this profit they’ve secured varies among traders. If you’ve got even half of this movement as profit, that’s excellent! :)

EUR/USD Bullish Reversal Setup – Buy from Demand Zone Near 200 EEMA 30 (Red): 1.09984
EMA 200 (Blue): 1.08869
🧠 Trade Idea: Long (Buy) Setup
📍 Entry Zone (Support/Buy Area):
Entry Point: Around 1.08868 – 1.08869
This zone aligns with the 200 EMA, acting as dynamic support.
There's also a clear demand zone (purple box), indicating historical buying interest.
⛔ Stop Loss:
Set at 1.08080
Placed below the demand zone to minimize risk if support fails.
🎯 Take Profit (Target):
Target Point: Around 1.11452
Coincides with a previous supply zone/resistance area (top purple box).
⚖️ Risk-to-Reward (R:R):
Risk: ~80 pips
Reward: ~250 pips
R:R Ratio: ~3.1:1 — A solid risk-to-reward setup.
🔍 Market Structure Observations:
Recent bullish momentum followed by a correction.
Price is approaching major support (near 200 EMA).
Likely scenario: Pullback into the demand zone, then bullish continuation toward the target.

EURUSD LONGI am looking to buy EURUSD at 1.08300.
I am overall Bullish on the fiber. I am waiting for a deeper retracement.
My target is the previous weekly high.
GBPUSD, EURUSD and AUDUSD Analysis todayHello traders, this is a complete multiple timeframe analysis of this pair. We see could find significant trading opportunities as per analysis upon price action confirmation we may take this trade. Smash the like button if you find value in this analysis and drop a comment if you have any questions or let me know which pair to cover in my next analysis.

EURUSD: Beginning of the week TrapBeginning of the week trap on EURUSD, seems like price is pulling back towards the previous high. However, I believe EU is still bearish and could get some bearish pushes.

EURUSD Bounced from 61.8% FibonacciFenzoFx—EURUSD bounced from %61.8 Fibonacci, stabilizing above $1.101. The bullish outlook is valid above $1.0955, targeting $1.109.

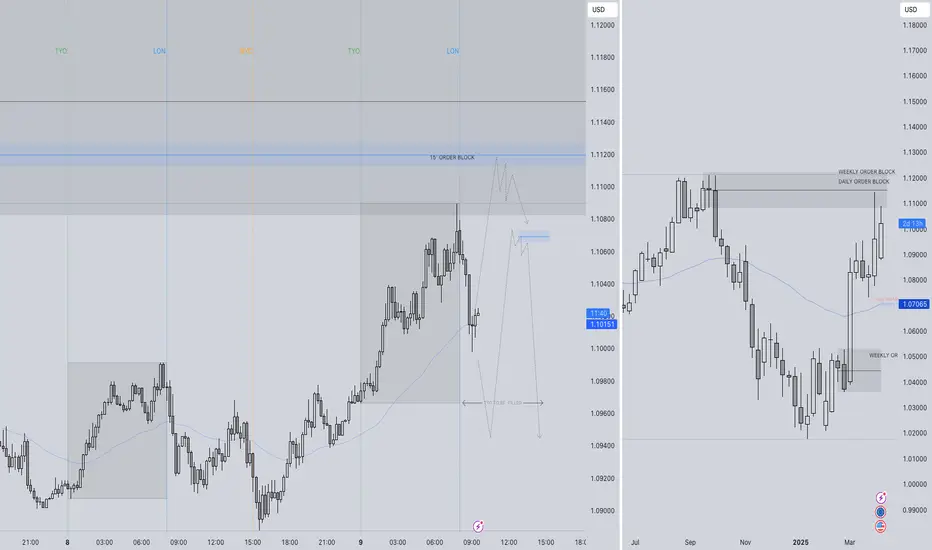
EURUSD SHORT POTENTIAL Q2 W15 Y25 MON 7TH APRIL 2025EURUSD SHORT POTENTIAL Q2 W15 Y25 MON 7TH APRIL 2025
An almost picture perfect setup. Let's take a look into why and what we forecast.
Take a look at the weekly chart. We have had a previous bearish close from the weekly order block. That's a tick in our book. The even better news is that weekly wick of rejection has also mitigated the daily order block up at the highs!
Another serious level of confluence that will in turn support out short forecast. Now what can we expect to happen next for price action. We shall not guess, we will wait to see how the market plays but I'll inform you of what FRGNT X would love to see.
-Price action fill the previous weekly closed wick area.
- In doing so, can we reach the 15' Order block that was left behind.
- Can we grab a lower time from break of structure from that point of interest.
- Once the above occurs. We short the market doing to clear points of interest.
The plan for EURUSD is very very simple this Monday morning. Let's see how it plays out.
FRGNT X
