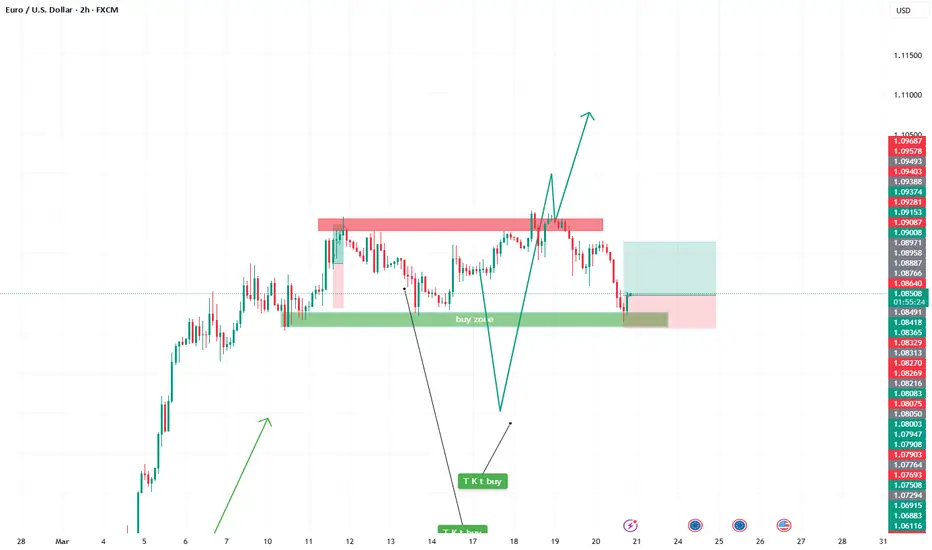
EURUSD THEORY : BIG SHORT (W.B.: 24/03/25)Price has confirmed the change - not a strong confirmation but one nonetheless. For that reason, wait for price to retrace back into one of the drawn up POIs in order to decide where to sell from - If I get further signals that a sell will occur.
It should sell all the way to the bottom..
Next week should be interesting
N.B.: This is not financial advice. Trade safely and with caution.
Eurusdprediction

EURUSD Analysis todayHello traders, this is a complete multiple timeframe analysis of this pair. We see could find significant trading opportunities as per analysis upon price action confirmation we may take this trade. Smash the like button if you find value in this analysis and drop a comment if you have any questions or let me know which pair to cover in my next analysis.

EUR USD Sell Continuation Setup EUR USD has formed a bearish break and retest pattern that also align with the 0.618 - 0.50 Fib Retracement level signaling a continuation of a downtrend.
EUR USD for sell ?

EURUSD Bulls Eyeing FOMC–Will Powell’s Dovish Tone Fuel a Rally?As we approach the much-anticipated FOMC rate decision and Powell’s press conference , market sentiment is shifting, and EURUSD ( FX:EURUSD ) traders are closely watching for clues on the Federal Reserve’s next move . With recent economic data pointing to signs of slowing growth and cooling inflation, the Fed might adopt a more dovish tone , fueling further upside for EURUSD .
Key Factors Driving the Bullish Outlook :
Inflation & Economic Data : CPI and PPI data indicate a gradual cooling of inflation, which strengthens the case for a potential rate cut later this year. If Powell acknowledges this shift, it could weigh on the dollar.
Market Pricing of Rate Cuts : Investors are already pricing in multiple Fed rate cuts for 2024. A dovish Powell could accelerate these expectations, weakening USD and pushing the EURUSD higher.
------------------------------------------------------------------
Now let's take a look at the EURUSD chart on the 2-hour time frame .
EURUSD is moving near the Resistance zone($1.0983-$1.0916) and Yearly Resistance(1) .
Regarding Elliott Wave theory , it seems that EURUSD has managed to complete the main wave 4 . The structure of the main wave 4 is the Double Three Correction(WXY) .
The main wave 5 is likely to complete near the upper line of the ascending channel(possible) and Monthly Resistance(4) .
I expect EURUSD to rise in the coming hours to the targets I have indicated on the chart, although the Federal Reserve Conference could create long shadows , but I think the supply and demand zones will still work but still pay more attention to money management today .
Note: If EURUSD can break below the Potential Reversal Zone(PRZ) , there is a possibility of further decline in EURUSD.
Please respect each other's ideas and express them politely if you agree or disagree.
Euro/U.S. Dollar Analyze (EURUSD), 2-hour time frame.
Be sure to follow the updated ideas.
Do not forget to put a Stop loss for your positions (For every position you want to open).
Please follow your strategy and updates; this is just my Idea, and I will gladly see your ideas in this post.
Please do not forget the ✅' like '✅ button 🙏😊 & Share it with your friends; thanks, and Trade safe.

EURUSD BUY/LONGBy utilizing Fibonacci retracement levels, historical patterns, , we can formulate a hypothesis that the market might follow a similar trajectory if bullish sentiment prevails.
EUR/USD Outlook – Potential Downtrend After Channel BreakdownOverview:
Pair: EUR/USD
Timeframe: 4-Hour (4H)
Broker: OANDA
Current Price: 1.08436
Trend: Potential Reversal
Technical Analysis:
The EUR/USD pair has been trading within a rising channel, indicating a bullish trend. However, recent price action shows a breakout to the downside, suggesting a potential bearish reversal.
The price failed to sustain above resistance and is now heading lower.
Breakdown confirmation suggests further downside movement.
Target: 1.06166, which aligns with a previous consolidation zone.
Trading Strategy:
📉 Bias: Bearish below the channel breakdown
🎯 Target: 1.06166 (Key Support)
🔍 Confirmation: Additional bearish momentum with lower highs and lower lows

EURUSD Short SetupThis is a trade of a multiple setup. Price actually reached a weekly resistance level, price forming a bearish pattern with break and retest of major trendline, main indicators showing bearish divergence. All the signlals lead to a possible drop, with 2 key level to reach

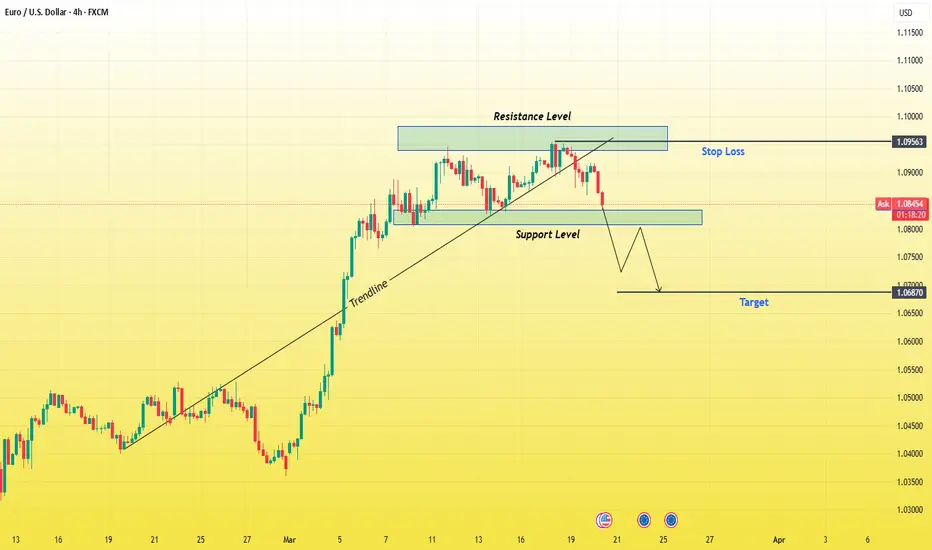
EUR/USD 4H Analysis – Bearish Breakdown Setup1. Market Structure & Trend
The EUR/USD chart shows a previous uptrend, confirmed by the ascending trendline, where the price made higher highs and higher lows. However, the trendline has now been broken, signaling a potential shift in market direction. The price is currently retracing from a key resistance zone, and a possible bearish continuation is expected.
2. Key Levels & Zones
✅ Resistance Zone (1.09563 - 1.1000):
This blue-shaded area represents a strong resistance level, where sellers have stepped in multiple times.
Price previously attempted to break this level but failed, forming a rejection.
This suggests buyers are losing strength, and sellers are likely to dominate.
✅ Support Level (1.0800 - 1.0780):
A critical support zone, which acted as a demand area in the past.
If price breaks below this level with strong bearish momentum, it confirms a trend reversal.
✅ Target Level (1.06870):
The next major downside target aligns with previous market structure and liquidity zones.
This area marks a key demand zone, where buyers might step in again.
3. Trade Setup & Execution Plan
🔹 Entry Strategy
A sell entry is ideal on a confirmed break and retest of the support zone at 1.0800.
If price retests this level and forms bearish rejection candles (such as pin bars or engulfing patterns), it strengthens the bearish bias.
🔹 Stop Loss & Risk Management
A stop loss should be placed above the resistance zone at 1.09563, ensuring a safe exit if the market reverses bullish.
Risk-to-Reward Ratio (RRR):
Entry: Below 1.0800 (after confirmation).
Stop Loss: Above 1.09563 (resistance zone).
Target: 1.06870 (support zone).
RRR: Around 1:3, meaning potential profit is three times the risk.
4. Confirmation Indicators & Confluences
✅ Bearish Trendline Break:
The ascending trendline has been broken, confirming a possible shift in trend.
✅ Support Flip:
If the price breaks support and retests it as resistance, it confirms bearish continuation.
✅ Price Action Candlestick Patterns:
Look for bearish engulfing candles, pin bars, or rejection wicks at key levels.
✅ Volume Analysis:
Increased selling pressure after support break indicates strong bearish momentum.
5. Final Thoughts & Bias
📉 Bias: Bearish (Unless resistance is reclaimed).
💡 Key Watch: Break and retest of 1.0800 support for confirmation.
⚠️ Risk Management: Always use a stop loss to manage risk effectively.
Conclusion
This setup presents a high-probability short trade with a clear entry, stop loss, and target. Traders should wait for confirmation signals before executing the trade. If price breaks above resistance, the bearish outlook is invalidated.
🔔 Stay cautious and trade with discipline! 🚀
EURUSD(20250320) Today's AnalysisToday's buying and selling boundaries: 1.0903
Support and resistance levels:
1.0988
1.0956
1.0935
1.0871
1.0850
1.0819
Trading strategy:
If the price breaks through 1.0935, consider going long, with the first target price at 1.0956
If the price breaks through 1.0903, consider going short, with the first target price at 1.0871


EURUSD Sell and Buy Trading PlanH4 - We had a strong bullish move with the price creating a series of higher highs, higher lows structure
This strong bullish move ended with a bearish Divergence
While measuring this strong bullish move using the Fibonacci retracement tool we have two key support zones that has formed (marked in green)
So based on this I expect potential short term bearish moves now towards the key support zones and then potential continuation higher.
If you enjoy this idea, don’t forget to LIKE 👍, FOLLOW ✅, SHARE 🙌, and COMMENT ✍! Drop your thoughts and charts below to keep the discussion going. Your support helps keep this content free and reach more people! 🚀
---------------------------------------------------------------------------------------------------------------------
Disclosure: I am part of Trade Nation's Influencer program and receive a monthly fee for using their TradingView charts in my analysis.-

EURUSD LONGPossible long opportunity on EURUSD . I would be a bit careful on this looking that there is some form of imbalance right below my invalidation level 1.07652. Drop a comment and tell me what you think

EURUSD Bullish EURUSD bullish setup on the H1 chart. The 1.0910 level is strong resistance, but the H4 uptrend is strong enough to break it. Waiting for buy signal on lower TimeFrames.

EUR USD Entry Setup 1 hour timeframe Beautiful EUR USD Double Top holds by forming a Bearish Engulfing candlestick pattern confirming the sell signal.
Trade Executed 👌🏻

EUR USD Trade Setup Daily Timeframe EUR USD has tapped on a Daily supply level that also acted as a strong resistance level in the past.
So we will be looking for selling opportunities from the lower timeframe.

EUR/USD – Bullish Breakout Setup 🔹 Overview:
EUR/USD remains in an ascending channel and is currently near the support zone. A bullish move is anticipated toward the 1.12150 - 1.12382 resistance zone, aligning with the overall trend.
🔹 Technical Analysis:
✅ Support Zone: Holding at 1.07916, acting as a key demand area.
✅ Ascending Channel: Price structure remains bullish, with higher highs and higher lows.
✅ Target: Resistance around 1.12382 aligns with a possible breakout.
🔹 Trade Idea:
📌 Long Entry: Around the support zone if bullish confirmation appears.
📌 Target: 1.12150 - 1.12382 resistance zone.
📌 Invalidation: Break below 1.07916 could shift momentum bearish.
📊 Sentiment: Bullish bias, waiting for confirmation.
📢 Will EUR/USD hit the target? Let’s discuss! 👇

EUR/USD Continued strength or FOMC Fallout?In this analysis I go over the EUR/USD and it's potential for further gains or a weakening bull and drop.
I expect a volatile week considering it's FOMC on Wednesday and ECB speaking on Friday.
Additionally, I share my outlook on ETF's I'm involved in. Currently in QQQE Put Option and closed my TQQQ Put for 30% gains last week.
As always, Good Luck and Trade Safe.

EURUSDWe are expecting EURUSD to show us some correction before FOMC if they are planning to push Euro up after FOMC.
Disclosure: We are part of Trade Nation's Influencer program and receive a monthly fee for using their TradingView charts in our analysis.

EURUSD analysis todayHello traders, this is a complete multiple timeframe analysis of this pair. We see could find significant trading opportunities as per analysis upon price action confirmation we may take this trade. Smash the like button if you find value in this analysis and drop a comment if you have any questions or let me know which pair to cover in my next analysis.

EURUSD Will be in bearish directionHello Traders
In This Chart EURUSD HOURLY Forex Forecast By FOREX PLANET
today EURUSD analysis 👆
🟢This Chart includes_ (EURUSD market update)
🟢What is The Next Opportunity on EURUSD Market
🟢how to Enter to the Valid Entry With Assurance Profit
This CHART is For Trader's that Want to Improve Their Technical Analysis Skills and Their Trading By Understanding How To Analyze The Market Using Multiple Timeframes and Understanding The Bigger Picture on the Charts

EUR/USD "The Fiber" Forex Market Bank Heist Plan🌟Hi! Hola! Ola! Bonjour! Hallo! Marhaba!🌟
Dear Money Makers & Robbers, 🤑💰🐱👤🐱🏍
Based on 🔥Thief Trading style technical and fundamental analysis🔥, here is our master plan to heist the EUR/USD "The Fiber" Forex market. Please adhere to the strategy I've outlined in the chart, which emphasizes long entry. Our aim is the high-risk Red Zone. Risky level, overbought market, consolidation, trend reversal, trap at the level where traders and bearish robbers are stronger. 🏆💸Book Profits Be wealthy and safe trade.💪🏆🎉
Entry 📈 : "The vault is wide open! Swipe the Bullish loot at any price - the heist is on!
however I advise to Place buy limit orders within a 15 or 30 minute timeframe most recent or swing, low or high level. I Highly recommended you to put alert in your chart.
Stop Loss 🛑:
Thief SL placed at the recent / nearest low level Using the 4H timeframe (1.04000) swing trade basis.
SL is based on your risk of the trade, lot size and how many multiple orders you have to take.
Target 🎯:
Primary Target - 1.06700 (or) Escape Before the Target
Secondary Target - 1.08000 (or) Escape Before the Target
🧲Scalpers, take note 👀 : only scalp on the Long side. If you have a lot of money, you can go straight away; if not, you can join swing traders and carry out the robbery plan. Use trailing SL to safeguard your money 💰.
📰🗞️Fundamental, Macro, COT Report, Quantitative Analysis, Intermarket Analysis, Sentimental Outlook:
EUR/USD "The Fiber" Forex Market market is currently experiencing a bullish trend,., driven by several key factors.
⭐🌟⭐Fundamental Analysis
Fundamental analysis evaluates the economic indicators of the Eurozone and the United States, which directly influence the EUR/USD pair.
🌟Eurozone Economic Indicators:
GDP growth is reported at 0.5% for Q4 2024, with recent data suggesting an expected increase to 0.8% for Q1 2025, indicating a potential recovery Euro Area Indicators.
Inflation rate is at 3.0% for February 2025, expected to decrease to 2.2% by year-end, reflecting easing price pressures Euro Area Inflation Rate.
Interest rates are at 2.5%, with the European Central Bank (ECB) likely to hold steady, given mixed inflation signals Euro Area Interest Rate.
Trade balance shows a surplus of €10 billion in January 2025, driven by exports, though not sufficient to offset economic challenges Euro Area Balance of Trade.
🌟United States Economic Indicators:
GDP growth is strong at 2.5% for Q4 2024, though recent projections suggest a slowdown to 2.0% for Q1 2025 United States Indicators.
Inflation is stable at 2.0% for February 2025, within target ranges, but recent data shows slight upward pressure United States Inflation Rate.
Interest rates are at 4.5%, with expectations of a 0.25% rate cut in September 2025, reflecting a dovish shift United States Interest Rate.
Trade balance shows a deficit of $50 billion in January 2025, a persistent challenge but manageable with strong economic growth United States Balance of Trade.
The narrowing interest rate differential, with potential Fed rate cuts and stable ECB policy, could support EUR strength, though US economic resilience remains a counterforce.
⭐🌟⭐Macroeconomics
Macroeconomics encompasses broader economic factors influencing the pair:
Global GDP growth is projected at 3.0% for 2025, according to recent forecasts, with mixed regional performances World Economic Outlook.
Commodity prices are stable, with oil at $80 per barrel, impacting EUR due to the Eurozone's energy import reliance Commodity Markets Outlook.
Stock markets show positive performance, with the S&P 500 up 5% YTD and Euro Stoxx 50 up 3% YTD, supporting risk-sensitive currencies like the EUR Global Stock Market Performance.
Bond yields are declining, with the US 10-year yield at 3.5%, down from 4.0% earlier, suggesting lower USD appeal Global Economic Outlook.
⭐🌟⭐Global Market Analysis
Global economic conditions play a significant role in currency movements:
Geopolitical events, such as potential tensions, could boost USD as a safe-haven currency, though no major events are currently noted.
Central bank policies are diverging, with the Fed expected to cut rates and the ECB holding steady, narrowing the interest rate differential Central Bank Policies.
Commodity trends, with stable oil prices, have a muted direct impact, though energy costs affect Eurozone inflation.
Stock market performance, with global indices up, suggests risk-on sentiment, potentially supporting EUR over USD Market Performance Analysis.
⭐🌟⭐COT Data and Positioning
COT data provides insights into large trader positions, with recent reports showing:
For euro futures, large speculators are net short, but recent data indicates a reduction in short positions, suggesting emerging bullish sentiment CFTC COT Report.
Positioning shows that institutional traders are cautiously optimistic, with some covering shorts as the price approaches support levels.
Key Insight: Reducing short positions in euro futures align with potential bullish momentum, supporting an upward move.
⭐🌟⭐Intermarket Analysis
Intermarket relationships influence currency valuation:
EUR/USD is positively correlated with stock markets; with global indices performing well, the EUR could benefit from risk-on sentiment Intermarket Correlations.
Gold, trading at $1900 per ounce, slightly up, suggests a weaker USD, supporting EUR strength Gold Price Trends.
Bond yields, with declining US yields, indicate lower USD appeal, potentially boosting EUR/USD Bond Market Insights.
Key Insight: Positive correlations with stocks and gold suggest EUR could strengthen, while declining US yields support this trend.
⭐🌟⭐Quantitative Analysis
Technical analysis provides insights into price trends:
At 1.05000, EUR/USD is approaching key support at 1.0450, with resistance at 1.0600, based on recent charts EUR/USD Technical Analysis.
Moving averages show the 50-day MA at 1.0550 and the 200-day MA at 1.0700, with the price below both, indicating a downtrend TradingView Analysis.
RSI (Relative Strength Index) is at 45, neutral, suggesting potential for a bounce if support holds Technical Indicators Guide.
Key Insight: The pair is at a crucial support level, with technicals suggesting a possible upward reversal.
⭐🌟⭐Market Sentimental Analysis
Market sentiment reflects trader positioning and expectations:
Recent data shows mixed sentiment, with some traders expecting USD strength to continue, while others see potential for EUR recovery due to improving fundamentals Forex Sentiment EURUSD.
Bank forecasts predict EUR/USD rising to 1.08 by year-end, citing Eurozone recovery and expected Fed rate cuts Currency Forecasts.
Key Insight: Emerging optimism about the euro supports a bullish outlook, though caution remains due to recent USD strength.
⭐🌟⭐Next Trend Move
Combining all factors, the next trend move for EUR/USD is likely upward:
The pair is at a key support level (1.0450), and if it holds, could bounce back to test resistance at 1.0800.
Potential catalysts include better-than-expected Eurozone data and Fed rate cut expectations, supporting EUR strength.
Key Insight: The next move favors an upward continuation, with risks of further downside if support breaks.
⭐🌟⭐Overall Summary Outlook
The EUR/USD pair, at 1.05000 on March 4, 2025, exhibits a cautiously bullish outlook. Key drivers include improving Eurozone fundamentals, with GDP growth expected to rise to 0.8% in Q1 2025 and declining inflation, narrowing the interest rate differential as the Fed is expected to cut rates by 0.25% in September 2025. Technical indicators suggest the pair is at a crucial support level, with potential for a bounce, supported by reducing short positions in euro futures and positive intermarket correlations with stocks and gold. Risks include persistent USD strength if US data remains robust or global risk-off sentiment boosts the USD. However, the prevailing trend points to a potential EUR appreciation in the near term.
⭐🌟⭐Future Prediction
Trend: Bullish
Details: The pair is likely to see an upward move, testing resistance at 1.0800 in the near term, driven by Eurozone recovery and expected Fed rate cuts. Risks include stronger-than-expected US data maintaining USD dominance, but current indicators suggest a reversal is imminent.
📌Keep in mind that these factors can change rapidly, and it's essential to stay up-to-date with market developments and adjust your analysis accordingly.
⚠️Trading Alert : News Releases and Position Management 📰 🗞️ 🚫🚏
As a reminder, news releases can have a significant impact on market prices and volatility. To minimize potential losses and protect your running positions,
we recommend the following:
Avoid taking new trades during news releases
Use trailing stop-loss orders to protect your running positions and lock in profits
💖Supporting our robbery plan 💥Hit the Boost Button💥 will enable us to effortlessly make and steal money 💰💵. Boost the strength of our robbery team. Every day in this market make money with ease by using the Thief Trading Style.🏆💪🤝❤️🎉🚀
I'll see you soon with another heist plan, so stay tuned 🤑🐱👤🤗🤩

EUR/USD "The Dollar Crusher" Forex Market Bullish Heist Plan🌟Hi! Hola! Ola! Bonjour! Hallo!🌟
Dear Money Makers & Thieves, 🤑 💰🐱👤
Based on 🔥Thief Trading style technical and fundamental analysis🔥, here is our master plan to heist the EUR/USD "The Dollar Crusher" Forex market. Please adhere to the strategy I've outlined in the chart, which emphasizes long entry. Our aim is the high-risk Red Zone. Risky level, overbought market, consolidation, trend reversal, trap at the level where traders and bearish robbers are stronger. 🏆💸Be wealthy and safe trade.💪🏆🎉
Entry 📈 : "The heist is on! Wait for the breakout (1.04500) then make your move - Bullish profits await!"
however I advise placing Buy Stop Orders above the breakout MA or Place Buy limit orders within a 15 or 30 minute timeframe. Entry from the most recent or closest low or high level should be in retest.
Stop Loss 🛑: Thief SL placed at 1.03500(swing Trade) Using the 2H period, the recent / nearest low level.
SL is based on your risk of the trade, lot size and how many multiple orders you have to take.
Target 🎯: 1.07000 (or) Escape Before the Target
Scalpers, take note 👀 : only scalp on the Long side. If you have a lot of money, you can go straight away; if not, you can join swing traders and carry out the robbery plan. Use trailing SL to safeguard your money 💰.
📰🗞️Fundamental, Macro, COT, Sentimental Outlook:
EUR/USD "The Dollar Crusher" Forex Market market is currently experiencing a bullish trend,., driven by several key factors.
🔴Fundamental Analysis
- The Eurozone's economic growth is expected to slow down, while the US economy is expected to grow at a moderate pace.
- The European Central Bank (ECB) is expected to keep interest rates steady, while the Federal Reserve is expected to maintain its accommodative monetary policy.
🟤Macro Analysis
- The Eurozone's inflation rate is expected to remain low, while the US inflation rate is expected to remain above the Federal Reserve's target.
- The Eurozone's trade balance is expected to remain in surplus, while the US trade balance is expected to remain in deficit.
🟠Sentimental Analysis
- Institutional investors have a bullish sentiment towards the EUR/USD pair, with 55% of investors being bullish.
- Hedge funds have increased their long positions in the EUR/USD pair, with a net long exposure of 12%.
🟣COT Analysis
- The Commitments of Traders (COT) report shows that commercial traders have increased their long positions in the EUR/USD pair, with a net long exposure of 10%.
- Non-commercial traders have also increased their long positions, with a net long exposure of 15%.
🟡Trader Sentiment
- Retail traders have a bullish sentiment towards the EUR/USD pair, with 52% of traders being bullish.
- Commercial banks have increased their EUR/USD holdings, with a growth rate of 5%.
🔵Bullish and Bearish Data:
- Bullish Sentiment: Institutional investors have a bullish sentiment towards the EUR/USD pair, with 55% being bullish. Hedge funds have increased their long positions, with a net long exposure of 12%
- Bearish Sentiment: Asset managers are trimming their long exposure, and gross shorts are trending higher for large specs and asset managers since Q4
🟢Based on this analysis, the EUR/USD pair is expected to move in a bullish trend, with a 55% chance of an uptrend and a 35% chance of a downtrend. However, please note that market predictions can be unpredictable and influenced by various factors
⚠️Trading Alert : News Releases and Position Management 📰 🗞️ 🚫🚏
As a reminder, news releases can have a significant impact on market prices and volatility. To minimize potential losses and protect your running positions,
we recommend the following:
Avoid taking new trades during news releases
Use trailing stop-loss orders to protect your running positions and lock in profits
📌Please note that this is a general analysis and not personalized investment advice. It's essential to consider your own risk tolerance and market analysis before making any investment decisions.
📌Keep in mind that these factors can change rapidly, and it's essential to stay up-to-date with market developments and adjust your analysis accordingly.
💖Supporting our robbery plan will enable us to effortlessly make and steal money 💰💵 Tell your friends, Colleagues and family to follow, like, and share. Boost the strength of our robbery team. Every day in this market make money with ease by using the Thief Trading Style.🏆💪🤝❤️🎉🚀
I'll see you soon with another heist plan, so stay tuned 🤑🐱👤🤗🤩

EURUSD Faces Resistance zone – Will Bears Take Over?The EURUSD ( FX:EURUSD ) has reached the Resistance zone($1.0983-$1.0916) as I expected in my previous post . Can the EURUSD break the Resistance zone($1.0983-$1.0916) ?
EURUSD is moving near the Resistance zone($1.0983-$1.0916) , the Resistance line , and Yearly Resistance(1) .
According to the Elliott Wave theory , EURUSD seems to have completed 5 impulse waves and we can expect Corrective Waves .
Also, we can see the Regular Divergence(RD-) between Consecutive Peaks .
I expect the EURUSD to decline to at least the Support zone($1.0817-$1.0760) in the coming hours after breaking the lower line of the ascending channel . One of the EURUSD targets could be as wide as the ascending channel .
Note: If EURUSD breaks the Resistance zone($1.0983-$1.0916), we can expect more pumps.
Please respect each other's ideas and express them politely if you agree or disagree.
Euro/U.S. Dollar Analyze (EURUSD), 1-hour time frame.
Be sure to follow the updated ideas.
Do not forget to put a Stop loss for your positions (For every position you want to open).
Please follow your strategy and updates; this is just my Idea, and I will gladly see your ideas in this post.
Please do not forget the ✅' like '✅ button 🙏😊 & Share it with your friends; thanks, and Trade safe.
