EURUSDEURUSD has gotten to the Daily OB where we are looking for possible reversal confirmations. And here on the 15mins - price has Changed Character and also confirmed with a new BOS, before the BOS, we can see how price has reacted, creating even more liquidity - equal highs close to our entry zone which is above 50% fib retracement. I am looking to short price from the 1.09048 zone targeting the 1.08416 zone where we have a possible roadblock for price to stop and continue the buys on the 1H TF, or sell all the way to the 1.06068 zone to facilitate a new buys.
Eurusdprediction

EURUSD Analysis todayHello traders, this is a complete multiple timeframe analysis of this pair. We see could find significant trading opportunities as per analysis upon price action confirmation we may take this trade. Smash the like button if you find value in this analysis and drop a comment if you have any questions or let me know which pair to cover in my next analysis.

EUR/USD: The Euro Stays in Overbought TerritoryThe pair has been rising for the last five sessions, gaining approximately 1.4% , as expansionary policies in European countries have restored confidence in the euro. In contrast, the U.S. dollar continues to struggle with maintaining consistent demand due to the ongoing tariff battle led by the White House.
Accelerated Movement:
Since March 3rd, EUR/USD has experienced growth of over 5%, driven by strong short-term bullish momentum. Currently, the price is slowly approaching a key resistance zone, but recent price oscillations suggest that bullish momentum is fading, which could lead to short-term bearish corrections.
RSI Indicator:
The RSI line has started oscillating above the 70 level, which is the official overbought zone of the indicator. This suggests that the balance between buying and selling pressure has been lost, with bullish momentum fully dominating the market. The increasing speed of demand for EUR/USD may indicate a potential emergence of bearish corrections in the short term.
MACD Indicator:
The MACD histogram remains at its highest levels of the year, suggesting that buying pressure may be entering a phase of constant exhaustion. In the long run, this could also open the possibility of selling corrections in the upcoming sessions.
Key Levels:
1.1000 – Tentative Resistance: A potential psychological barrier that the price may face in its prolonged bullish streak. Oscillations above this level could confirm sustained buying pressure and signal the beginning of stronger upward movements in the chart.
1.07944 – Near-term Support: A neutral zone where the price has shown stability in the short term. This level may be important for potential selling corrections in the next trading sessions.
1.06173 – Distant Support: A key level corresponding to the highs reached in December 2024. Bearish oscillations reaching this level could jeopardize the current strong bullish trend.
By Julian Pineda, CFA – Market Analyst

EURUSD Analysis todayHello traders, this is a complete multiple timeframe analysis of this pair. We see could find significant trading opportunities as per analysis upon price action confirmation we may take this trade. Smash the like button if you find value in this analysis and drop a comment if you have any questions or let me know which pair to cover in my next analysis.

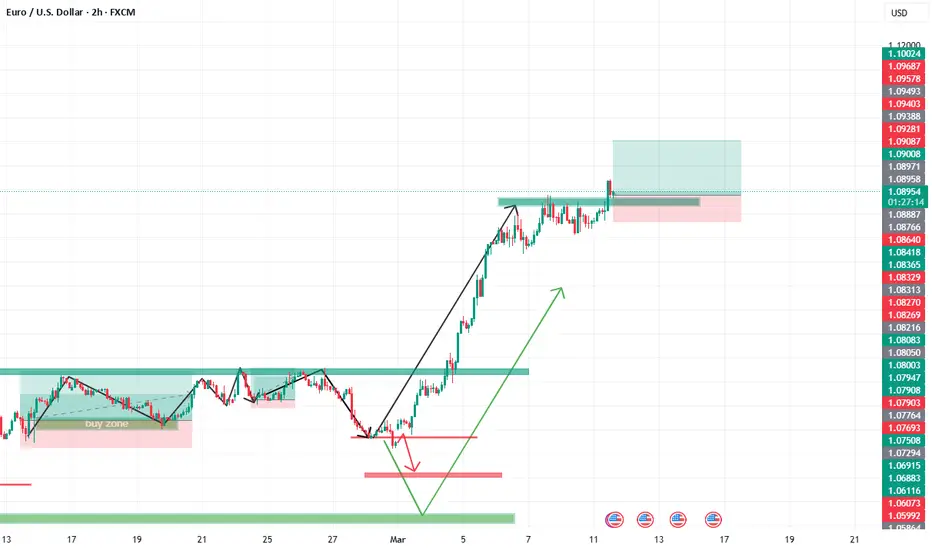
EUR/USD – Bullish, But Time to Breathe!🚀 EUR/USD – Bullish, But Time to Breathe! 🚀
“Momentum is strong, but even the best trends need to take a breath before the next leg up.”
🔥 Key Insights:
✅ Bullish Structure Intact – No reason to fight the trend.
✅ Overextended Move – Markets don’t go up in a straight line; pullbacks create better entries.
✅ Healthy Retracement = Stronger Continuation – Chasing here is risky, waiting for a dip is smart.
💡 The Plan:
Wait for a Pullback Before Longs – Let price reset, don’t rush in.
Watch Volume Profile & CDV for Buyer Confirmation – Smart money leaves clues.
Ideal Entry = Lower Support Levels Holding – We want a strong base for the next move up.
“Patience is key. Let the market give you the perfect entry—not every green candle is a buy!” 🚀💶
I keep my charts clean and simple because I believe clarity leads to better decisions.
My approach is built on years of experience and a solid track record. I don’t claim to know it all, but I’m confident in my ability to spot high-probability setups.
If you would like to learn how to use the heatmap, cumulative volume delta and volume footprint techniques that I use below to determine very accurate demand regions, you can send me a private message. I help anyone who wants it completely free of charge.
I have a long list of my proven technique below:
🎯 ZENUSDT.P: Patience & Profitability | %230 Reaction from the Sniper Entry
🐶 DOGEUSDT.P: Next Move
🎨 RENDERUSDT.P: Opportunity of the Month
💎 ETHUSDT.P: Where to Retrace
🟢 BNBUSDT.P: Potential Surge
📊 BTC Dominance: Reaction Zone
🌊 WAVESUSDT.P: Demand Zone Potential
🟣 UNIUSDT.P: Long-Term Trade
🔵 XRPUSDT.P: Entry Zones
🔗 LINKUSDT.P: Follow The River
📈 BTCUSDT.P: Two Key Demand Zones
🟩 POLUSDT: Bullish Momentum
🌟 PENDLEUSDT.P: Where Opportunity Meets Precision
🔥 BTCUSDT.P: Liquidation of Highly Leveraged Longs
🌊 SOLUSDT.P: SOL's Dip - Your Opportunity
🐸 1000PEPEUSDT.P: Prime Bounce Zone Unlocked
🚀 ETHUSDT.P: Set to Explode - Don't Miss This Game Changer
🤖 IQUSDT: Smart Plan
⚡️ PONDUSDT: A Trade Not Taken Is Better Than a Losing One
💼 STMXUSDT: 2 Buying Areas
🐢 TURBOUSDT: Buy Zones and Buyer Presence
🌍 ICPUSDT.P: Massive Upside Potential | Check the Trade Update For Seeing Results
🟠 IDEXUSDT: Spot Buy Area | %26 Profit if You Trade with MSB
📌 USUALUSDT: Buyers Are Active + %70 Profit in Total
🌟 FORTHUSDT: Sniper Entry +%26 Reaction
🐳 QKCUSDT: Sniper Entry +%57 Reaction
📊 BTC.D: Retest of Key Area Highly Likely
I stopped adding to the list because it's kinda tiring to add 5-10 charts in every move but you can check my profile and see that it goes on..

EurUsd ShortEUR/USD Short Idea
The EUR/USD pair is approaching the 1.09700--1.09940--1.10204 resistance level, which aligns with a significant supply zone and a potential area for bearish reversal.
Key Analysis:
Resistance Zone:
The 1.09700--1.09940--1.10204 levels marks a critical resistance where selling pressure has previously emerged.
Technical Indicators:
RSI is approaching overbought conditions, indicating limited upside potential.
Bearish divergence may form if momentum weakens near this level.
Fundamental Context:
A stronger USD due to hawkish Fed sentiment or economic data could pressure EUR/USD downward.
Eurozone economic uncertainties may add to bearish bias.
Entry: Short positions around 1.09700--1.09940--1.10204
This setup offers a favorable risk-reward opportunity in a high-probability reversal zone.

EURUSD Going To ShortThe EUR/USD currency pair is likely to experience a short movement due to the presence of a clear hidden bearish divergence. This divergence suggests that despite the price making lower highs and RSI making Higher High, the momentum behind these movements is weakening, indicating potential for a downward reversal. Additionally, the price is approaching an unmitigated order block around the 1.098xx region. An unmitigated order block represents an area where price has previously reversed and not yet been revisited, increasing the likelihood of a reaction when price reaches this zone.
Furthermore, the Fibonacci retracement level of 0.786 aligns closely with this order block, strengthening the case for a bearish reversal. Fibonacci retracement levels are commonly used to predict potential areas of support and resistance, and the 0.786 level is often a key point for reversals in trends. This combination of technical factors suggests that a significant fall is anticipated from the 1.098xx level.
You should watch for confirmation signals, such as a clear break of support or bearish candlestick patterns, to solidify the bearish outlook. Given the confluence of these technical indicators, the probability of a substantial decline is high.
1st TP: 1.075x
2nd TP: 1.065x

EURUSD BUY/LONGeurusd breakout
take long on eurusd
hello traders trend is up trend and now price breakout a resistance level so ling is logical
Technical Analysis: EUR/USD Bullish SetupThe EUR/USD chart shows a textbook setup with the EMA Trading System providing a high-probability long entry.
System Signals
EMA System Status: Bullish Signal with Bullish Trend
Alignment: Confirmed (optimal confluence)
Chart Pattern: Bullish reversal after pullback to dynamic support
Key Technical Elements
The price action shows a clear bullish reversal pattern with an uptrend resuming after testing the 21 EMA support
Background coloring is green, confirming the 21 EMA > 55 EMA relationship (bullish trend)
A green triangle entry signal is visible where the 8 EMA crossed above the 55 EMA
All EMAs are properly aligned in a bullish stack formation (8 > 13 > 21 > 55)
MACD indicators (bottom of chart) show positive momentum with blue line crossing above orange line
Trade Parameters
Entry: 1.08901
Price Target: 1.10028 (1127 ticks/pips gain)
Stop Loss: 1.08356 (545 ticks/pips protection)
Risk-Reward Ratio: 1:2
Market Context
The EUR/USD is showing strength in an established uptrend. The recent pullback created an ideal entry point as price found support at key EMA levels before resuming its upward trajectory. Volume is supporting the move as indicated by the rising histogram bars below the chart.
This setup aligns perfectly with our MACR strategy parameters, offering a high-probability trade with excellent risk-reward characteristics.
The Confirmed alignment status and clear bullish trend provide strong confluence factors supporting this long position.

EUR/USD at Key Resistance: Is a Major Retrace Coming? 💹📉
In this video, we dive deep into the EUR/USD currency pair and analyze the current market conditions. 📊 At the moment, the pair is overextended and trading into a critical weekly resistance level. 🚨 There's a high probability that the buy orders driving the price higher will interact with the buy stops resting at this zone, potentially triggering a significant retracement. 🔄 Join me as we break down the trend, price action, and market structure, and explore a potential trade idea based on these insights. 🧠💡 Whether you're a seasoned trader or just starting out, this analysis will give you valuable perspectives on how to approach key levels in the market. ⚠️ This is not financial advice—always trade responsibly! ⚠️
Don't forget to like, comment, and subscribe for more market insights! 👍📈✨

Are EUR/USD Bulls burnt out yet?...After last week’s monstrous bull move on the EUR/USD, I had short positions at 1.0740 and 1.0795 which I ended up closing because I wanted to wait and see how much momentum this thing had.
I got back in short at an average price of 1.0827 with a modest target at 1.0600. Although it looks like bullish momentum is stalling, I remain cautious.
Resistance at the upper trend-line and Fibonacci (Tesla Number 63.69%) looks to be setting a ceiling so hopefully we begin retracing.
Trading convincingly above 1.0900 would invalidate this EUR/USD trade.
Also, the stock market is currently getting hammered so my put options on TQQQ are looking good thus far as well.
For more in depth analysis on the current positions, refer to my previous video posted.
We’ll see how this one progresses.
Good Luck and Trade Safe.

FX Pre Market Analysis - Is the EUR/USD explosion slowing down?In this week's pre market analysis video, I go over the completed EUR/USD trade and what I'm looking for moving forward. The EUR/USD had an explosive bullish move last week however, there could be indications of momentum slow down.
Currently holding short at 1.0815 and would like to see us stay below 1.0900 - 1.9500 max for a pullback towards 1.06000.
The long term perspective could indicate a pullback out of a large triangle formation, followed by equal or new lows below 1.0000.
Good Luck and Trade Safe.

#EURUSD 1DAYEURUSD (1D Timeframe) Analysis
Market Structure:
The price is currently facing resistance and has formed a sell engulfing pattern, indicating potential bearish pressure. This suggests that sellers are gaining control and a downward move may be expected from this level.
Forecast:
A sell opportunity may arise if the price continues to respect the resistance level and confirms bearish momentum.
Key Levels to Watch:
- Entry Zone: A sell position can be considered near the resistance zone after confirmation of bearish price action.
- Risk Management:
- Stop Loss: Placed above the resistance zone to manage risk.
- Take Profit: Target key support levels based on previous price action.
Market Sentiment:
The formation of a sell engulfing pattern at resistance indicates strong selling interest. Confirmation of bearish momentum can provide a better validation for a sell setup.

EURUSDWe are expecting this pair to give us pullback early part of the week, even if market decides to go back up further.

EURUSD Will be in bearish directionHello Traders
In This Chart EURUSD HOURLY Forex Forecast By FOREX PLANET
today EURUSD analysis 👆
🟢This Chart includes_ (EURUSD market update)
🟢What is The Next Opportunity on EURUSD Market
🟢how to Enter to the Valid Entry With Assurance Profit
This CHART is For Trader's that Want to Improve Their Technical Analysis Skills and Their Trading By Understanding How To Analyze The Market Using Multiple Timeframes and Understanding The Bigger Picture on the Charts

EURUSD $EURUSD | 4% EURUSD BULLISH RALLY Mar09'25EURUSD FX:EURUSD | 4% EURUSD BULLISH RALLY Mar09'25
Sparros Exchange Trend Table:
FX:EURUSD Weekly Trend: Bullish
FX:EURUSD Daily Trend: Bullish
FX:EURUSD 4H Trend: Bullish
FX:EURUSD 1H Trend: Bullish
BUY/LONG ZONE (GREEN): 1.08750 - 1.11100
DO NOT TRADE/DNT ZONE (WHITE): 1.08155 - 1.08750
SELL/SHORT ZONE (RED): 1.05125 - 1.08155
EURUSD has rallied over +4% this past week.
This is what I would personally look at before entering trades, everything is subject to change on a daily basis and as I analyze different timeframes and ideas.
ENTERTAINMENT PURPOSES ONLY, NOT FINANCIAL ADVICE!
trendanalysis, trendtrading, priceaction, priceactiontrading, technical indicators, support and resistance, eurusd, eu, eur, usd, currency, currencies, currencytrading, forex, foreignexchange, eurusdtrade, eurusdidea, eurusdanalysis, bullrally, eurusdrally, eurusdrun, eurusdbullrun, eurusdprice,

EUR/USD Ready to DROP? | Monthly FVG Sell Zone in Focus! 💰 Smart Money Preparing for a Bearish Move on EUR/USD!
The EUR/USD is reacting from a key Monthly Fair Value Gap (FVG) and is currently in a Monthly Corrective Phase (CRT). This signals that institutions might be positioning for a larger bearish move.

EUR/USD – Bullish Outlook for Next Week🔹 Higher Timeframe Structure:
The daily timeframe structure remains bullish, with clear signs of institutional order flow supporting further upside. Last week's price action confirmed a shift in momentum, respecting key bullish levels.
🔹 Key Technical Levels:
✅ Daily FVG (Fair Value Gap) Support: Acting as a strong demand zone, buyers are expected to step in from this area.
✅ Next Bullish Target: 1.06600 – This level aligns with previous liquidity pools and imbalance fill zones.
✅ Market Structure: Higher highs (HH) & higher lows (HL) indicate continued bullish pressure.
🔹 Institutional Confluence:
🔸 Liquidity has been built below recent lows, creating a potential liquidity grab before a strong bullish expansion.
🔸 SMC Concepts: Price is trading within an unmitigated Order Block (OB), adding confirmation for a bullish reaction.
🔸 Volume Profile: Increasing institutional volume suggests accumulation in the current zone.
📌 Plan for Next Week:
As long as price holds within the Daily FVG, we anticipate bullish continuation towards 1.06600. If we get confirmation from the lower timeframes (H4/M15), we will look for long entries with high R:R setups.
💡 Follow for more high-accuracy analysis & real-time trade updates! 🚀
#EURUSD #Forex #SmartMoney #ICT #SMC #Liquidity #ForexTrading

EUR/USD: Breakdown Amidst Euro Surge on German Fiscal StimulusThe EUR/USD currency pair has recently experienced significant movements influenced by both technical patterns and fundamental developments.
Technical Analysis:
The EUR/USD pair has been trading within a well-defined ascending channel, characterized by higher highs and higher lows. However, recent price action indicates a breach below the channel’s lower boundary, suggesting potential bearish momentum. This breakdown could signal a trend reversal or a corrective phase, with the next support level identified around 1.06339. Traders should monitor this level closely, as a sustained move below it may confirm further downside potential.
Fundamental Analysis:
The euro has surged, marking its most substantial weekly gain against the dollar since 2009. This appreciation is largely attributed to Germany’s announcement of a historic fiscal stimulus package aimed at bolstering the Eurozone’s economic recovery. In contrast, the U.S. dollar has weakened due to escalating trade tensions and concerns over the economic implications of aggressive trade policies under President Trump. Investors are increasingly favoring the euro, reflecting optimism about the Eurozone’s growth prospects compared to the uncertain U.S. economic outlook.

EURUSD IDEA : SHORTS | SELL (07/03/25)This is a theory. I believe price on the weekly is clearly over extended. With the NFP incoming, it may seek to fall from here especially with a clear setup occurring on the W TF. I believe price to be bearish at this point, having interacted on the weekly POI - Please look at the charting before making any decisions, and let me know what you think of it.
N.B.: This is not financial advice. Trade safely and with caution.

EURUSD Analysis todayHello traders, this is a complete multiple timeframe analysis of this pair. We see could find significant trading opportunities as per analysis upon price action confirmation we may take this trade. Smash the like button if you find value in this analysis and drop a comment if you have any questions or let me know which pair to cover in my next analysis.

EUR/USD Daily OutlookEUR/USD is losing upside momentum after hitting 1.0853 and intraday bias is turned neutral first. Downside of retreat should be contained above 55 4H EMA (now at 1.0593) to bring another rally. Above 1.0853 will resume the rise from 1.0176 to 161.8% projection of 1.0176 to 1.0531 from 1.0358 at 1.0932 next.
Intraday bias in EUR/USD remains on the upside as current rally from 1.0176 is still in progress. Next target is 161.8% projection of 1.0176 to 1.0531 from 1.0358 at 1.0932 On the downside, below 1.0721 minor support will turn intraday bias neutral and bring consolidations first, before staging another rise.

EURUSD - FOMC Prep - These 2 scenarios to anticipateMarket is overall uptrend after previous low showed the reversal point to head higher.
Bias is for the Buy
However, FOMC can produce volatility so we can have spikes in both direction.
There's a Sell scenario off an H4 gap.
But the preferred idea is to head lower, getting a better price on the HTF, then continue to the Equal Highs / Double top, taking out the liquidity target eventually.
Be aware, if it's not clear this week, we may have a clearer picture on next week's news and the move could also happen then if there's a delay/ranging market.
The D1 timeframe usually provides the smoother outlook. I mostly base my ideas on that.
Leave your comments below if you have any questions. Thanks
