EUR/USD 1.0600 target hit and cleared. Possible Danger Ahead...Mid week update on the EUR/USD trade: The target has been hit out of the descending broadening pattern and a 343 pip gain at 1.06220 has been locked in.
The EUR/USD made a very strong bullish move today which enabled an exit in the trade however, I am now keeping a very close eye on the possible bearish opportunity coming up if price begins trading around 1.07000 at that upper trend-line.
Both the MACD and the RSI are displaying a continuation divergence (otherwise known as a "Hidden" divergence") and that could spell very bad news for the bulls.
I have done some analysis on the weekly and monthly chart and it further gives me a reason that the bears could be lurking around the corner. I will include that analysis in my next weekly pre market preview video.
For the previous analysis on the EUR/USD and Stock Market down move, refer to my previous video posted.
Update you all soon.
Good Luck & Trade Safe.
Eurusdprediction

Eurusd sell zoneThis is a EUR/USD (Euro/US Dollar) 1-hour timeframe technical analysis from FXCM, showing a sell trade setup with the following key details:
1. Entry Point: Around 1.05112, marked in yellow.
2. Stop Loss: Placed at 1.05690 (red zone), indicating the level where the trade will be exited if the price moves against the setup.
3. Target Level: 1.03978, shown in blue, representing the expected price drop and profit target.
4. Market Outlook: The analysis suggests a potential bearish move, with price expected to decline from the entry point, retrace slightly, and then drop further to hit the target.
5. Risk-Reward Ratio: The trade setup has a favorable risk-reward structure, with the potential reward being larger than the risk.
This setup is based on the expectation that EUR/USD will reverse from resistance and move downward, making it a short (sell) trade opportunity.

EURUSDBuyers still holding until it breaks resistance level,
Yesterday, the gap ` respected 50% encroachment as continuous to go bullish and created price balance range which indicates to go more bullish.
Waiting for confirmation until the BPR gets respected and retested

EUR/USD holds firm above 1.0400EUR/USD remains above 1.0400 in European trading on Monday, supported by Europe’s renewed peace efforts in Ukraine and positive Chinese PMI data, which bolster risk sentiment. This situation puts pressure on the US Dollar as the pair awaits EU inflation data.


EURUSD Poised for a Pullback—Possible Sell Opportunity Incoming!Watching EURUSD, a potential retrace into the imbalance today and into Monday could present a selling opportunity between Monday and Tuesday. I’ll aim to follow up with a video over the weekend or on Monday. For now, be cautious—avoid selling at this level, as price is trading into a key support zone.

EURUSD Correcting – Another Fall Ahead?Today I want to analyze EURUSD ( FX:EURUSD ) for a 15-minute time frame and whether EURUSD is ready to fall or not.
EURUSD is moving in a Heavy Resistance zone($1.0537-$1.04500) . It also moves in the descending channel in the 15-minute time frame.
According to the theory of Elliott waves , it seems that EURUSD has completed its 5 downward waves , and we should wait for corrective waves . I expect corrective waves to end either in a descending channel or eventually at a Resistance zone($1.0493-$1.0480) .
I expect EURUSD to attack the Support lines in the coming hours, and if the Support lines break , we should expect a decline to at least 100_SMA(4-hour) .
Note: If EURUSD breaks the Resistance line, we can expect more pumps.
Please respect each other's ideas and express them politely if you agree or disagree.
Euro/U.S.Dollar Analyze (EURUSD), 15-minute time frame.
Be sure to follow the updated ideas.
Do not forget to put Stop loss for your positions (For every position you want to open).
Please follow your strategy and updates; this is just my Idea, and I will gladly see your ideas in this post.
Please do not forget the ✅' like '✅ button 🙏😊 & Share it with your friends; thanks, and Trade safe.

EUR/USD Technical Outlook: Key Levels & Trade Setup (Feb 27)📌 Hello traders! FuInvest here, bringing you today’s OANDA:EURUSD technical breakdown. The market never sleeps, and neither should your trading edge! Let’s dive into the price action and key levels for February 27.
📊 Market Overview
Current Price: 1.04783
Market Session: 📍 European Session (Transitioning into New York soon)
Indicators Used: EMA 34 (Gray), EMA 89 (Yellow), EMA 200 (Pink)
Volatility Check: 🔥 Volume picking up, suggesting potential breakouts ahead!
📉 Price Action & Trend Analysis
The EUR/USD pair has been oscillating around the 1.0480 level, showing a recent rejection from the EMA 89 (Yellow) and approaching the long-term EMA 200 (Pink). The short-term trend is mixed, but price action suggests a possible pullback before further movement.
🔹 Bullish Scenario: If buyers regain strength and push above 1.0490, we could see momentum targeting 1.0515 – 1.0530.
🔹 Bearish Scenario: If price fails to hold 1.0470, a downside test towards 1.0450 – 1.0430 is likely.
🛒 Trade Setup & Recommendations
Based on price structure and EMA confluence, here’s our trade idea:
📌 Buy Entry: 1.0470 – 1.0475
🎯 Take Profit (TP): 1.0515, 1.0530
🛑 Stop Loss (SL): 1.0450
📌 Sell Entry: 1.0495 – 1.0500
🎯 Take Profit (TP): 1.0455, 1.0430
🛑 Stop Loss (SL): 1.0515
🚀 Key Takeaways & Trading Plan
✅ The 1.0470 – 1.0490 range is a battleground for price action. A break and close above 1.0490 could signal further upside, while rejection could offer a selling opportunity.
✅ EMA alignment suggests a cautious bullish bias, but confirmation is key!
✅ Volatility is increasing as the New York session approaches – expect bigger moves soon!
🔔 Stay tuned for more updates and real-time insights! Follow FuInvest for daily market breakdowns and discover how to build passive income through smart trading strategies! 🚀

EUR/USD: Ascending Triangle Formation Points to Liftoff!● The EUR/USD pair tried to climb above 1.0530 but got pushed back, slipping lower.
● However, the charts are hinting at a potential breakout with an Ascending Triangle pattern forming.
● If the pair can finally break through 1.0530, it could spark a rally toward 1.0600.
● Stay tuned; the next move could be explosive! 🚀

Eurusd Short holders Beware!!!Hello Guys
Here We have a long setup for the Euros where we are most likely to target above the retail resistance level 1.0535 and above, where all stoploss resides.
i have uploaded the entry stoploss and target already to play out the long setup here.
Good luck Good trading
:)

EUR/USD at a Crossroads: Will Trade Tensions Push It Lower? EUR/USD has been struggling to maintain momentum above the 1.0500 mark, facing renewed selling pressure as macroeconomic and geopolitical factors influence sentiment. With the US Dollar regaining strength and concerns about European economic stagnation growing, the pair remains vulnerable to further downside.
Technical Analysis:
Resistance Levels: 1.0532 (January 27 high), 1.0629 (December peak), 1.0744 (200-day SMA).
Support Levels: 1.0405 (55-day SMA), 1.0282 (February 10 low), 1.0209 (February 3 low), and 1.0176 (January 13 YTD low).
Indicators: The Relative Strength Index (RSI) is near 55, indicating modest momentum, while the Average Directional Index (ADX) remains around 15, suggesting a weakening trend.
Moving Averages: The 200-day SMA at 1.0744 serves as a key dynamic resistance, while the 55-day SMA at 1.0405 acts as interim support.
Fundamental Analysis:
Several key fundamental factors are exerting downward pressure on EUR/USD:
Trade Policy Uncertainty: While US tariff tensions have temporarily eased, lingering trade disputes, including a 10% duty on Chinese imports and potential EU-targeted tariffs, keep investors cautious.
Diverging Central Bank Policies: The Federal Reserve remains firm on keeping interest rates elevated, while the European Central Bank has begun rate cuts, signaling weaker economic confidence in the Eurozone.
Economic Growth Divergence: The US economy continues to show resilience with robust labor markets and stable inflation, while the Eurozone faces stagnation and potential contraction, particularly in Germany.
European Political Risks: Uncertainty in Germany and wider Eurozone economic struggles add to the Euro’s bearish outlook, making it less attractive compared to the US Dollar.
The EUR/USD pair is at a critical juncture, with key support levels in focus. Trade policies, central bank divergence, and economic growth disparities continue to drive market sentiment. This week is pivotal for the Eurozone, with key economic data releases culminating in Friday’s PMI figures, which could determine the pair’s next major move. Traders should remain cautious and closely monitor both technical and fundamental developments.
Note: Please remember to adjust this trade idea according to your individual trading conditions, including position size, broker-specific price variations, and any relevant external factors. Every trader’s situation is unique, so it’s crucial to tailor your approach to your own risk tolerance and market environment.

EUR/USD (30M) – Waiting for a BreakoutHi Traders ! ,The price is ranging between 1.04688 and 1.04819. I'm waiting for a clear breakout to enter:
Buy (long): If it breaks 1.04730 and confirms, it could target 1.04819 and then 1.05050.
RSI is currently at 52.73, showing neutral momentum. A push above 60 would strengthen a bullish setup.
Sell (short): If it drops below 1.04688, it could reach 1.04557 and 1.04400.
If RSI falls below 40, it would confirm bearish momentum.
I prefer to wait for confirmations before taking a position.
Disclaimer: This analysis is for educational and informational purposes only. It is not financial advice. Always do your own research and manage risk before making any trading decisions.

EURUSD: holds steady above 1.0400 amid US tariff threatsEUR/USD holds steady above 1.0450 in the European trading hours on Thursday. Broad US Dollar underperformance supports the pair. However, tariff threats from US President Donald Trump and geopolitical tension might cap its upside. US data and Fedspeak remains in focus.
EUR/USD Technical Overview
Technically, the bullish outlook of EUR/USD remains intact as the major pair holds above the key 100-period Exponential Moving Averages (EMA) on the 4-hour chart. However, the Relative Strength Index (RSI) is located below the midline, near 42.85, suggesting that further downside cannot be ruled out.
The first upside barrier for EUR/USD emerges near 1.0461, the high of February 19. The key resistance level to watch is the 1.0500-1.0505 zone, representing the psychological level and the upper boundary of the Bollinger Band. A decisive break above this level will see a rally to 1.0533, the high of January 27.

EUR/USD Longs from 3hr demand zone My bias for EUR/USD (EU) aligns with my outlook on other dollar pairs, as the Dollar Index (DXY) has been trending lower, reinforcing the bullish momentum for EU, GU, and Gold.
Currently, there’s a clean 3-hour demand zone that caused a break of structure to the upside—this is the move I’m looking to capitalize on. My expectation is for price to continue higher and target the pool of liquidity resting above.
That said, if price shows a shift in character to the downside on the higher timeframes (HTF), I’ll reassess and look for potential opportunities to capitalize on that move instead.
Confluences for EU Buys:
✅ Price is in a strong bullish trend, consistently forming higher highs and higher lows.
✅ The Dollar Index (DXY) remains bearish, supporting this bullish outlook.
✅ Liquidity above that price is likely to target.
✅ Clean 3-hour demand zone that remains unmitigated.
Alternative Scenario:
If price drops below the 3-hour demand zone, I’ll look for my next buy opportunity at the clean 6-hour demand zone around 1.03000, where price would be in a more discounted area.
Stay sharp and trade smart—have a great trading week! 🤺

EURUSD is Ready for a Long BullHello Traders
In This Chart EURUSD HOURLY Forex Forecast By FOREX PLANET
today EURUSD analysis 👆
🟢This Chart includes_ (EURUSD market update)
🟢What is The Next Opportunity on EURUSD Market
🟢how to Enter to the Valid Entry With Assurance Profit
This CHART is For Trader's that Want to Improve Their Technical Analysis Skills and Their Trading By Understanding How To Analyze The Market Using Multiple Timeframes and Understanding The Bigger Picture on the Charts

WEEKLY MARKET OVERVIEW FOR MAJOR CURRENCY PAIRSWEEKLY MARKET OVERVIEW FOR MAJOR CURRENCY PAIRS
1️⃣ NDZUSDT
Overall, the weekly (W) and monthly (M) trends are in a SELL direction ⬇️
However, at the beginning of the week, W will correct upwards (BUY) before facing price resistance around 0.589 - 0.592, which is a potential SELL zone ⚠️
Setup:
✅ BUY at the beginning of the week using Rainbow MG3 indicator on H1 - D1
❌ SELL after price reacts at resistance using Rainbow MG3 on M15 - H4
📊 Projected chart attached
2️⃣ AUDUSDT
The overall trend on W and M is SELL, but D1 is currently correcting upwards 🔄
Setup:
✅ BUY H1 - D1 using Rainbow MG3 indicator
❌ SELL H1 - D1 using Rainbow MG3 indicator
🔁 Trade both directions based on Rainbow MG3 signals
📊 Projected chart attached
3️⃣ EURUSDT
✅ BUY H1 - D1 using Rainbow MG3 indicator
❌ SELL H1 - D1 using Rainbow MG3 indicator
🔁 Trade both directions based on Rainbow MG3 signals
📊 Projected chart attached
4️⃣ GBPUSDT
✅ BUY H1 - D1 using Rainbow MG3 indicator
❌ SELL H1 - D1 using Rainbow MG3 indicator
🔁 Trade both directions based on Rainbow MG3 signals
📊 Projected chart attached
5️⃣ USDCAD
Setup:
✅ BUY H1 - D1
📊 Projected chart attached
6️⃣ USDJPY
Setup:
❌ SELL H4 - W
📊 Projected chart attached
⚡ Trading Signals Confirmation
All trade setups require confirmation using the Rainbow MG3 indicator before execution ✅

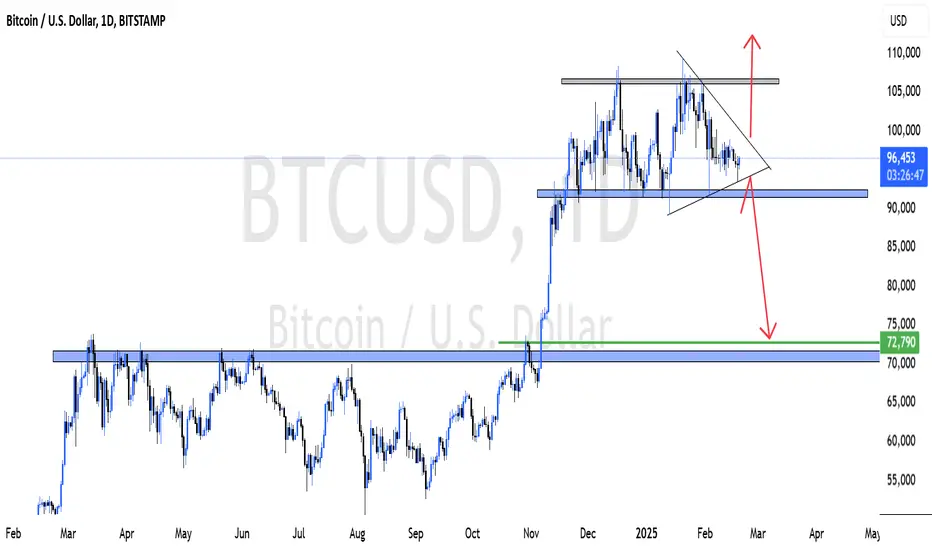
BTC at a Crossroads: Breakout or BreakdownBTC/USD Technical Analysis
Bitcoin (BTC) has been consolidating within a symmetrical triangle pattern, indicating indecision in the market. A breakout in either direction could determine the next major move.
Key Levels to Watch:
Bearish Scenario: A confirmed breakdown below $92,000 could trigger a sell-off toward $72,000, aligning with the untested breakout zone around $70,000, which BTC never retested after surpassing it.
Bullish Scenario: A successful push above $107,000 would invalidate the bearish outlook and signal further upside momentum, potentially leading to new highs.
Market Outlook:
A break above or below the symmetrical triangle will likely set the next trend direction.
Volume and momentum indicators should be monitored for confirmation.
If BTC remains within the triangle, expect continued ranging until a decisive breakout occurs.
This analysis is for educational purposes only and does not constitute financial advice. Always conduct your own research before making investment decisions.
EURUSD BUY LONG Position Technical vs FundamentalTechnical vs Fundamental analysis for EURUSD buy long up to 1.09.This will hit different.Just React

EURUSD Analysis Today Hello traders, this is a complete multiple timeframe analysis of this pair. We see could find significant trading opportunities as per analysis upon price action confirmation we may take this trade. Smash the like button if you find value in this analysis and drop a comment if you have any questions or let me know which pair to cover in my next analysis.

EURUSD Trade Idea – Market ObservationLong trade on EURUSD based on market structure and key price zones.
Beautiful Setup, Let’s see how this plays out!

EURUSD: holds positive ground near 1.0450The EUR/USD pair posts modest gains to around 1.0450 during the Asian trading hours on Wednesday, bolstered by the weakening of the US Dollar. However, tariff concerns and tense Russia-Ukraine negotiations might boost the Greenback and cap the upside for the major pair.

EURUSD Hits Resistances—Reversal Incoming?As I expected in the previous post , the EURUSD( FX:EURUSD ) touched my Targets and is creating the second top of the ascending channel.
The EURUSD is in the Resistance zone($1.0537-$1.04500) , Potential Reversal Zone(PRZ) , Resistance lines , and Time Reversal Zone(TRZ) near the Monthly Resistance(1) and the upper line of the ascending channel.
In terms of Elliott wave theory , EURUSD seems to be completing microwave 5 of the main wave C of the Zigzag Correction(ABC/5-3-5) .
I expect the EURUSD to start falling soon, and it is likely to form a Head and Shoulders Pattern to continue the decline.
Note: If EURUSD touches $1.055, we can expect more pumps.
Please respect each other's ideas and express them politely if you agree or disagree.
Euro/U.S.Dollar Analyze (EURUSD), 1-hour time frame.
Be sure to follow the updated ideas.
Do not forget to put Stop loss for your positions (For every position you want to open).
Please follow your strategy and updates; this is just my Idea, and I will gladly see your ideas in this post.
Please do not forget the ✅' like '✅ button 🙏😊 & Share it with your friends; thanks, and Trade safe.

EUR USD Trade Setup 4 hour timeframe Following last week's setup, we will continue to look for buying opportunities on
EURUSD.
The market remains in a bullish trend, consistently forming higher highs and higher lows on the daily timeframe, confirming upward momentum.
So lets wait for price to pullback to the Higher Low level then looking for entry confirmation.
The market is forming a bullish break and retest pattern
