Uptrend in EURUSDYesterday, EURUSD once again tested the support level at 1,1683 and bounced off it.
We might see another retest of this support zone, but the overall trend remains unchanged.
Watch for signs that the correction is ending — this could present a buying opportunity.
The next resistance levels are at 1,1813 and 1,1916!
Eurusdprediction

EUR/USD Holds Above Key Support — Outlook IntactHi Everyone,
Price briefly dipped below the 1.16680 support, but our broader outlook remains unchanged as long as it continues to hold above the key 1.16450 level. Should buyers successfully defend the 1.16450 zone, we still see potential for the pair to stabilise and make another attempt higher in the coming sessions.
We’ll be monitoring price action closely to see if support continues to hold and whether momentum starts to build back to the upside.
We maintain the view that a decisive break above last week’s high could attract additional buyers, paving the way for a move towards the 1.19290 level and ultimately the 1.20000 level.
We’ll share further updates on the projected path for EUR/USD if price breaks above this key resistance.
The longer-term outlook remains bullish, with expectations for the rally to extend towards the 1.2000 level, provided the price holds above the key support at 1.10649.
We will continue to update you throughout the week with how we’re managing our active ideas and positions. Thanks again for all the likes/boosts, comments and follows — we appreciate the support!
All the best for a good end to the week. Trade safe.
BluetonaFX

EURUSD Will Go Down!
HI,Traders !
#EURUSD is making a
Bullish rebound after a
Bearish breakout but the
Pair will soon hit a new
Horizontal resistance
Of 1.17489 from where
We will be expecting a
Further move down !
Comment and subscribe to help us grow !

EUR/USD Could Take Off From Here! Strategic SetupHi traders! , Analyzing EUR/USD on the 30 minute timeframe, price is currently reacting from a strong support zone near 1.1696, showing potential for a bullish rebound after a sharp drop.
🔹 Entry: 1.1696
🔹 Take Profit (TP): 1.1770
🔹 Stop Loss (SL): 1.1621
After a strong downside move, EUR/USD is attempting a recovery from a key intraday support area. The RSI is bouncing from oversold conditions (around 34), indicating a possible short-term shift in momentum.
Price is also approaching the 200 EMA from below, and a break above could confirm bullish continuation toward the 1.1770 resistance zone. The setup offers a solid risk-reward ratio and aligns with mean reversion expectations.
⚠️ DISCLAIMER: This is not financial advice. Every trader is responsible for their own decisions and risk management.

EUR/USD Update: Breakout Potential Above Recent HighsHi Everyone,
Monday played out as expected; a bounce off the highlighted support area appears to have provided enough momentum for a retest of the 1.18000 level. Price could briefly dip below the 1.16680 support; however, our outlook will remain unchanged as long as we hold above the 1.16450 level.
We maintain the view that a decisive break above last week’s high could attract additional buyers, paving the way for a move towards the 1.19290 level and ultimately the 1.20000 level.
We’ll share further updates on the projected path for EUR/USD if price breaks above this key resistance.
The longer-term outlook remains bullish, with expectations for the rally to extend towards the 1.2000 level, provided the price holds above the key support at 1.10649.
We will continue to update you throughout the week with how we’re managing our active ideas and positions. Thanks again for all the likes/boosts, comments and follows — we appreciate the support!
All the best for a good end to the week. Trade safe.
BluetonaFX

#EURUSD: Nothing to expect from DXY| View Changed Swing Trading|Hey there! So, we were previously thinking EURUSD was going to be bearish, but things have turned around and it’s looking bullish for now.
The extreme bearish pressure on USD has caused all the major USD pairs to be in a range. As the week goes on and we get the NFP data, the market will probably focus more on these economic indicators. So, it’s not surprising to see some market ranges during this time.
We’ll keep a close eye on the market, as there might be some manipulation going on this week.
We recommend waiting until Monday’s daily candle closes to see if the bullish trend is strong enough. Then, based on the price momentum, you can make your decisions.
We hope you have a great week and safe trading! If you like our work and analysis, please consider liking, commenting, and sharing our content.
Cheers,
Team Setupsfx
❤️🚀

Long EURUSDThe uptrend on EURUSD remains intact, and buying opportunities are still the only viable option.
No major news is expected from the economic calendar this week.
Watch for the end of the current pullback and signs of a new bullish move.
The target is a breakout above the previous high, aiming for 1,1915.

EUR/USD: UPDATEHello friends
Everything is clear on the chart for you, our probability is price growth until the specified areas.
In case of price decline, we have identified two support areas where you can buy.
Be sure to observe risk and capital management.
*Trade safely with us*

EUR/USD Rally Pauses Near 1.18000 – Higher Targets in SightHi Everyone,
Last week, price action delivered the 1.18000 level we had been calling for, and as expected, dynamic resistance around that area proved to be significant.
Looking ahead, we anticipate EUR/USD will continue to test the 1.18000 level this week while holding above the 1.16680 support zone. A strong break above last week’s high could attract further buyers, paving the way for a move towards the 1.19290 and ultimately the 1.20000 levels. We’ll share further updates on the projected path for EUR/USD if price breaks above this level.
The longer-term outlook remains bullish, with expectations for the rally to extend towards the 1.2000 level, provided the price holds above the key support at 1.10649.
We will continue to update you throughout the week with how we’re managing our active ideas and positions. Thanks again for all the likes/boosts, comments and follows — we appreciate the support!
All the best for a good end to the week. Trade safe.
BluetonaFX

EURUSDEURUSD needs more correction downwards before further push up.
Disclosure: We are part of Trade Nation's Influencer program and receive a monthly fee for using their TradingView charts in our analysis.

EUR/USD breakout awaiting EUR/USD has not provided a clear structure over the past week or two. The pair appears to be in consolidation, building liquidity on both sides of the current range. At the moment, I’m waiting for a decisive breakout, ideally followed by distribution within the monthly supply zone, although that zone is still some distance away.
This week, my focus will be on whether a new supply zone forms, closer to current price. If price sweeps the nearby equal highs and then shows signs of reversal, this could give us a fresh supply area to work from. Alternatively, if price moves lower, I’ll be looking at the 8-hour demand zone around 1.16000 for a possible long setup.
Confluences for EUR/USD:
- Although price has been slightly bullish, the current consolidation phase suggests a potential reversal could be on the horizon.
- Liquidity is building on both sides of the range, making a reaction from the monthly supply zone increasingly probable.
- There’s significant downside liquidity still untapped, such as Asia session lows, which could serve as short-term targets.
- For clearer confirmation, we still need a decisive break in market structure to the downside.
P.S. If price sweeps the lower liquidity and moves into the 8-hour demand zone near 1.16000, I will be watching for accumulation to form and signs of bullish intent from there.

EURUSD Bullish Setup: Watching for a Break and Retest📈 Looking at EURUSD right now, we’re in a strong bullish structure 🔼 — but it’s clearly overextended 🚀
As we head into the end of the week, there’s still potential for more upside today ⬆️ — but ⚠️ be cautious, since Fridays often bring retracements as we move into the weekly close 🕒📉
🔍 I’m watching for a bullish opportunity if we get a break above the current equal highs, followed by a retest and failure to break back below 🧠📊
If that setup doesn’t materialize, we’ll simply step aside and abandon the idea 🚫
💬 Not financial advice — always trade at your own risk.

Be careful with EURUSDEURUSD is holding its bullish trend and hovering around 1,1800.
Tomorrow, U.S. employment data is due.
It will be released on Thursday instead of Friday, as Friday is a holiday.
At the current levels, there’s no favorable risk-reward for new entries.
Watch for a pullback and wait for the right moment.

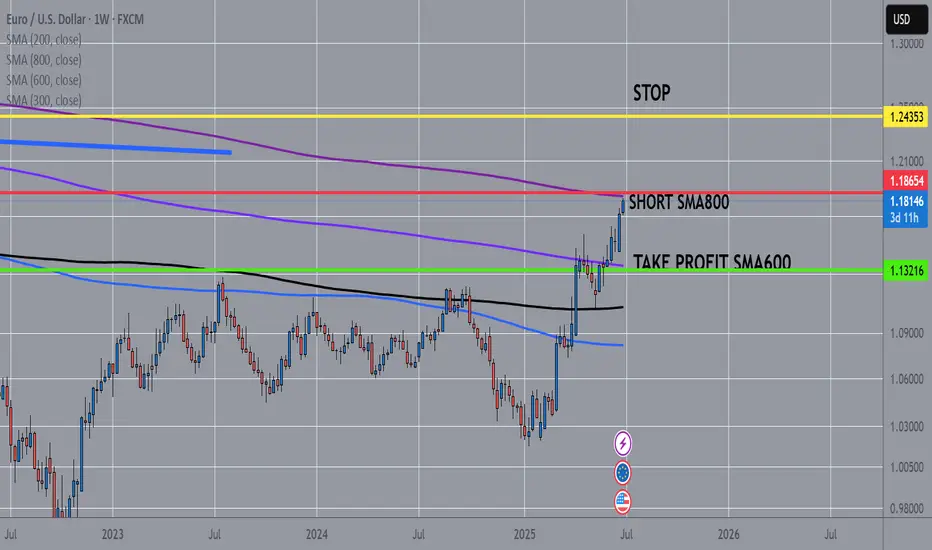
EURUSD Major event Short Weekly ChartWe may be on the verge of a major event in the forex market.
The EUR/USD is approaching its 800-week moving average, a level that historically marks significant turning points.
A sharp reversal is likely, with an initial target at the 600-week moving average, and potentially a much deeper decline beyond that.
EUR/USD Weekly – Two Long Setups Hello guys!
It is my perspective on eurusd!
Before we even reach the major resistance zone around 1.2050–1.2100, I’ve highlighted two long-term opportunities that may unfold as the price continues to climb.
✔ First Long Position:
It looks like a more conservative entry. The price is already above it. You can set a pending position!
It was likely aiming to catch the momentum as the price broke above the previous structure.
TP is near the descending trendline, around 1.2050–1.2100. a smart place to exit before major resistance hits.
✔ Second Long Position:
Positioned slightly lower. probably in case of a pullback or retest into the broken zone.
This one offers better risk-reward, but requires patience and a cleaner retracement.
Both longs are short-to mid-term swing ideas, aiming to ride the bullish leg into the bigger trendline rejection zone, where I’d personally be more cautious or even look for reversal setups.

New rise in EURUSDYesterday, EURUSD continued its bullish movement, reaching 1,1807.
At current levels, all open buy positions should have their risk removed (e.g. stop loss at breakeven).
New buy entries are recommended only after a pullback with a favorable risk-reward setup.
Important news is expected later this week, which may lead to misleading price moves.
Reduce your risk and stay patient!

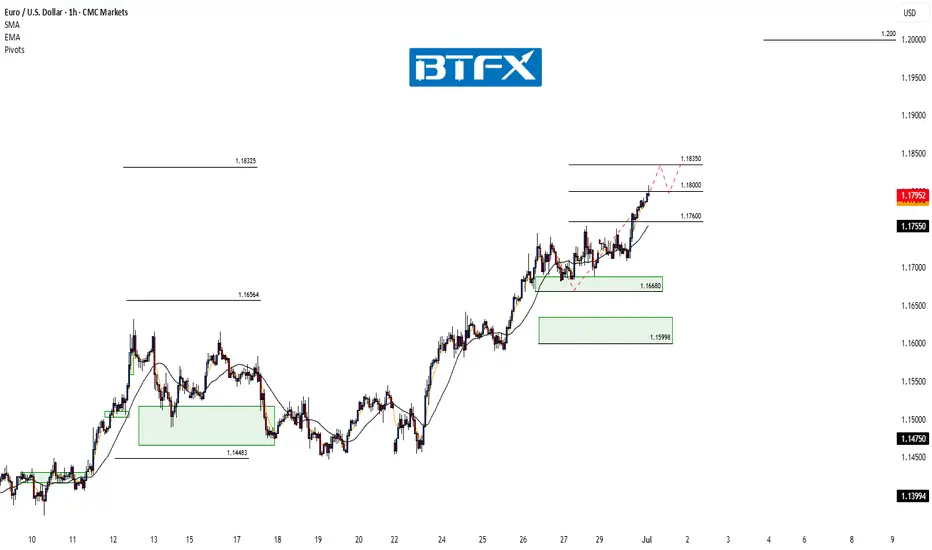
EUR/USD Extends Rally – Watching Resistance at 1.18000Hi Everyone,
We anticipated a retest of the 1.17400 level coming into this week, setting the stage for further upside toward our highlighted targets at 1.17600 and 1.18000. Monday delivered, with a sharp move higher that saw EUR/USD break cleanly above 1.17400 and extend to 1.17600, bringing the 1.18000 level into focus.
As previously noted, we expect dynamic resistance around the 1.18000 area and will provide further updates on the projected path for EUR/USD should price test or breach this level.
The longer-term outlook remains bullish, with expectations for the rally to extend towards the 1.2000 level, provided the price holds above the key support at 1.10649.
We will continue to update you throughout the week with how we’re managing our active ideas and positions. Thanks again for all the likes/boosts, comments and follows — we appreciate the support!
All the best for a good end to the week. Trade safe.
BluetonaFX
EUR/USD BULL RAID: Quick Profit Heist Before the Drop!🏴☠️ EUR/USD "The Fiber" HEIST ALERT: Bullish Loot Before the Trap! 🚨💰
🌟 Greetings, Market Pirates & Profit Raiders! 🌟
Hola! Oi! Bonjour! Hallo! Marhaba! 🤑
🔥 Thief Trading Strategy Activated! 🔥
Our bullish heist on EUR/USD is LIVE—time to swipe the loot before the bears set their trap! 🎯💸
📈 Entry (Vault is OPEN!):
Buy Limit Orders preferred (15M/30M swing levels).
Alert up! Don’t miss the breakout.
🛑 Stop Loss (Escape Route):
Nearest Swing Low (1.15200) on 30M TF.
Adjust for your risk & lot size—no reckless robberies!
🎯 Target (Profit Hideout): 1.16400
Scalpers: Stick to LONG only—trail your SL to lock gold!
Swing Traders: Ride the wave or split the haul.
⚡ Why This Heist?
Bullish momentum + weak bears = perfect robbery conditions.
Overbought? Yes. Risky? Absolutely. But thieves thrive in chaos!
📢 Pro Tip:
Avoid news spikes (volatility = jail time for unprepared traders).
Trailing SL = Your Getaway Car.
💥 BOOST THIS PLAN!
Hit 👍, share 🔄, and let’s drain this market together! More heists coming—stay tuned! 🚀🐱👤
(Disclaimer: Trade smart. We’re thieves, not gambleers.)

SNATCH & RUN: EUR/USD Long Setup (High-Risk Loot Zone)🔥 EUR/USD Heist: Bullish Loot Before the Trap! (Thief Trading Strategy) 🔥
🌟 Hi! Hola! Ola! Bonjour! Hallo! Marhaba! 🌟
Attention, Money Makers & Market Robbers! 🤑💰💸✈️
Based on the 🔥Thief Trading Style🔥, here’s our master plan to loot the EUR/USD "The Fiber" Forex Market! Follow the strategy on the chart—Long Entry is key. We’re targeting the high-risk Red Zone: overbought, consolidating, and primed for a reversal. Beware the trap—bulls must strike fast before bears ambush! 🏆💸
"Take the profit and treat yourself, trader. You deserve this heist!" 💪🎉
🚪 Entry Point (The Vault is Open!)
📈 "Swipe the bullish loot at any price—the heist is LIVE!"
Pro Tip: Use Buy Limit orders within a 15-30 min timeframe (recent swing low/high). ALERTS ARE A MUST!
🛑 Stop Loss (Escape Route)
Thief SL at nearest swing low (1.12500) on the 3H timeframe (Day/Swing trade).
Adjust based on your risk, lot size, and multiple orders.
🎯 Target (Loot & Scoot!)
🎯 1.17200 (or escape earlier if the cops show up!)
⚡ Scalpers’ Quick Grab
👀 Only scalp LONG!
Big wallets? Raid straight in.
Small stacks? Join swing traders for the robbery.
Use Trailing SL to protect your stolen cash! 💰
📢 Why This Heist? (EUR/USD Bullish Momentum)
"The Fiber" is heating up! Key drivers:
Fundamentals (COT Reports, Macro Data)
Sentiment & Intermarket Trends
Future Targets & Score Outlook
🔗 Want the full intel? Check our bio0 for linkks! 👉👉
⚠️ Trading Alert: News = Danger! 📰🚨
News releases = volatility spikes! Protect your loot:
❌ Avoid new trades during news.
🔒 Use Trailing SL to lock profits.
💖 Support the Heist Crew!
💥 Smash the Boost Button! 💥
More boosts = easier money steals!
Strengthen our robbery squad!
Every day is a heist—profit with Thief Trading Style! 🏆🚀
Stay tuned for the next robbery plan! 🤑🐱👤🤩

EURUSD is in a Downside DirectionHello Traders
In This Chart EURUSD HOURLY Forex Forecast By FOREX PLANET
today EURUSD analysis 👆
🟢This Chart includes_ (EURUSD market update)
🟢What is The Next Opportunity on EURUSD Market
🟢how to Enter to the Valid Entry With Assurance Profit
This CHART is For Trader's that Want to Improve Their Technical Analysis Skills and Their Trading By Understanding How To Analyze The Market Using Multiple Timeframes and Understanding The Bigger Picture on the Charts

EURUSDWe are expecting more strength in EURO after small correction towards 1.18 level.
Disclosure: We are part of Trade Nation's Influencer program and receive a monthly fee for using their TradingView charts in our analysis.

#EURUSD:Expecting A Strong Bull Move, Two Entries | Two TargetsIn our previous analysis, we clearly stated that the price would remain bullish as the DXY had to plummet, and it did exactly that, rising by 450 pips from our last entry. Currently, we have two areas from which we can see the price reversing. The first one is nearby and has a higher risk compared to our second entry, which may be safer for some traders. We need a strong confirmation before making any significant decisions.
Good luck and trade safely. We wish you the best in your trading journey.
Team Setupsfx_

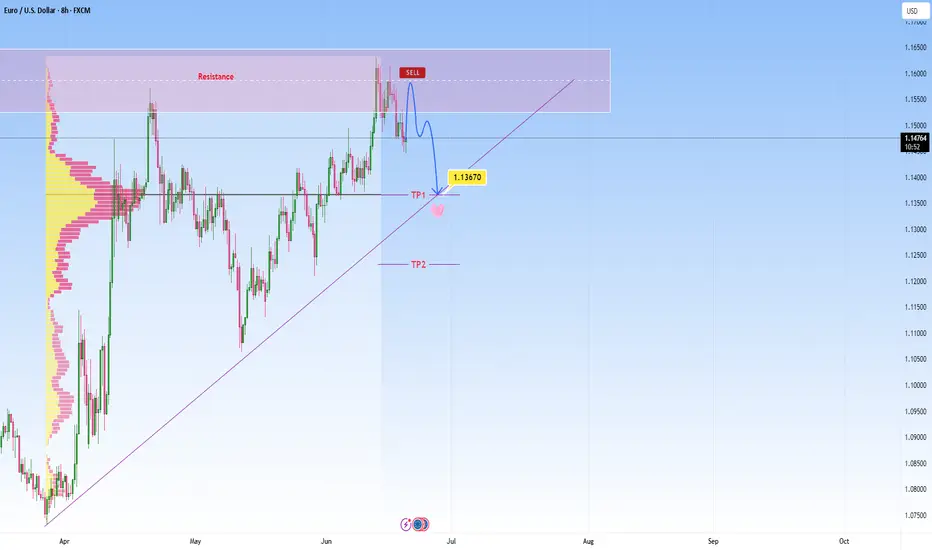
EURUSD heads towards resistance, short-term reversal expectedEURUSD has been in a strong uptrend, and we’re currently observing price action is reaching a notable resistance zone. I am watching for a reversal here as marked on my chart, not expecting a major move, but rather a short-term rejection with a downside target at around 1.13670 , which also aligns with the POC.
This is where it can become a decision point, either price finds support and bounces, or it breaks below, and that’s when we might see the move start to extend lower.
If we get a decisive breakdown through that ascending trendline, my next area of interest is marked as TP2. From there we can expect either potential accumulation or another reaction, depending on broader market sentiment at the time.
That said, we're navigating a complex backdrop currently:
The EU macro environment is under pressure, as weak economic data from Europe is contributing to cautious sentiment around the euro.
Meanwhile, a sustained USD bid continues, supported by stronger U.S. growth expectations, favorable yields, and persistent global demand. This further weighs on EURUSD.
Adding to the uncertainty, escalating tensions between Israel and Iran have rattled markets this week. This geopolitical risk could be pushing oil prices higher:
It’s important to note that if price convincingly rejects here and loses structure, especially with high volume and obvious bullish structure, this setup would become invalid. In that case, I would reassess and adapt