Eurusd Short-term bearish EUR/USD is showing bearish momentum, breaking below key support with lower highs forming. Selling pressure is increasing amid a stronger USD outlook, favoring a short position.
Eurusdprediction

EUR/USD Holds Above Support – Watching 1.17400 and BeyondHi Everyone,
As highlighted, a successful bounce from the near-term support at 1.16680 provided a retest of the 1.17400 zone. Looking ahead, we expect price action to revisit this level in the coming week.
A confirmed break above this resistance could open the path toward 1.18000, where we anticipate encountering dynamic resistance.
As outlined in our analysis last week, we anticipated a continued move higher toward the 1.16564 and 1.18325 levels, provided price held above 1.14483.
Price respected this level, and EUR/USD extended its rally, reaching our first key target at 1.16564 and pushing above 1.17400 — marking the highest level since February 2022.
We will provide further updates on the projected path for EUR/USD should price reach this level.
The longer-term outlook remains bullish, with expectations for the rally to extend toward the 1.2000 level, provided the price holds above the key support at 1.10649.
We will continue to update you throughout the week with how we’re managing our active ideas and positions. Thanks again for all the likes/boosts, comments and follows — we appreciate the support!
All the best for a good end to the week. Trade safe.
BluetonaFX

Elliott Wave Analysis for EUR/USD - Bullish OutlookPEPPERSTONE:EURUSD
This analysis is based on the application of Elliott Wave principles for the EUR/USD market on a weekly timeframe.
💡 Wave Identification:
Corrective Cycle (ABC): After a peak marked by wave B, the market completed a 5-wave downward structure (waves 1 to 5), forming wave C, signaling a possible end of the correction.
Potential Reversal Zone (2/B): The current point is a strategic level where a bullish rebound is anticipated.
📊 Projection:
A bullish impulse is expected from point C. The initial target lies in the 1.1140 - 1.1217 zone, corresponding to key resistance levels and Fibonacci projections.
🧠 Conclusion:
A breakout above 1.0440 could confirm a significant bullish impulse, suggesting buyers are regaining control.
⚠️ Disclaimer : This analysis is not financial advice. Always conduct your own research before investing.

EURUSD ( AB Algorithm Setup) 30.06.2025 - 04.07.2025 While everyone is waiting for a pullback or a downward correction, or expecting this aggressive trend to break and lead to a sharp drop, the market will continue to rise. Because a trend is sustained by those who don't believe in it

EUR/USD Short Idea Analysis EUR/USD exhibits bearish potential on the daily timeframe, with the 1.17160–1.18070 zone acting as a key resistance area for a short setup.
Technical Analysis:
Price Action: Price is testing the 1.17160–1.18070 resistance zone, which aligns with prior highs and a rejection area. A bearish reversal pattern (e.g., shooting star or engulfing) could confirm the short.
Support/Target: Initial support at 1.1600, with a deeper target at 1.1500 if selling pressure accelerates.
Indicators: RSI is nearing overbought levels (above 65), suggesting a potential reversal. MACD shows weakening bullish momentum, supporting a bearish bias.
Fibonacci: The 1.17160–1.18070 zone aligns with the 78.6% Fibonacci retracement of the prior downmove, reinforcing resistance.
Risks: A break above 1.1820 could invalidate the setup. Watch for ECB policy updates or unexpected US data shifts.
Conclusion: The 1.17160–1.18070 resistance zone offers a compelling short opportunity for EUR/USD, backed by technical and fundamental factors. Use tight risk management due to potential volatility.

EUR/USD Rally Continues – 1.18000 in SightHi Everyone,
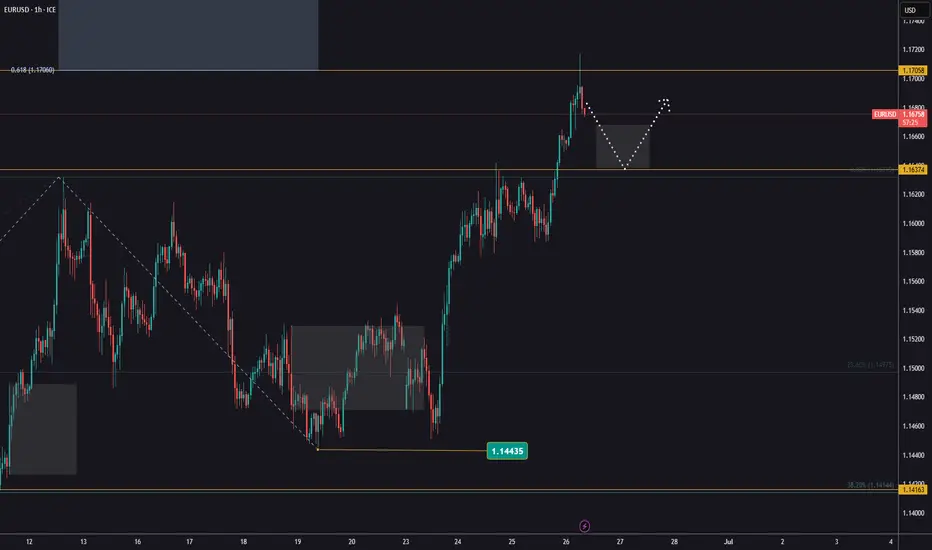
As outlined in our analysis last week, we anticipated a continued move higher toward the 1.16564 and 1.18325 levels, provided price held above 1.14483.
Price respected this level, and EUR/USD extended its rally, reaching our first key target at 1.16564 and pushing above 1.17400 — marking the highest level since February 2022.
A successful bounce from above 1.16680 or slightly lower at 1.15998 would offer near-term support for a potential retest of the 1.17400 zone. A confirmed break above this resistance could pave the way for a move toward 1.18000, where we anticipate encountering dynamic resistance.
We will provide further updates on the projected path for EUR/USD should price reach this level.
The longer-term outlook remains bullish, with expectations for the rally to extend toward the 1.2000 level, provided the price holds above the key support at 1.10649.
We will continue to update you throughout the week with how we’re managing our active ideas and positions. Thanks again for all the likes/boosts, comments and follows — we appreciate the support!
All the best for a good end to the week. Trade safe.
BluetonaFX

eurusd updateentry price 1.1329
stop loss update 1.133
take profit
1.153
1.165
1.177
1.194
result we hit first two target

Overextended Rally into Resistance ZoneEUR/USD has pushed into the upper boundary of the Keltner Channel on the 4H timeframe, indicating a potential exhaustion of bullish momentum. Price is showing signs of overextension with Heikin Ashi candles losing strength near a key resistance zone.
📉 Short Position Setup:
Entry: 1.17220 (near upper Keltner resistance)
SL: 1.17581 (above recent highs and volatility buffer)
TP: 1.15220 (targeting mid-channel and previous structure support)
🔻 Bearish Confluence:
Price rejecting upper Keltner band
Potential for mean reversion after strong rally
Weakening bullish momentum in candle structure
Confirmation with further bearish price action or divergence signals would strengthen the case for downside continuation.

Shorting Optimism: EUR/USD Rally vs RealityAfter the spike to 1.1640 driven by temporary ceasefire news and USD weakness, I’ve taken a short position on EUR/USD. The market priced in too much optimism too fast, and I see limited upside beyond this zone in the current macro landscape. I’m positioned for a controlled retracement back toward the 1.1460–1.1520 region.
The play? Fade the overextension, follow structure, and manage from strength.
Technicals:
• The pair ran into a strong supply zone near 1.1640, which aligns with a previous liquidity sweep.
• Momentum has slowed visibly on lower timeframes, with candles rejecting highs and wicks printing upper tails.
• Daily and 4H SMAs are overstretched. The 20 SMA on H4 is accelerating upward, but RSI is near overbought and flattening.
• My short entry was taken with a stop above 1.1745 and first target at 1.1540, second at 1.1500.
• A potential retest of the 1.1660 zone could offer additional entries if invalidation remains intact.
Fundamentals:
• ECB vs Fed Divergence: The Fed holds firm on rates amid sticky inflation, while the ECB is under pressure to ease further due to weak growth.
• EU Struggles: PMI data remains in contraction territory; HICP cooling to 1.7% YoY suggests little reason for tightening.
• Political Instability: Germany and France both facing internal political crises — risk premia rising.
• Ceasefire Priced In: EUR rally on Middle East headlines lacks depth — conflict paused, not resolved.
• USD Resilience: Weak recent data aside, the USD remains a safe haven. Fed’s Powell reiterated that cuts aren’t imminent.
⚠️ Bias: Bearish as long as price trades below 1.1640. Watching how the market reacts to Fed testimony and ECB rhetoric this week.
🧠 Reminder: Don’t get emotional after vertical rallies. When everyone gets excited, I look for exhaustion. That’s where trades begin.
Note: Please remember to adjust this trade idea according to your individual trading conditions, including position size, broker-specific price variations, and any relevant external factors. Every trader’s situation is unique, so it’s crucial to tailor your approach to your own risk tolerance and market environment.

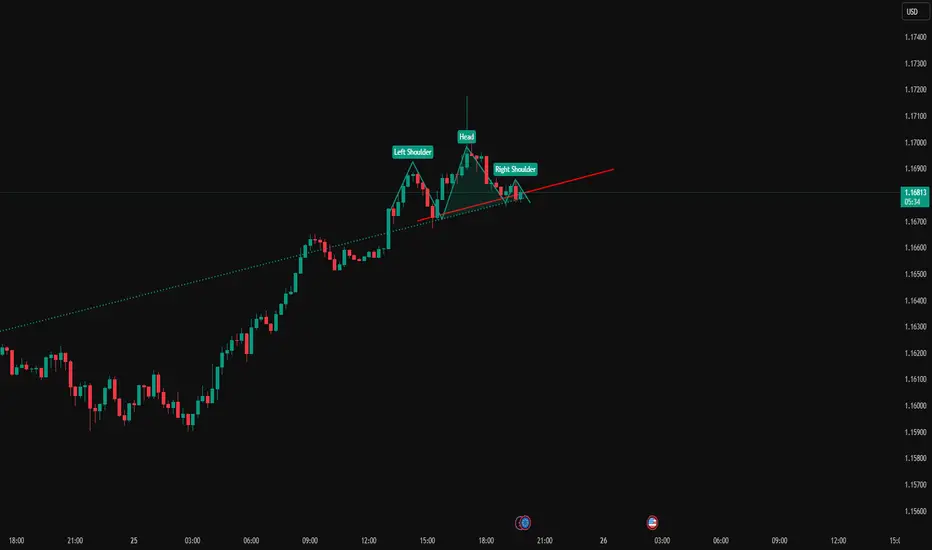
EURUSD Head And ShouldersEURUSD has created a normal head and shoulders pattern while reaching a HTF resistance on the weekly/daily. I expect this pattern to be a catalyst to a bearish movement.
Target achievedThe impulsive rise in EURUSD continues.
This morning, it reached 1,1717 — our first projected target.
This is a good level to take profits.
Now, watch for a pullback and the potential for another move up.
Most of the move should already be captured by this point.
Reduce your risk and avoid using large position sizes.
If the price moves higher again, the next target is 1,1778!
EURUSDThis levels is for reactions to support and resistace.
Price can now in Bull-trend if keep 1.145$ in sypport and breaked trendline.
⚠️Control risk management for positions.

EURUSD Trading Strategy for the WeekEURUSD is reacting at the support zone of 1.14500. This is an important support zone that helps EURUSD continue to maintain its upward momentum. The uptrend in the h4 time frame is still strong and heading towards the peak of 1.161.
Below the support of 1.145 will be the 1.138 zone. When this 1.138 zone is broken, it confirms that a Downtrend is established. The possibility of breaking this zone is not high, so it is still possible to set BUY signals around these support zones. On the other hand, 1.153 is an important resistance zone in the near future where the pair will have a price reaction before finding the peak of last week.
Support: 1.13800
Resistance: 1.16000
Break out: 1.14600-1.15300
Recommended good trading strategy:
Trade when price confirms in Break out zone.
BUY 1.13800-1.13600 Stoploss 1.13300
SELL 1.16000-1.16200 Stoploss 1.16500

EURUSD Trade Plan: Retracement Into Key Fibo Zone POI.I’m currently watching EURUSD closely 👀. On the daily timeframe, it’s clearly broken structure and is now in a bullish trend 📈. Dropping down to the lower timeframes 🕒, price appears overextended and is now trading into a previous resistance level 🚧.
I’m anticipating a retracement into equilibrium — specifically the 50% level of the current swing, and ideally into the 50–61.8% Fibonacci retracement zone 🔁. If price pulls back into that range, I’ll be watching for a bullish market structure shift 🔄. I don’t want to see it push below the bullish imbalance 📉—I want that zone to hold as support so price can continue north 🔼.
If this plays out, my ideal entry would be around the imbalance and the 50% Fib level, with a stop loss just below the imbalance, and targets set at the current swing high and previous swing high, as detailed in the video 🎯.
⚠️ Disclaimer
This is not financial advice. Trading involves risk and you should only trade with capital you can afford to lose. Please do your own analysis or consult a licensed financial advisor.

EURUSD Advanced Price Action PatternEURUSD is forming a price action pattern on the 5 minute timeframe, this pattern usually results in a breakout. I am thinking this breakout will be bullish and result in creating a top wick for the daily candle.

EURUSD H4 AnalysisEURUSD Showing a bullish Flag. If it breaks this zone above, Most probably can fly up to 1.15818 and higher to 1.16322. If no, Can rally between 1.14320, 1.13067 or even lower. Trading Analysis from 23-06-25 to 27-06-25. Take your risk under control and wait for market to break support or resistance on smaller time frame. Best of luck everyone and happy trading.🤗

EURUSDEURUSD have one more down and then go back up if geopolitical situation calms down.
Disclosure: We are part of Trade Nation's Influencer program and receive a monthly fee for using their TradingView charts in our analysis.

EURUSD POSSIBLE TRADE SETUP💶 Potential Trade Setup on EURUSD
Overview:
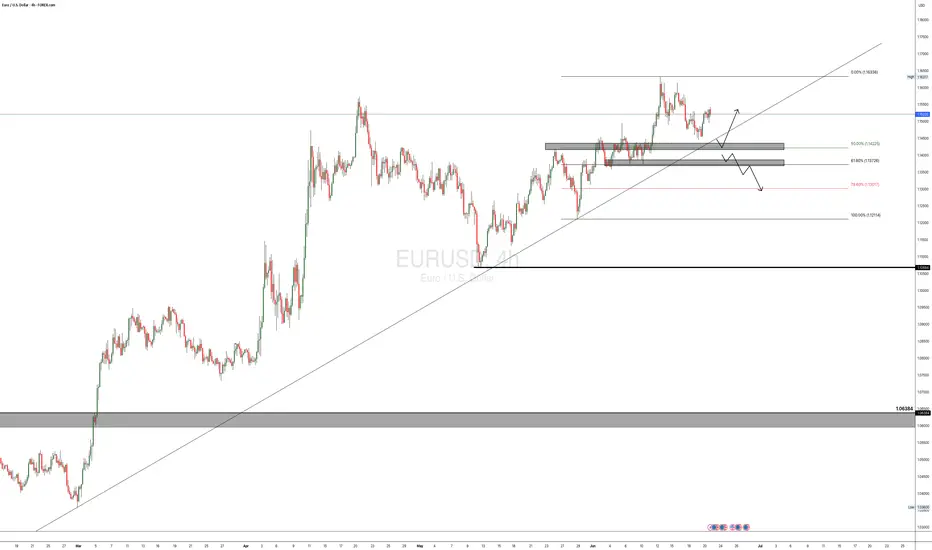
Since March, EURUSD has shown consistent bullish momentum, especially after breaking through the key 1.0600 supply zone.
The pair has maintained higher highs and higher lows, suggesting continued strength in the medium term.
That said, I am still quite anticipating for a possible continuation of the bullish momentum that started a long time ago, and moving forward, I will anticipate for a clear retest of the 50% fib at the 1.1425 region, then I go in for the kill.
Alternatively, there is a clear short opportunity, provided that, the bullish trendline is broken and the 1.1370 region is broken to the downside, this is a bit far a stretch, but it is in play. "IF" the DXY keeps the bullish momentum going.
🧭 Trading Plan:
✅ BUY Bias (Primary Plan):
Look for a retest of the 50% Fibonacci retracement zone around 1.1425. This aligns with the ongoing momentum on the 4H timeframe.
🔻 SELL Bias (Alternative Scenario):
If price breaks the bullish trendline and the 1.1370 support zone, a short opportunity opens up.
This is only valid if DXY continues to strengthen, shifting sentiment.
🎯 Targets & Risk Management: Targeting 1:2 R:R on both setups.
Ensure entries are backed by price action signals and confluences.
EURUSD Gearing Up for Next Leg Up – DXY Weakens After PPI MissToday, key U.S. economic indexes were released, providing fresh insights into inflationary pressures and the state of the labor market:
Core PPI m/m:
Actual: 0.1% | Forecast: 0.3% | Previous: -0.4%
Lower than expected – suggests weaker underlying producer inflation.
PPI m/m:
Actual: 0.1% | Forecast: 0.2% | Previous: -0.5%
Slight miss – overall inflation at the producer level remains soft.
Unemployment Claims:
Actual: 248K | Forecast: 242K | Previous: 247K
Slightly higher than forecast – signaling some cooling in the labor market.
Market Outlook :
These data releases point toward cooling inflation and softness in job growth, which may strengthen the dovish narrative around the Fed’s next move.
DXY Index ( TVC:DXY ) is under pressure, and EURUSD ( FX:EURUSD ) is showing signs of bullish momentum .
-----------------------------------------------------------
Now let's take a look at the EURUSD chart on the 1-hour time frame .
EURUSD is trading near the Heavy Resistance zone($1.182-$1.160) and Monthly Resistance(2) .
In terms of Elliott Wave theory , EURUSD appears to be completing microwave 4 . Microwave 4 could be completed at one of the Fibonacci levels .
I expect EURUSD to attack the Heavy Resistance zone($1.182-$1.160) at least once more after completing microwave 4 and could even rise to the Potential Reversal Zone(PRZ) .
Note: If EURUSD touches $1.1446 , we can expect more dump.
Please respect each other's ideas and express them politely if you agree or disagree.
Euro/U.S. Dollar Analyze (EURUSD), 1-hour time frame.
Be sure to follow the updated ideas.
Do not forget to put a Stop loss for your positions (For every position you want to open).
Please follow your strategy and updates; this is just my Idea, and I will gladly see your ideas in this post.
Please do not forget the ✅' like '✅ button 🙏😊 & Share it with your friends; thanks, and Trade safe.

Chartanalyse: Der Chart zeigt eine Seitwärtskonsolidierung mitTechnical Overview:
The EUR/USD chart exhibits signs of a bearish reversal pattern forming near a key resistance zone (1.15800 - 1.16000), highlighted with repeated rejection wicks (🔴 red arrows). Price is currently trading at 1.15222, after failing to hold above the neckline of the rounded bottom pattern.
🔍 Key Observations:
🔺 Resistance Zone: Strong resistance has been confirmed multiple times (red arrows), indicating sellers are active at the top.
🟠 Double Top / Head & Shoulders Behavior: Price action shows topping formations (highlighted with orange circles), suggesting exhaustion of bullish momentum.
📉 Bearish Breakdown Possibility:
Price rejected near neckline and is showing bearish candle formations.
Breakdown from the current consolidation zone could push price toward the target zone at 1.14491, marked in purple.
This aligns with previous support structure, reinforcing a technical downside projection.
🔻 Support Zone: Around 1.13800 - 1.14000 is a strong area of demand and may act as the next bounce point if the bearish move continues.
📐 Chart Pattern Structure:
Rounded bottom formed earlier, but the failure to continue higher and breakout suggests a false breakout trap for buyers.
Downward sloping trendline broke, but now price is struggling to sustain above previous highs.
📌 Conclusion:
⚠️ Caution for bulls as price shows signs of weakness at resistance. A move below 1.15000 may initiate further downside toward 1.14491 and possibly lower. Short-term traders can watch for confirmation candles near this zone for entries.
📅 Short-Term Bias: Bearish
🎯 Target: 1.14491
⛔️ Invalidation: Strong breakout above 1.16000

EUR/USD - H4 - Triangle Formation (31.05.2025)The EUR/USD pair on the H4 timeframe presents a recent Formation of a Triangle Pattern.
1. Wait for Breakout with Good Volume
2. Conformation in short Timeframe Must
🎁 Please hit the like button and
🎁 Leave a comment to support for My Post !
Fundamental Updates :
Dollar mixed on tariff uncertainty, U.S. President Donald Trump to battle a U.S. trade court ruling that blocked most of his proposed tariffs.
Your likes and comments are incredibly motivating and will encourage me to share more analysis with you.
Best Regards, KABHI_TA_TRADING
Thank you.
Disclosure: I am part of Trade Nation's Influencer program and receive a monthly fee for using their TradingView charts in my analysis.

EUR/USD Bullish Reversal Breakout Pattern Technical Analysis Summary:
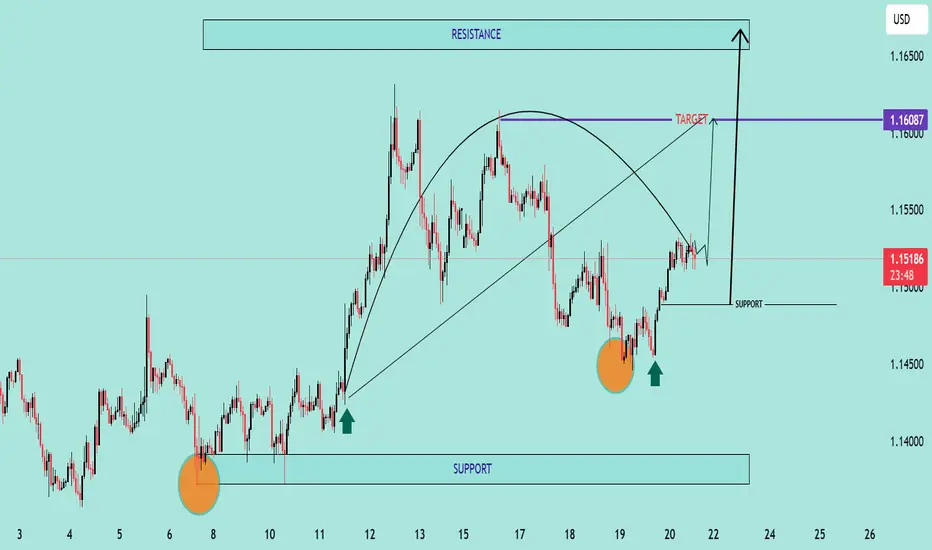
The chart illustrates a strong bullish reversal pattern forming on the EUR/USD pair:
🔹 Double Bottom Formation (🔶🔶):
Two clear bottom zones are marked with orange circles near the 1.14400–1.14500 area, indicating strong buying interest and support.
The second bottom confirms the double bottom pattern, often a precursor to an upward trend.
🔹 Support Zone (📉):
Firm support around 1.14450, as highlighted on the chart.
Price has respected this zone twice, bouncing back with bullish momentum each time.
🔹 Neckline Breakout (🔼):
Price is approaching the neckline zone at 1.16087, which acts as the bullish target.
A break and close above this neckline will confirm the reversal and open the way toward the resistance zone around 1.16500.
🔹 Projected Move (🎯):
If the neckline breaks, price is expected to surge towards 1.16500, aligning with the historical resistance.
This move completes the measured target projection from the double bottom structure.
🔹 Bullish Structure:
Higher lows and strong bullish candles are reinforcing the uptrend momentum.
Curved trajectory shows accumulation followed by a breakout phase.
📌 Key Levels to Watch:
Support: 1.14450 – 1.14500
Neckline/Target: 1.16087
Resistance: 1.16500
🛑 Invalidation:
A strong breakdown below support (1.14450) would invalidate this bullish setup.
EURUSD Breaks Structure: Bullish Continuation Opportunity💶 EUR/USD Analysis – Bullish Momentum Builds 📈
Taking a look at the EUR/USD on the daily chart, it’s clear the pair is currently in a strong bullish trend 🚀. Momentum has been building consistently, reflecting underlying euro strength and continued USD weakness.
🕓 On the 4H timeframe, we’ve now seen a clear shift in market structure to the upside, confirming bullish intent. Look for a continuation entry after a retracement back into equilibrium — ideally around the 50% level of the current price swing 🔄📐.
🎯 Trade Plan Idea:
Wait for price to pull back into equilibrium 🌀
Entry: Long from the discounted zone 🟩
Stop loss: Just below the recent swing low 🔻
Target: Previous high as a logical take-profit zone 🎯📊
⚠️ Disclaimer:
This content is for educational and informational purposes only and should not be considered financial advice. Always do your own research and consult with a qualified financial advisor before making any trading decisions. 📚💼
