EURUSD Back to 8H Support ZoneFollowing the bullish breakout of the trendline on the 4-hour timeframe and the subsequent pullback to the mentioned level, along with confirmations on lower timeframes, we expect the price to retrace toward the 8-hour support zone to gather momentum for a potential continuation of the upward trend.
While a precise touch of the support level is not guaranteed, based on the current setup, it remains a likely scenario.
A possible entry zone could be around the highlighted orange area. Based on this setup, I anticipate a potential drop of approximately 4% in EUR/USD, targeting the 1.095 level.
Disclaimer: You are responsible for your own trades. Do not risk more than 2% of your account on a single setup.
Eurusdprediction

EURUSD Update – Exceptional Long Entry As mentioned in our previous post, we were waiting for price to react from one of the key demand zones:
🔹 1.12250 – 1.12500
🔹 1.1190 – 1.12060
✅ We entered a long position on the 3-minute timeframe after getting a personal confirmation trigger.
The result? An exceptional entry with a minimum of 100 pips profit so far.
📍 Now it's time to secure profits and wait for the next structure to form.
We’ve been patiently waiting all week for price to hit this area – and it played out perfectly.
Great execution! ✅
Keep in touch!
EURUSD Long Setup Brewing – Here's My Trade Plan!Keeping an eye 👀 on EURUSD – price has just broken market structure 📈 to the upside, and we're seeing clear higher highs 🔼 and higher lows 🔽 forming on the 4H timeframe 🕓.
Price has now rallied into a premium zone 💰, and i'm watching for a retracement 🔁 into my Fibonacci 61.8% 📐✨ point of interest for a potential long entry 🟢.
✅ Entry criteria?
Wait for price to pull back ⬅️ and then give us a break of market structure again 💥.
I'll be looking for confirmations on the 30min or 15min ⏱️ timeframes.
🚫 Not financial advice ✌️

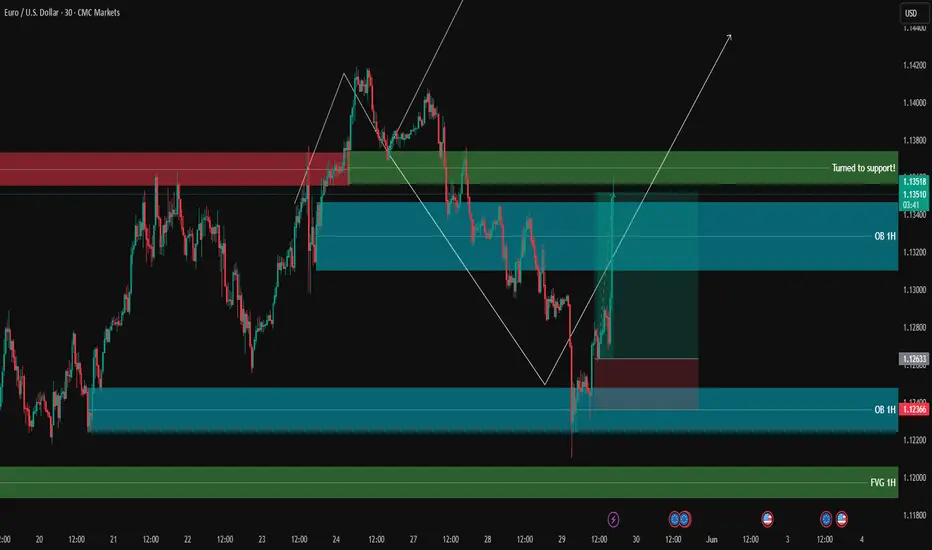
FROM THE HIGHS ! - EURUSD SHORT FORECAST Q2 W23 D2 Y25EURUSD SHORT FORECAST Q2 W23 D2 Y25
🔥👀QUICK SCOPE TECHNICAL REVERSAL HOT PICK
Professional Risk Managers👋
Welcome back to another FRGNT chart update📈
Diving into some Forex setups using predominantly higher time frame order blocks alongside confirmation breaks of structure.
Let’s see what price action is telling us today!
💡Here are some trade confluences📝
✅1 hour order block
✅15' order block
✅Intraday bearish breaks of structure
✅Tokyo ranges to be filled
🔑 Remember, to participate in trading comes always with a degree of risk, therefore as professional risk managers it remains vital that we stick to our risk management plan as well as our trading strategies.
📈The rest, we leave to the balance of probabilities.
💡Fail to plan. Plan to fail.
🏆It has always been that simple.
❤️Good luck with your trading journey, I shall see you at the very top.
🎯Trade consistent, FRGNT X

EURUSD Forms Rising Wedge + Evening Star_ Bearish SetupAs I expected in the previous idea , the EURUSD ( FX:EURUSD ) started to rise after breaking the upper line of the descending channel and hit the Long Position target with Risk-To-Reward: 1.46 .
The EURUSD is trading near the Resistance zone($1.149-$1.142) .
From a Classic Technical perspective, EURUSD appears to be completing a Rising Wedge Reversal Pattern . Also, a good sign for a EURUSD reversal is the formation of an Evening Star Candlestick Pattern near the upper line of the rising wedge pattern.
Also, we can see the Regular Divergence(RD-) between Consecutive Peaks .
In terms of Elliott Wave theory , I think the EURUSD corrective waves are NOT over yet, and it seems that EURUSD has completed the main wave X inside the rising wedge pattern.
I expect EURUSD to decline to at least $1.126 AFTER breaking the lower line of the wedge pattern.
Note: If EURUSD touches $1.14903 , we can expect more pump.
Please respect each other's ideas and express them politely if you agree or disagree.
Euro/U.S. Dollar Analyze (EURUSD), 4-hour time frame.
Be sure to follow the updated ideas.
Do not forget to put a Stop loss for your positions (For every position you want to open).
Please follow your strategy and updates; this is just my Idea, and I will gladly see your ideas in this post.
Please do not forget the ✅' like '✅ button 🙏😊 & Share it with your friends; thanks, and Trade safe.

EUR/USD Update: Bullish Outlook Towards 1.14190 and BeyondHi Everyone,
As we projected in our analysis last week, EUR/USD corrected throughout the week and approached a retest of the 1.12000 level.
We expect the price to potentially retest 1.12000 and confirm it as support before advancing further to challenge the May 26 high of 1.14190. This would further reinforce our outlook for a potential long-term bullish trend.
Of course, the price could also challenge the 1.14190 high without a second retracement, should there be strong buying pressure early in the week. A successful breach of this level would likely drive the price higher towards the 1.15240 level.
We will provide further updates on the expected path for EUR/USD should the price reach this target.
The longer-term outlook remains bullish, with expectations for the rally to extend toward the 1.2000 level, provided the price holds above the key support at 1.10649.
We will continue to update you throughout the week with how we’re managing our active ideas and positions. Thanks again for all the likes/boosts, comments and follows — we appreciate the support!
All the best for the week ahead. Trade safe.
BluetonaFX

Story behind EURUSD chart and US10Y and DE10Y risk premiumLet’s have a look at the Currency and Bond markets today after an eventful last few weeks in both markets. After Moody’s downgrade of the US Gov bonds the markets look seemingly quiet. There has been no sudden spike in the US10Y. But it makes lot of sense to look beneath the hood and compare the Bond and the currency markets. Today we are looking into the 2 largest currency pairs, i.e. FX:EURUSD and the largest bond markets i.e. US10Y and German 10Y.
It is astounding to observe how the Fib retracement levels from the peak and troughs in the FX:EURUSD and TVC:US10 - TVC:DE10Y charts coincide. Both indicators at @ 0.618 Fib levels. As anyone would expect when the FX:EURUSD makes new highs the diff between TVC:US10Y and TVC:DE10Y hits new highs as investors long the FX:EURUSD chart and in that way hedge the risk in the TVC:US10Y without going short TVC:US10Y which will then adversely affect the investors portfolio. Institutional investors have been unwinding the long position in the TVC:US10Y by going long EUR, YEN and CHF in the currency markets without explicitly selling the US10Y.
Going back to the charts, what can we expect in the medium to long term? In my expectation both the charts can reach 0.786 Fib level and subsequently the 1.0 Levels. This will take the FX:EURUSD from 1.13 to 1.18 by the end of 2025 and then to our long-term target of 1.25. If those levels hold onto in the currency markets, then the risk premium of TVC:US10Y over TVC:DE10Y which is denoted in the chart by TVC:US10Y - TVC:DE10Y will go from 1.9% to 2.1% and then top out at 2.3%. May be this is the way USD will lose some of its market share as world reserve currency status.
Verdict: USD Reserve currency status weakening. Buoyant FX:EURUSD marching towards 1.25. TVC:US10Y - TVC:DE10Y can reach 2.3%.

EUR/USD4H Bearish Trade Setup Supply Zone Rejection with 3:1 RRR🔷 Trend Overview
📈 Price was in a rising channel (trend line + support line).
❌ Channel broken on downside → potential trend reversal.
🟧 🔼 Supply Zone (Sell Area)
📍 Zone: 1.13707 – 1.14432
🟠 Price faced rejection here.
💡 Institutional selling likely in this zone.
🔥 This is the ideal short-entry area.
🟦 🔽 Entry Point
🎯 Entry: Around 1.13694
🧩 Sits just below supply zone = safer trigger.
✅ Wait for a bearish confirmation candle before entering.
🟨 Support Level
📉 Support Zone: ~1.13100 – 1.13400
📊 Recently broken with a strong bearish candle.
🧱 Used to act as a floor, now may act as resistance.
🟩 🎯 Target Point
✅ Take Profit: 1.10970
📎 Matches previous structure support.
💰 Lock in profits before the psychological level at 1.1100.
🟥 ⛔ Stop Loss
❌ Stop: 1.14419
📏 Placed above the supply zone for protection.
🛡️ Shields from false breakouts or spikes.
⚖️ Risk-to-Reward Ratio (RRR)
💡 Approx. 3:1 ✅
📉 Risk: ~70 pips
📈 Reward: ~270 pips
🔥 High-probability setup
📌 EMA (Exponential Moving Average – 70)
📍 EMA 70 at 1.13102
🔻 Price is below the EMA → favors bearish momentum
🧠 Pro Tips:
🔍 Watch for bearish engulfing or rejection candles at the entry zone.
🗓️ Be aware of major news events (ECB, Fed).
🧮 Adjust lot size for risk management (based on SL size).
✅ Summary:
🧩 Element 📊 Value
Trade Type 🔻 Short (Sell)
Entry Point 📌 1.13694
Stop Loss ⛔ 1.14419
Take Profit 🎯 1.10970
RRR ⚖️ ~3:1
Sentiment 📉 Bearish

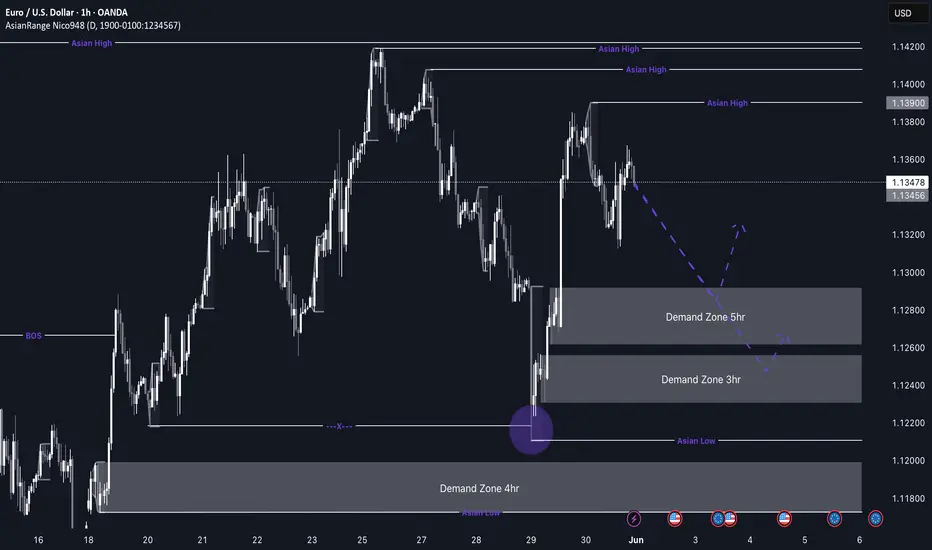
EUR/USD Potential longs to the upsideEU Weekly Outlook — Bullish Pro-Trend Setup in Focus
This week, my EU analysis is centered around the pro-trend movement to the upside. Price has recently broken structure and in doing so, has left behind clean demand zones on the 5H and 3H timeframes. I’ll be watching closely to see when price decides to mitigate these levels for a potential long setup.
Since price is still a bit far from these zones, short-term sells may be possible, but with no strong nearby supply, I’ll be staying patient and letting price action guide me. The key is to avoid marrying any one bias and remain adaptable.
Confluences for EU Buys:
- Strong bullish structure on higher timeframes
- Clean and unmitigated 5H and 3H demand zones
- Plenty of liquidity above, including Asia highs
- This is a pro-trend trade, aligning with market flow
- DXY analysis supports a bullish EU outlook
P.S. If price shifts and breaks structure to the downside, then we could consider short-term sell setups — but for now, I’m focused on the long opportunity forming from demand.
Have a great trading week and stay sharp! 🧠💹
EURUSD SELL / RANGETargets @ 1.12 (TP) - 1.5bn @ 1.150 (Last Entries) - 1.4bn @ 1.12 aswell - Waiting for a Reversal and Structure Breaks / Volume to activate potential Orders

Bullish Breakout in EUR/USD: Key Levels to Watch This WeekHi everyone,
EUR/USD had a strong week, climbing higher from the May 12 low and further reinforcing our view of a potential long-term bullish trend.
We anticipate further upside towards the 1.13768–1.13940 zone, followed by a possible pullback toward the 1.1200 area. We’ll share more updates on the expected path for EUR/USD if and when price reaches that zone.
The longer-term outlook remains bullish, and we expect the rally to extend towards the 1.2000 level, as long as price holds above the 1.10649 support.
We’ll be keeping you updated throughout the week with how we’re managing our active ideas. Thanks again for all the likes/boosts, comments and follows — we appreciate the support!
All the best for the week ahead. Trade safe.
BluetonaFX

EURUSD is Ready for a Bullish MoveHello Traders
In This Chart EURUSD HOURLY Forex Forecast By FOREX PLANET
today EURUSD analysis 👆
🟢This Chart includes_ (EURUSD market update)
🟢What is The Next Opportunity on EURUSD Market
🟢how to Enter to the Valid Entry With Assurance Profit
This CHART is For Trader's that Want to Improve Their Technical Analysis Skills and Their Trading By Understanding How To Analyze The Market Using Multiple Timeframes and Understanding The Bigger Picture on the Charts

EURUSD - Expecting Bearish Continuation In The Short TermM15 - Clean bearish trend with the price creating series of lower highs, lower lows.
No opposite signs.
Expecting further continuation lower until the two Fibonacci resistance zones hold.
If you enjoy this idea, don’t forget to LIKE 👍, FOLLOW ✅, SHARE 🙌, and COMMENT ✍! Drop your thoughts and charts below to keep the discussion going. Your support helps keep this content free and reach more people! 🚀
--------------------------------------------------------------------------------------------------------------------
Disclosure: I am part of Trade Nation's Influencer program and receive a monthly fee for using their TradingView charts in my analysis.

EURUSD Reaches Key Resistance – Reversal or BreakoutEURUSD has rallied back to the 1.1382 resistance level, a zone where price previously rejected multiple times. Current structure suggests price is approaching a decision point, where it may either:
Form a double top or head-and-shoulders reversal
Or break out toward 1.1573, the next major resistance
Key Levels:
Resistance: 1.13825 → Critical decision zone
Support: 1.11442 → First major downside target
Deep Support: 1.10846 → Recent low
Scenarios to Watch:
🔹 Bearish Case (Primary Setup)
Price fails to break above 1.1382
Reversal candlestick forms below resistance
Breakdown may target:
1.1144 (first support)
1.1084 (continuation target)
🔹 Bullish Case (Less Likely Unless Confirmed)
Break and close above 1.1382
Bullish continuation to 1.1573
Would signal shift in medium-term trend bias
Chart Pattern Notes:
Price has made multiple lower highs, but also held structure
A triple top or reversal setup is forming unless bulls break decisively
Bearish wedge and neckline structures from past price action support downside risk
Fundamental Watch:
USD volatility from Fed speakers, PMI data
Eurozone risk sentiment and ECB inflation comments
Correlation with DXY (which is near support)
Conclusion:
📌 Rejection at 1.1382 likely leads to downside toward 1.1144
📌 Break above 1.1382 invalidates bearish setup and targets 1.1573
Wait for confirmation candle or momentum before execution.

EUR USD Entry Setup EUR USD has formed a bullish break and retest and has also retraced back to the 50-618 FIB retracement level.
The trend is bullish so we will continue to look for buying opportunities

EURUSD - SHORT PREDICTION - MONDAY, 26TH MAY 2025A pullback appears to be underway, following a sweep of inducement around the 15-minute level at 1.13900—marking our first significant Change of Character (CHoCH). This shift aligns with the broader narrative from the 1-hour timeframe, suggesting the potential for a deeper retracement into the extreme 1H order block.
With the current price trading around 1.13777, we anticipate a move back up to the 1.14078 level. This area is of interest for initiating short positions, in line with the ongoing correction.
Our first take-profit target is set at 1.13368, where we expect an initial reaction. Should bearish momentum continue, we foresee price extending lower to sweep the previous daily low at 1.12771 and potentially tapping into the daily external order block at 1.12664.
From there, we’ll closely monitor price behavior. If bullish intent begins to form, we’ll assess the potential for long setups targeting a move back toward the weekly high at 1.14190.

EURUSD H4 Chart Outlook for Shorter Term 26-30 May 25You are seeing EURUSD H4 Chart, Right EURUSD is standing in mid-term Bullish Trend with Bullish Channel
Kindly follow the Zones Accordingly and always place SL
Disclaimer: Forex is Risky

EURUSD Direction | Daily Timeframe OutlookThese are the points we can take from the daily time frame :
1.EURUSD has broken through quite strong resistance, and we have not seen any wicks on any time frame, this indicates that EURUSD is still strong for buying
2.After finishing its uptrend, Eurusd fell to the weekly support that I marked,
3.After completing the correction phase, this week there was a fairly strong closing in the market structure shift (MSS) area
4.The conclusion is, eurusd will continue its upward trend, this is useful for daily traders as a direction to determine which trading positions are profitable

EUR/USD pro trend idea from 1.13000EUR/USD Weekly Outlook – Pro Trend Setup in Focus
My outlook for EUR/USD this week aligns closely with my GBP/USD analysis, as both pairs tend to move in a similar direction. For EU specifically, price is currently much closer to a valid demand zone, making the pro-trend continuation idea more likely in the short term.
After the recent break of structure to the upside, price left behind a well-defined 16H demand zone, which could serve as the base for another bullish rally. There’s also a significant buildup of liquidity above and no major nearby supply zone, so for now, I’ll be focusing solely on pro-trend long setups.
If price doesn’t retrace as deep as the 16H demand zone and continues pushing higher, I’ll be on the lookout for a new demand zone to form that we can then trade from.
Confluences for EU Buys:
- Price is nearing the 16H demand zone that caused the most recent break of structure
- Strong bullish momentum on the higher timeframes
- Clean liquidity above that remains untapped
- DXY continues to move bearish, aligning with a bullish EU outlook
P.S. I’ll be watching for an initial pullback during the Asia session to see how price interacts with the 16H demand. Stay alert and trade smart — let the market come to your zones.
Have a great trading week, everyone! 🔍📈

EUR/USD "The Fiber" Forex Market Heist Plan🌟Hi! Hola! Ola! Bonjour! Hallo! Marhaba!🌟
Dear Money Makers & Robbers, 🤑💰✈️
Based on 🔥Thief Trading style technical and fundamental analysis🔥, here is our master plan to heist the EUR/USD "The Fiber" Forex Market. Please adhere to the strategy I've outlined in the chart, which emphasizes long entry and short entry. 🏆💸Be wealthy and safe trade.💪🏆🎉
Entry 📈 :
🏴☠️Bullish Entry - "The heist is on! Wait for the MA Pullback at Institutional Hidden Buy Zone (1.11000) & Big Players Verified Trade Zone (1.09000) then make your move - Bullish profits await!"
🏴☠️Bearish Entry - "The vault is wide open! Swipe the Bearish loot at any price.
Stop Loss 🛑:
🚩Thief SL placed at for Bullish Trade (Big Players Verified Trade Zone SL at 1.07000) & (Institutional Hidden Buy Zone SL at 1.09500)
🚩Thief SL placed at 1.13800 for Bearish Trade
Using the 30mins period, the recent / swing low or high level.
SL is based on your risk of the trade, lot size and how many multiple orders you have to take.
Target 🎯:
🏴☠️Bullish Robbers TP 1.17000 (or) Escape Before the Target
🏴☠️Bearish Robbers TP 1.10500 (or) Escape Before the Target
💰💵💸EUR/USD "The Fiber" Forex Market Heist Plan is currently experiencing a Bearish trend 🐻,., driven by several key factors.
📰🗞️Get & Read the Fundamental, Macro Economics, COT Report, Quantitative Analysis, Sentimental Outlook, Intermarket Analysis, Future trend targets with overall score... go ahead to check👉👉👉🔗🔗🌎🌏🗺
Detailed Point-by-Point Recap 📋✨
Fundamentals 📊: USD leads due to Fed policy, US growth, and tariffs; EUR limited by Eurozone risks 💵📉.
Macroeconomics 🌐: US resilience contrasts with Eurozone weakness, favoring USD 🚀📉.
Global Markets 🌍: US equities and yields drive USD strength; Eurozone trade woes hurt EUR 📈📉.
COT Data 📉: Bearish speculative positioning supports USD 🐻.
Seasonality 📅: May historically favors USD, aligning with current trends 📉.
Intermarket 🔗: USD benefits from equity/yield correlations; EUR hit by energy costs 📈📉.
Quantitative 📉: Technicals (RSI, Fibonacci, channels) confirm bearish momentum 🐻.
Sentiment 😣: Bearish institutional bias, with retail shorts suggesting short-term EUR bounce 📉📈.
Trend Prediction 🚀📉: Bearish across timeframes, with downside targets at 1.1080, 1.0445, and 1.00 🐻.
Outlook ⭐: Bearish (7/10), with USD dominance likely to persist 💪📉.
📌Keep in mind that these factors can change rapidly, and it's essential to stay up-to-date with market developments and adjust your analysis accordingly.
⚠️Trading Alert : News Releases and Position Management 📰 🗞️ 🚫🚏
As a reminder, news releases can have a significant impact on market prices and volatility. To minimize potential losses and protect your running positions,
we recommend the following:
Avoid taking new trades during news releases
Use trailing stop-loss orders to protect your running positions and lock in profits
💖Supporting our robbery plan 💥Hit the Boost Button💥 will enable us to effortlessly make and steal money 💰💵. Boost the strength of our robbery team. Every day in this market make money with ease by using the Thief Trading Style.🏆💪🤝❤️🎉🚀
I'll see you soon with another heist plan, so stay tuned 🤑🐱👤🤗🤩

EUR/USD "The Fiber" Forex Bank Money Heist Plan (Bearish)🌟Hi! Hola! Ola! Bonjour! Hallo! Marhaba!🌟
Dear Money Makers & Robbers, 🤑💰✈️
Based on 🔥Thief Trading style technical and fundamental analysis🔥, here is our master plan to heist the EUR/USD "The Fiber" Forex Market. Please adhere to the strategy I've outlined in the chart, which emphasizes short entry. Our aim is the high-risk GREEN Zone. It's a Risky level, oversold market, consolidation, trend reversal, trap at the level where traders and bullish robbers are stronger. 🏆💸"Take profit and treat yourself, traders. You deserve it!💪🏆🎉
Entry 📈 : "The heist is on! Wait for the Neutral Level breakout then make your move at (1.12600) - Bearish profits await!"
however I advise to Place sell stop orders above the Moving average (or) after the Support level Place sell limit orders within a 15 (or) 30 minute timeframe most NEAREST (or) SWING low or high level for Pullback entries.
📌I strongly advise you to set an "alert (Alarm)" on your chart so you can see when the breakout entry occurs.
Stop Loss 🛑: "🔊 Yo, listen up! 🗣️ If you're lookin' to get in on a sell stop order, don't even think about settin' that stop loss till after the breakout 🚀. You feel me? Now, if you're smart, you'll place that stop loss where I told you to 📍, but if you're a rebel, you can put it wherever you like 🤪 - just don't say I didn't warn you ⚠️. You're playin' with fire 🔥, and it's your risk, not mine 👊."
📌Thief SL placed at the nearest/swing High or Low level Using the 3H timeframe (1.14200) Day/Scalping trade basis.
📌SL is based on your risk of the trade, lot size and how many multiple orders you have to take.
Target 🎯: 1.10800
💰💵💸EUR/USD "The Fiber" Forex Market Heist Plan (Day Trade) is currently experiencing a Bearish trend.., driven by several key factors.👇👇👇
📰🗞️Read the Fundamental, Macro Economics, COT Report, Seasonal Factors, Intermarket Analysis, Inventory and Storage Analysis, Sentimental Outlook, Future trend predict.
Before start the heist plan read it. go ahead to check 👉👉👉🔗🔗🌎🌏🗺
⚠️Trading Alert : News Releases and Position Management 📰 🗞️ 🚫🚏
As a reminder, news releases can have a significant impact on market prices and volatility. To minimize potential losses and protect your running positions,
we recommend the following:
Avoid taking new trades during news releases
Use trailing stop-loss orders to protect your running positions and lock in profits
💖Supporting our robbery plan 💥Hit the Boost Button💥 will enable us to effortlessly make and steal money 💰💵. Boost the strength of our robbery team. Every day in this market make money with ease by using the Thief Trading Style.🏆💪🤝❤️🎉🚀
I'll see you soon with another heist plan, so stay tuned 🤑🐱👤🤗🤩

EURUSD EURUSD – New Short Trade Opportunity
There’s currently a selling opportunity on EURUSD. I’ve already activated the trade, and anyone interested can consider entering now as well. If the price starts ranging too much, I’ll manually close the trade. Please note: this trade will not remain active until tomorrow.
🔍 Trade Details:
✔️ Timeframe: 15-Minute
✔️ Risk-to-Reward Ratio: 1:2
✔️ Trade Direction: Sell
✔️ Entry Price: 1.13438
✔️ Take Profit: 1.13128
✔️ Stop Loss: 1.13592
🔔 Disclaimer: This is not financial advice. I’m simply sharing a trade I’ve taken based on my personal trading system, strictly for educational and illustrative purposes.
📌 Looking for a systematic, data-driven approach to trading?
💡 Follow the page and turn on notifications to stay updated on future trade setups and advanced market insights.

EURUSDWeak USD with tariff plan would maximize the efforts.
Meanwhile, higher EUR would aswell serve the same benefit.
I see it as an entropy of the market that this pair to rise.
