Bullish Breakout in EUR/USD: Key Levels to Watch This WeekHi everyone,
EUR/USD had a strong week, climbing higher from the May 12 low and further reinforcing our view of a potential long-term bullish trend.
We anticipate further upside towards the 1.13768–1.13940 zone, followed by a possible pullback toward the 1.1200 area. We’ll share more updates on the expected path for EUR/USD if and when price reaches that zone.
The longer-term outlook remains bullish, and we expect the rally to extend towards the 1.2000 level, as long as price holds above the 1.10649 support.
We’ll be keeping you updated throughout the week with how we’re managing our active ideas. Thanks again for all the likes/boosts, comments and follows — we appreciate the support!
All the best for the week ahead. Trade safe.
BluetonaFX
Eurusdprediction

EURUSD is Ready for a Bullish MoveHello Traders
In This Chart EURUSD HOURLY Forex Forecast By FOREX PLANET
today EURUSD analysis 👆
🟢This Chart includes_ (EURUSD market update)
🟢What is The Next Opportunity on EURUSD Market
🟢how to Enter to the Valid Entry With Assurance Profit
This CHART is For Trader's that Want to Improve Their Technical Analysis Skills and Their Trading By Understanding How To Analyze The Market Using Multiple Timeframes and Understanding The Bigger Picture on the Charts

EURUSD - Expecting Bearish Continuation In The Short TermM15 - Clean bearish trend with the price creating series of lower highs, lower lows.
No opposite signs.
Expecting further continuation lower until the two Fibonacci resistance zones hold.
If you enjoy this idea, don’t forget to LIKE 👍, FOLLOW ✅, SHARE 🙌, and COMMENT ✍! Drop your thoughts and charts below to keep the discussion going. Your support helps keep this content free and reach more people! 🚀
--------------------------------------------------------------------------------------------------------------------
Disclosure: I am part of Trade Nation's Influencer program and receive a monthly fee for using their TradingView charts in my analysis.

EURUSD Reaches Key Resistance – Reversal or BreakoutEURUSD has rallied back to the 1.1382 resistance level, a zone where price previously rejected multiple times. Current structure suggests price is approaching a decision point, where it may either:
Form a double top or head-and-shoulders reversal
Or break out toward 1.1573, the next major resistance
Key Levels:
Resistance: 1.13825 → Critical decision zone
Support: 1.11442 → First major downside target
Deep Support: 1.10846 → Recent low
Scenarios to Watch:
🔹 Bearish Case (Primary Setup)
Price fails to break above 1.1382
Reversal candlestick forms below resistance
Breakdown may target:
1.1144 (first support)
1.1084 (continuation target)
🔹 Bullish Case (Less Likely Unless Confirmed)
Break and close above 1.1382
Bullish continuation to 1.1573
Would signal shift in medium-term trend bias
Chart Pattern Notes:
Price has made multiple lower highs, but also held structure
A triple top or reversal setup is forming unless bulls break decisively
Bearish wedge and neckline structures from past price action support downside risk
Fundamental Watch:
USD volatility from Fed speakers, PMI data
Eurozone risk sentiment and ECB inflation comments
Correlation with DXY (which is near support)
Conclusion:
📌 Rejection at 1.1382 likely leads to downside toward 1.1144
📌 Break above 1.1382 invalidates bearish setup and targets 1.1573
Wait for confirmation candle or momentum before execution.

EUR USD Entry Setup EUR USD has formed a bullish break and retest and has also retraced back to the 50-618 FIB retracement level.
The trend is bullish so we will continue to look for buying opportunities

EURUSD - SHORT PREDICTION - MONDAY, 26TH MAY 2025A pullback appears to be underway, following a sweep of inducement around the 15-minute level at 1.13900—marking our first significant Change of Character (CHoCH). This shift aligns with the broader narrative from the 1-hour timeframe, suggesting the potential for a deeper retracement into the extreme 1H order block.
With the current price trading around 1.13777, we anticipate a move back up to the 1.14078 level. This area is of interest for initiating short positions, in line with the ongoing correction.
Our first take-profit target is set at 1.13368, where we expect an initial reaction. Should bearish momentum continue, we foresee price extending lower to sweep the previous daily low at 1.12771 and potentially tapping into the daily external order block at 1.12664.
From there, we’ll closely monitor price behavior. If bullish intent begins to form, we’ll assess the potential for long setups targeting a move back toward the weekly high at 1.14190.

EURUSD H4 Chart Outlook for Shorter Term 26-30 May 25You are seeing EURUSD H4 Chart, Right EURUSD is standing in mid-term Bullish Trend with Bullish Channel
Kindly follow the Zones Accordingly and always place SL
Disclaimer: Forex is Risky

EURUSD Direction | Daily Timeframe OutlookThese are the points we can take from the daily time frame :
1.EURUSD has broken through quite strong resistance, and we have not seen any wicks on any time frame, this indicates that EURUSD is still strong for buying
2.After finishing its uptrend, Eurusd fell to the weekly support that I marked,
3.After completing the correction phase, this week there was a fairly strong closing in the market structure shift (MSS) area
4.The conclusion is, eurusd will continue its upward trend, this is useful for daily traders as a direction to determine which trading positions are profitable

EUR/USD pro trend idea from 1.13000EUR/USD Weekly Outlook – Pro Trend Setup in Focus
My outlook for EUR/USD this week aligns closely with my GBP/USD analysis, as both pairs tend to move in a similar direction. For EU specifically, price is currently much closer to a valid demand zone, making the pro-trend continuation idea more likely in the short term.
After the recent break of structure to the upside, price left behind a well-defined 16H demand zone, which could serve as the base for another bullish rally. There’s also a significant buildup of liquidity above and no major nearby supply zone, so for now, I’ll be focusing solely on pro-trend long setups.
If price doesn’t retrace as deep as the 16H demand zone and continues pushing higher, I’ll be on the lookout for a new demand zone to form that we can then trade from.
Confluences for EU Buys:
- Price is nearing the 16H demand zone that caused the most recent break of structure
- Strong bullish momentum on the higher timeframes
- Clean liquidity above that remains untapped
- DXY continues to move bearish, aligning with a bullish EU outlook
P.S. I’ll be watching for an initial pullback during the Asia session to see how price interacts with the 16H demand. Stay alert and trade smart — let the market come to your zones.
Have a great trading week, everyone! 🔍📈

EUR/USD "The Fiber" Forex Market Heist Plan🌟Hi! Hola! Ola! Bonjour! Hallo! Marhaba!🌟
Dear Money Makers & Robbers, 🤑💰✈️
Based on 🔥Thief Trading style technical and fundamental analysis🔥, here is our master plan to heist the EUR/USD "The Fiber" Forex Market. Please adhere to the strategy I've outlined in the chart, which emphasizes long entry and short entry. 🏆💸Be wealthy and safe trade.💪🏆🎉
Entry 📈 :
🏴☠️Bullish Entry - "The heist is on! Wait for the MA Pullback at Institutional Hidden Buy Zone (1.11000) & Big Players Verified Trade Zone (1.09000) then make your move - Bullish profits await!"
🏴☠️Bearish Entry - "The vault is wide open! Swipe the Bearish loot at any price.
Stop Loss 🛑:
🚩Thief SL placed at for Bullish Trade (Big Players Verified Trade Zone SL at 1.07000) & (Institutional Hidden Buy Zone SL at 1.09500)
🚩Thief SL placed at 1.13800 for Bearish Trade
Using the 30mins period, the recent / swing low or high level.
SL is based on your risk of the trade, lot size and how many multiple orders you have to take.
Target 🎯:
🏴☠️Bullish Robbers TP 1.17000 (or) Escape Before the Target
🏴☠️Bearish Robbers TP 1.10500 (or) Escape Before the Target
💰💵💸EUR/USD "The Fiber" Forex Market Heist Plan is currently experiencing a Bearish trend 🐻,., driven by several key factors.
📰🗞️Get & Read the Fundamental, Macro Economics, COT Report, Quantitative Analysis, Sentimental Outlook, Intermarket Analysis, Future trend targets with overall score... go ahead to check👉👉👉🔗🔗🌎🌏🗺
Detailed Point-by-Point Recap 📋✨
Fundamentals 📊: USD leads due to Fed policy, US growth, and tariffs; EUR limited by Eurozone risks 💵📉.
Macroeconomics 🌐: US resilience contrasts with Eurozone weakness, favoring USD 🚀📉.
Global Markets 🌍: US equities and yields drive USD strength; Eurozone trade woes hurt EUR 📈📉.
COT Data 📉: Bearish speculative positioning supports USD 🐻.
Seasonality 📅: May historically favors USD, aligning with current trends 📉.
Intermarket 🔗: USD benefits from equity/yield correlations; EUR hit by energy costs 📈📉.
Quantitative 📉: Technicals (RSI, Fibonacci, channels) confirm bearish momentum 🐻.
Sentiment 😣: Bearish institutional bias, with retail shorts suggesting short-term EUR bounce 📉📈.
Trend Prediction 🚀📉: Bearish across timeframes, with downside targets at 1.1080, 1.0445, and 1.00 🐻.
Outlook ⭐: Bearish (7/10), with USD dominance likely to persist 💪📉.
📌Keep in mind that these factors can change rapidly, and it's essential to stay up-to-date with market developments and adjust your analysis accordingly.
⚠️Trading Alert : News Releases and Position Management 📰 🗞️ 🚫🚏
As a reminder, news releases can have a significant impact on market prices and volatility. To minimize potential losses and protect your running positions,
we recommend the following:
Avoid taking new trades during news releases
Use trailing stop-loss orders to protect your running positions and lock in profits
💖Supporting our robbery plan 💥Hit the Boost Button💥 will enable us to effortlessly make and steal money 💰💵. Boost the strength of our robbery team. Every day in this market make money with ease by using the Thief Trading Style.🏆💪🤝❤️🎉🚀
I'll see you soon with another heist plan, so stay tuned 🤑🐱👤🤗🤩

EUR/USD "The Fiber" Forex Bank Money Heist Plan (Bearish)🌟Hi! Hola! Ola! Bonjour! Hallo! Marhaba!🌟
Dear Money Makers & Robbers, 🤑💰✈️
Based on 🔥Thief Trading style technical and fundamental analysis🔥, here is our master plan to heist the EUR/USD "The Fiber" Forex Market. Please adhere to the strategy I've outlined in the chart, which emphasizes short entry. Our aim is the high-risk GREEN Zone. It's a Risky level, oversold market, consolidation, trend reversal, trap at the level where traders and bullish robbers are stronger. 🏆💸"Take profit and treat yourself, traders. You deserve it!💪🏆🎉
Entry 📈 : "The heist is on! Wait for the Neutral Level breakout then make your move at (1.12600) - Bearish profits await!"
however I advise to Place sell stop orders above the Moving average (or) after the Support level Place sell limit orders within a 15 (or) 30 minute timeframe most NEAREST (or) SWING low or high level for Pullback entries.
📌I strongly advise you to set an "alert (Alarm)" on your chart so you can see when the breakout entry occurs.
Stop Loss 🛑: "🔊 Yo, listen up! 🗣️ If you're lookin' to get in on a sell stop order, don't even think about settin' that stop loss till after the breakout 🚀. You feel me? Now, if you're smart, you'll place that stop loss where I told you to 📍, but if you're a rebel, you can put it wherever you like 🤪 - just don't say I didn't warn you ⚠️. You're playin' with fire 🔥, and it's your risk, not mine 👊."
📌Thief SL placed at the nearest/swing High or Low level Using the 3H timeframe (1.14200) Day/Scalping trade basis.
📌SL is based on your risk of the trade, lot size and how many multiple orders you have to take.
Target 🎯: 1.10800
💰💵💸EUR/USD "The Fiber" Forex Market Heist Plan (Day Trade) is currently experiencing a Bearish trend.., driven by several key factors.👇👇👇
📰🗞️Read the Fundamental, Macro Economics, COT Report, Seasonal Factors, Intermarket Analysis, Inventory and Storage Analysis, Sentimental Outlook, Future trend predict.
Before start the heist plan read it. go ahead to check 👉👉👉🔗🔗🌎🌏🗺
⚠️Trading Alert : News Releases and Position Management 📰 🗞️ 🚫🚏
As a reminder, news releases can have a significant impact on market prices and volatility. To minimize potential losses and protect your running positions,
we recommend the following:
Avoid taking new trades during news releases
Use trailing stop-loss orders to protect your running positions and lock in profits
💖Supporting our robbery plan 💥Hit the Boost Button💥 will enable us to effortlessly make and steal money 💰💵. Boost the strength of our robbery team. Every day in this market make money with ease by using the Thief Trading Style.🏆💪🤝❤️🎉🚀
I'll see you soon with another heist plan, so stay tuned 🤑🐱👤🤗🤩

EURUSD EURUSD – New Short Trade Opportunity
There’s currently a selling opportunity on EURUSD. I’ve already activated the trade, and anyone interested can consider entering now as well. If the price starts ranging too much, I’ll manually close the trade. Please note: this trade will not remain active until tomorrow.
🔍 Trade Details:
✔️ Timeframe: 15-Minute
✔️ Risk-to-Reward Ratio: 1:2
✔️ Trade Direction: Sell
✔️ Entry Price: 1.13438
✔️ Take Profit: 1.13128
✔️ Stop Loss: 1.13592
🔔 Disclaimer: This is not financial advice. I’m simply sharing a trade I’ve taken based on my personal trading system, strictly for educational and illustrative purposes.
📌 Looking for a systematic, data-driven approach to trading?
💡 Follow the page and turn on notifications to stay updated on future trade setups and advanced market insights.

EURUSDWeak USD with tariff plan would maximize the efforts.
Meanwhile, higher EUR would aswell serve the same benefit.
I see it as an entropy of the market that this pair to rise.

price action has been steadily climbing, indicating that bulls!GBP/USD Technical Analysi s – Bullish Momentum Building
The GBP/USD pair is currently showing signs of bullish strength, having recently rebounded from a 1-hour Bullish Fair Value Gap (FVG), which has acted as a strong support zone. This technical reaction suggests increased buying interest and provides a short-term bullish bias in the market.
Following the rejection from the FVG, price action has been steadily climbing, indicating that bulls are gaining control. Market structure on the 1-hour timeframe remains intact with higher highs and higher lows, further supporting the bullish narrative. Additionally, volume analysis and momentum indicators are beginning to align with the current upward move, suggesting that there may be room for continuation.
However, to confirm sustained bullish momentum, it is essential to monitor key resistance levels ahead. The next immediate resistance lies near , which has historically acted as a decision point for the market. A clean breakout and close above this level on increased volume would serve as strong confirmation for a further upside move, potentially targeting .
Conversely, traders should remain cautious of any signs of weakness or bearish divergence forming near resistance areas. Should the pair fail to break higher and instead reverse, a revisit of the bullish FVG could occur, potentially offering another entry opportunity for buyers.
In summary, the GBP/USD pair is displaying bullish intent in the short term, but confirmation from higher timeframes and key levels will be critical before committing to a directional bias. Maintain a balanced outlook and adapt to the evolving price action.

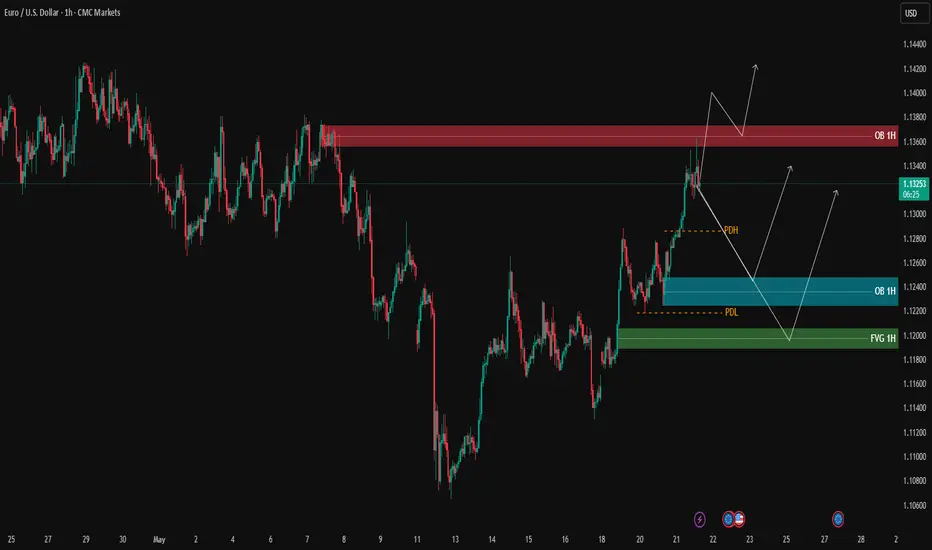
EURUSD – 1H Update on Our Previous EURUSD Post +60 PipsAs expected from our last idea, price reacted well to our 1H Order Block zones.
🔹 Upon receiving bullish confirmation on the 3-minute timeframe, we entered a long position, which has now moved 60 pips in our favor.
📍 Current Setup:
Price is now at a decision point – around yesterday’s high (PDH) and the 1H supply (OB).
✅ If price breaks above PDH (dashed yellow line), it could lead to a clean break of the 1H resistance and continuation to the upside.
🚫 However, if bullish momentum weakens, there’s a real chance price may pull back to collect buy-side liquidity in the blue and green demand boxes below.
⚠️ It’s Friday – trade with caution!
Late-week volatility and false spikes are common before weekly close.
🔍 Insight by ProfitaminFX
If this outlook aligns with your bias, or if you see it differently, feel free to share your perspective in the comments. Let’s grow together 📈

Big Picture Shift: EURUSD Bulls Eye 1.23–1.25 Zone📊 EURUSD – Has the Long-Term Trend Finally Reversed?
Since the 2008 all-time high at 1.60, EURUSD has been in a persistent downtrend, dropping all the way below parity in September 2022.
Following the recovery back above parity, the pair has been range-bound in a 700-pip channel for nearly two years. And while early 2025 brought a sharp decline toward the 1.02 zone, this move was quickly reversed, forming what now looks like a higher low relative to the sub-parity bottom.
❓ The big question: Is the long-term trend now bullish?
There are several signs supporting this idea:
✅ From 2008 to 2014, the pair formed a massive descending triangle, which eventually broke to the downside.
✅ The area around 1.05 held as a long-term support, and price began trading in a broader range with 1.22–1.23 resistance.
✅ The break below parity could now be interpreted as a false breakdown, with the strong reversal from 1.02 this year confirming the historical support zones from 2015 and 2017.
✅ Most importantly, the recent push to 1.1550 could be the first higher high on the long-term chart — a potential signal that the downtrend of nearly two decades is ending.
🎯 Conclusion and Long-Term Target
In my view, the long-term trend has shifted. The structure now favors bullish continuation, and my primary target on the long term is the 1.23–1.25 zone.
Disclosure: I am part of Trade Nation's Influencer program and receive a monthly fee for using their TradingView charts in my analyses and educational articles.

EUR USD Entry Setup 1 hour timeframe EUR USD Entry Setup 1 hour timeframe
Trade Setup: Bullish break and retest
Additional Confluence: Fib Retracement Level👌🏻⬆️

EURUSD – Testing 1H Supply Zone, Awaiting Confirmation | ProfitaAfter a strong bullish rally breaking previous highs, EURUSD is now reacting to the 1H supply zone (OB 1H) marked in red.
We’re seeing an initial bearish rejection from this zone. If sellers maintain control, price may retrace toward the lower demand areas:
Blue OB 1H zone (1.12200 – 1.12450)
Green FVG 1H further below
However, if buyers manage to push price above the red OB and close a candle above it, continuation to the upside remains a valid scenario.
📌 Key Levels
🟢 Support Zones:
1.12200 – 1.12450
1.11780 – 1.12000
🔴 Resistance:
1.13500 – 1.13800
⚠️ Note:
Watch for lower-timeframe (M5/M3) confirmations for entry. Only act on clear setups inside the zones.
🔍 Insight by ProfitaminFX
EURUSD Pullback in Play – Next Stop: $1.1337EURUSD ( FX:EURUSD ) is moving in the Resistance zone($1.1310-$1.1162) while the upper line of the descending channel has been broken.
According to Elliott Wave theory , a breakout of the descending channel can at least confirm the end of a corrective wave . The corrective wave structure was a Double Three Correction(WXY) .
I expect EURUSD to rise to at least $1.1337 after completing a pullback to the upper line of the descending channel .
Note: If EURUSD touches $1.11590, we can expect further declines.
Please respect each other's ideas and express them politely if you agree or disagree.
Euro/U.S. Dollar Analyze (EURUSD), 4-hour time frame.
Be sure to follow the updated ideas.
Do not forget to put a Stop loss for your positions (For every position you want to open).
Please follow your strategy and updates; this is just my Idea, and I will gladly see your ideas in this post.
Please do not forget the ✅' like '✅ button 🙏😊 & Share it with your friends; thanks, and Trade safe.

EURUSD SELL/SHORTBy utilizing levels, historical patterns, , we can formulate a hypothesis that the market might follow a similar trajectory if bearish sentiment prevails.

EURUSD – CME Gap and 0.786 Fib Align at Key Demand ZoneEURUSD has been trading with a strong bullish tone recently, breaking through previous resistance levels with conviction. However, after the latest impulse move to the upside, the market is now showing signs of exhaustion. Price has begun to pull back in a controlled manner, creating a potential opportunity for a deeper retracement into a more favorable area of interest. This kind of pullback is typical after an aggressive rally, and right now, there’s clear evidence that price may need to revisit lower levels before any further continuation higher.
Technical Confluence at Its Best:
Below the current range, there is a high-probability demand zone that combines three powerful elements: a well-respected historical support area, a CME gap that was left unfilled during the previous rally, and a 0.786 Fibonacci retracement from the latest bullish leg. These levels don’t just sit close to each other, they stack right on top of one another, forming a dense pocket of liquidity and technical confluence. The market often gravitates toward these types of zones to rebalance price and fuel the next directional move.
Short-Term Bearish Setup – Let Price Come to You:
The expectation is for price to dip lower in the short term. This would allow the market to tap into the unfilled CME gap and sweep the liquidity resting below the current structure. Traders who went long late in the move are likely to have their stops sitting just beneath recent lows, and this sets the stage for a classic inducement and stop hunt scenario. Price doesn't need to collapse, just a healthy retracement into this confluence zone to rebalance and refill the inefficiency before the real move begins.
Bullish Reversal Expectations:
Once price fills the CME gap and reaches into the 0.786 Fib retracement level, the focus shifts back to bullish. If the market holds this support cleanly and shows early signs of strength, like a displacement back above short-term structure or a strong engulfing candle, this could signal the beginning of a new upward leg. Given the context and momentum from the previous rally, it’s reasonable to anticipate a strong reaction that could drive price back toward the recent highs or potentially even higher.
The Psychology Behind the Setup:
This type of setup is a textbook example of how smart money operates. Price leaves a gap, traders pile in on the breakout, and then the market retraces to fill the imbalance and shake out weak hands before resuming the trend. Understanding the logic behind the CME gap, the liquidity below price, and how the Fib level ties everything together gives this setup depth. It’s not just about lines and zones, it’s about how liquidity flows through the market and how structure sets up to trap and reward.
Conclusion:
Patience is key. Rather than chasing the bullish momentum at current levels, the plan is to wait for price to revisit the zone where the CME gap, historical support, and the 0.786 Fib level align. That’s where the real value lies. If the reaction from this zone is clean and confirms strength, it offers a high-probability entry for the next leg up. No need to force anything, let the market come to you, then execute with precision.
___________________________________
Thanks for your support!
If you found this idea helpful or learned something new, drop a like 👍 and leave a comment, I’d love to hear your thoughts! 🚀

Encounter Resistance And Reverse Direction Educational Forex Trading Insight – EUR/USD Potential Bearish Scenario
This content is intended for educational purposes only and aims to help traders understand how a possible sell setup in the EUR/USD currency pair might be analyzed. It is not a signal or financial advice, but rather a breakdown of a potential market scenario based on technical observations.
---
Currency Pair: EUR/USD
Market Outlook: Bearish (Short Position Scenario)
Suggested Sell Zone:
A possible area of interest for initiating a short position lies between 1.13430 and 1.13520, where the price may encounter resistance and reverse direction. This zone could offer a favorable risk-to-reward setup for experienced traders identifying signs of bearish confirmation.
Risk Management – Stop Loss:
A stop-loss order should be placed based on your personal trading strategy and risk tolerance. It is generally advisable to position it above the resistance area to account for potential volatility or fake breakouts.
Potential Price Targets:
First Target (TP1): 1.13159 – Near-term support level
Second Target (TP2): 1.12970 – Deeper retracement zone
Third Target (TP3): 1.12800 – Stronger historical support
Additional downside may develop if bearish momentum continues beyond these levels
---
Important Notice:
This analysis is for informational and educational purposes only. Trading foreign exchange on margin carries a high level of risk and may not be suitable for all investors. Always conduct your own research (DYOR) and consider consulting a licensed financial advisor before making any trading decisions. Proper risk management and discipline are essential for long-term success in the markets.

EURUSD time for correctionMonthly
On the monthly timeframe, we came to the Premium zone and captured Monthly Fractal High, where previously there was predominance from the sell side.
Weekly
Price has formed a Weekly FVG, indicating strong dominance from the buy side. However, it is important to understand WHERE this has led us ? The current quotes are interesting for sellers. Hence, we should assume that the price may receive a counter offer from the sell side. It is logical to assume potential points A and B in this context.
Daily
Price has formed primary signs of change in the price delivery state:
- Bullish PD Array disrespecting
- BISI forming
- CISD forming
All this indicates a shift of initiative to the selling side, so it is logical to expect a continuation of the downward movement after interaction with the marked PD Array.
Also, I would like to draw your attention to the fact that the price is within the Inside Bar for the 3rd day already. This means that recently the price has been held within the same values, which indicates a balance of power between buyers and sellers at the current quotes. In such a situation, all we have to do is to find the optimal area to continue the downward price formation.
