EURUSD SELLEUR/USD stays defensive below 1.1800 ahead of ECB decision
EUR/USD remains in a bullish consolidation mode below 1.1800 in European trading on Thursday. Traders refrain from placing fresh bets ahead of the European Central Bank policy announcements and the US preliminary PMI data. Mixed PMI data from Germany and the Eurozone failed to trigger a noticeable reaction.
The EUR/USD pair retreated from a fresh two-week peak at 1.1781 posted during Asian trading hours, hovering around 1.1750 ahead of the European Central Bank (ECB) monetary policy announcement. The US Dollar (USD) edged lower on the back of risk appetite, amid headlines indicating a trade deal between Japan and the United States (US).
US President Donald Trump announced in a post on social media a trade deal with Japan that sets "reciprocal" tariffs at 15% on Tuesday, while Japanese Prime Minister Shigeru Ishiba acknowledged the trade agreement on Wednesday, saying it would benefit both sides. Trump shifted his attention to the European Union (EU), noting that if the Union agrees to open up to US businesses, he will then charge lower levies.
Meanwhile, the Hamburg Commercial Bank (HCOB) published the preliminary estimates of the July Purchasing Managers’ Indexes (PMIs). European growth stands at its highest in almost a year according to the surveys, as the Composite PMI rose to 51.0 in July from 50.6 in Jun,e while beating expectations of 50.8.
As for the ECB, the central bank announced its decision to keep the benchmark rates on hold, as widely anticipated. The interest rate on the main refinancing operations, the interest rates on the marginal lending facility and the deposit facility stood at 2.15%, 2.4% and 2%, respectively. The headline had no impact on EUR/USD, which kept trading at around 1.1750.
Right afterwards, the US released Initial Jobless Claims for the week ended July 19, which improved to 217K from the 221K previously posted and the 227K anticipated. Coming up next is ECB President Christine Lagarde's press conference, and the US S&P Global preliminary July PMIs.
SUPPORT 1.17118
SUPPORT 1.16767
SUPPORT 1.16316
RESISTANCE 1.17937
RESISTANCE 1.17703
Eurusdsell

Fundamental Market Analysis for July 22, 2025 EURUSDThe euro is trading near 1.1700, having retreated from an intraday high of 1.1720 after the release of the final June U.S. CPI figures, which confirmed a slowdown in inflation to 2.7% y/y and 0.1% m/m while keeping the core reading steady at 3.1%. The brief rise in risk appetite quickly gave way to stronger demand for the dollar as the probability of the Fed’s first rate cut in September fell from 65% to 55%.
Additional pressure on the euro comes from the yield differential: 10-year U.S. Treasuries hover around 4.45%, while German Bunds yield only 2.30%. The gap of more than 215 bp encourages capital to flow from the eurozone into dollar assets, supporting USD demand.
Fundamentally, risks for the euro remain tilted to the downside: after June’s rate cut the ECB said further moves depend on price dynamics, and the eurozone composite PMI dropped to 50.1 – the brink of stagnation. Against the backdrop of weak continental activity and moderate yet persistent U.S. inflation, the pair may test support at 1.1615 in the coming sessions, especially if U.S. durable-goods orders exceed forecasts.
Trading recommendation: SELL 1.1700, SL 1.1720, TP 1.1615

SHORT ON EUR/USDEU has given a nice bearish setup with a rising channel.
I will be selling EU to the next demand level looking to catch 200-300 pips.

SHORT ON EUR/USDEUR/USD has a rising wedge within a consolidation zone.
The dollar looks like it will rise which will cause this pair to fall.
I will be selling EU looking to catch 150-300 pips this week.

Supply Trap Revisit Before Final Drop? | Smart Money Outlook
📉 Price has recently reacted from a strong FVG + Demand + Liquidity Start Zone (4hr) around 1.1450, confirming bullish intent temporarily.
📈 However, a corrective move is now heading into a 4hr Fair Value Gap (FVG) zone near 1.1520–1.1550, which aligns with a potential lower high setup.
Key Zones:
Supply Zone @ 1.1550 (Caution): Watch for rejection signs here—high confluence with previous imbalance.
Bearish Expectation: After liquidity grab or mitigation in FVG, expect a strong sell-off targeting the 1.1410 level (measured move and 1.618 fib extension).
⚠️ Be cautious of price pushing slightly above 1.1550 to sweep liquidity before reversing.

Core Impact Logic of the Middle East Situation on EURUSD(I) Energy Transmission Chain: Oil Price Fluctuations → Eurozone Inflation and Economy
The escalation of the Middle East situation (the Iran - Israel conflict, risks in the Strait of Hormuz) directly impacts the global energy supply chain:
If the conflict expands to block the Strait of Hormuz (transports ~20% of global crude oil 🛢️), Brent crude has already soared from recent lows—spiking over 5% on June 17 amid tensions ⛽️. This pushes up imported inflation in the Eurozone.
As a net energy - importing region 🌍, prolonged high oil prices will squeeze corporate profits, suppress consumption, and drag Eurozone economic recovery (German/French manufacturing is acutely energy - cost - sensitive 🏭). This weakens the euro’s fundamental support.
(II) Geopolitical Safe - Haven Sentiment: The "Safe - Haven Balance" Between USD & EUR
Amid Middle East tensions, the US dollar’s traditional safe - haven status competes with Eurozone havens like German bonds 📈:
If the US (e.g., the Trump administration) intervenes militarily 💥, market fears of "America mired in war" rise. USD safe - haven demand may temporarily weaken ⬇️, and the euro benefits as funds shift 🔄
⚡️⚡️⚡️ EURUSD ⚡️⚡️⚡️
🚀 Buy@ 1.14500 - 1.15000
🚀 TP 1.15500 - 1.15600
Accurate signals are updated every day 📈 If you encounter any problems during trading, these signals can serve as your reliable guide 🧭 Feel free to refer to them! I sincerely hope they'll be of great help to you 🌟 👇

EURUSD Bearish move ideaEURUSD is at a reversal point were orders are being collected and the execution an timing of this trade idea must still be taken into consideration. I am expecting a move to the downside in the next couple of weeks.

Opportunity for selling EURUSDI see that EURUSD has confirmed strong resistance, so I took a sell trade with it.

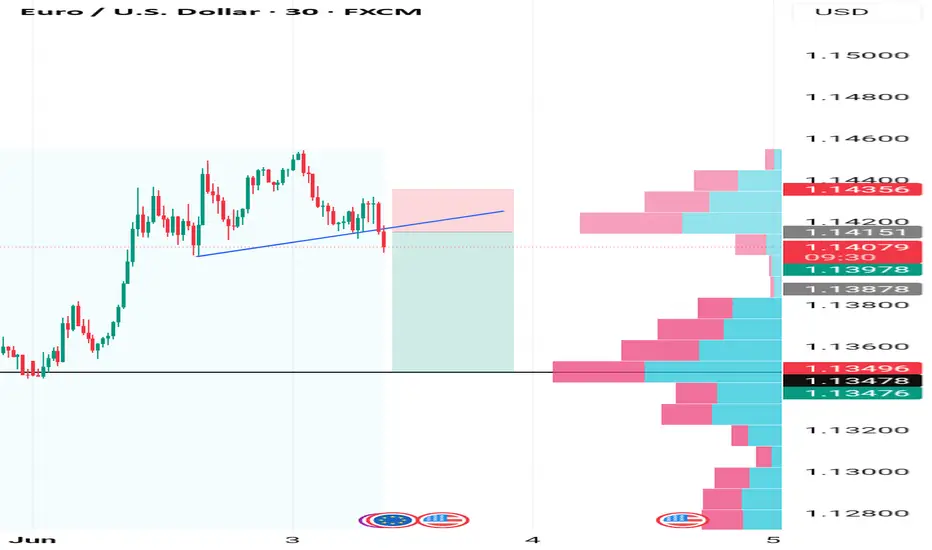
Today's EUR/USD Trend Analysis and Trading RecommendationsThe EUR/USD is trading at the upper end of its recent range, having hit an intraday high of around 1.1440 and remaining near that level. The US Dollar strengthened in the early session due to optimism about the easing of Sino-US trade tensions, but later declined as European stocks fluctuated. Technically, the daily chart shows bulls remain in control, with the 20-day SMA rising gently at 1.1330. In the short term, the pair is range-bound around the 20-day SMA, yet to confirm a bullish breakout, while the 100-day and 200-day SMAs support the overall upward trend.
EUR/USD
buy@1.14200-1.14300
tp:1.14600-1.14900

EUR/USD Best Place To Sell To Get 250 Pips , Don`t Miss It !Here is my EUR/USD Analysis and if you check the chart you will see that we have avery strong res area forced the price to go down hard last time , so i will sell this pair from the same res area , it will force the price to go down hard at least 250 pips , waiting the price to touch it and then we can sell it .

EUR/USD Bearish Reversal Setup Analysis EUR/USD Bearish Reversal Setup Analysis 🧠💼
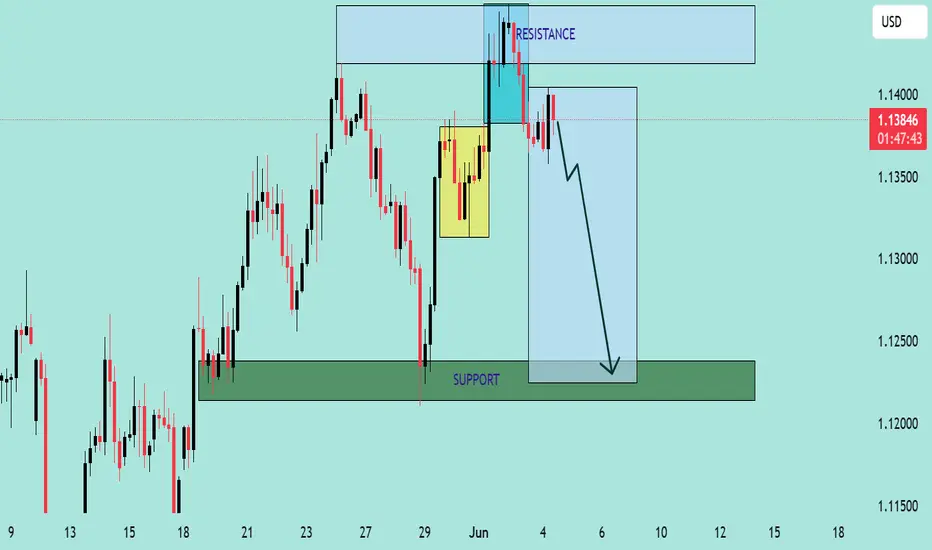
The chart presents a clear bearish outlook on EUR/USD, with well-defined resistance and support zones, along with a projected short-term price trajectory. Here's a professional breakdown:
🔍 Key Technical Highlights
🔵 Resistance Zone (~1.1400 - 1.1430)
Price recently tested this resistance area and formed multiple wicks, signaling strong seller presence.
A bullish liquidity grab is evident in the highlighted cyan box, suggesting a fake breakout before reversal.
🟡 Supply Zone / Order Block
The yellow box marks a previous consolidation area (potential order block), which was revisited and rejected — reinforcing bearish intent.
🔽 Current Price Action
Price is trading around 1.1378, having broken structure and failed to maintain momentum above the resistance.
Sharp rejections and bearish engulfing candles imply strong selling pressure.
🟢 Support Zone (~1.1230 - 1.1260)
This is a previous demand area where price rallied strongly.
The large blue projection box and arrow suggest a bearish continuation targeting this support region.
📉 Bias: Bearish
Structure: Lower highs forming after liquidity grab.
Price Action: Bearish engulfing after resistance rejection.
Market Sentiment: Sellers appear in control after failing bullish breakout attempt.
🎯 Trade Idea
Entry: After confirmed rejection from resistance (~1.1370–1.1385)
TP: Around 1.1240 (support zone)
SL: Above recent highs (~1.1420)
Risk/Reward: Favorable R:R as the setup targets a large swing down.
EURUSD SELL There is currently a sell opportunity now.
Entry:1.141500
Stop loss: 1.143500
Take profit:1.134700
Comment your opinion now.
Follow me on X @shajudeakinoba1 if you like me to manage your trading account for you.
SHORT ON EUR/USDEUR/USD has just swept a previous high and has plenty of liquidity to the downside to capture.
I will be selling EU to the next swing low looking to catch 80-100 pips.

EUR/USD4H Bearish Trade Setup Supply Zone Rejection with 3:1 RRR🔷 Trend Overview
📈 Price was in a rising channel (trend line + support line).
❌ Channel broken on downside → potential trend reversal.
🟧 🔼 Supply Zone (Sell Area)
📍 Zone: 1.13707 – 1.14432
🟠 Price faced rejection here.
💡 Institutional selling likely in this zone.
🔥 This is the ideal short-entry area.
🟦 🔽 Entry Point
🎯 Entry: Around 1.13694
🧩 Sits just below supply zone = safer trigger.
✅ Wait for a bearish confirmation candle before entering.
🟨 Support Level
📉 Support Zone: ~1.13100 – 1.13400
📊 Recently broken with a strong bearish candle.
🧱 Used to act as a floor, now may act as resistance.
🟩 🎯 Target Point
✅ Take Profit: 1.10970
📎 Matches previous structure support.
💰 Lock in profits before the psychological level at 1.1100.
🟥 ⛔ Stop Loss
❌ Stop: 1.14419
📏 Placed above the supply zone for protection.
🛡️ Shields from false breakouts or spikes.
⚖️ Risk-to-Reward Ratio (RRR)
💡 Approx. 3:1 ✅
📉 Risk: ~70 pips
📈 Reward: ~270 pips
🔥 High-probability setup
📌 EMA (Exponential Moving Average – 70)
📍 EMA 70 at 1.13102
🔻 Price is below the EMA → favors bearish momentum
🧠 Pro Tips:
🔍 Watch for bearish engulfing or rejection candles at the entry zone.
🗓️ Be aware of major news events (ECB, Fed).
🧮 Adjust lot size for risk management (based on SL size).
✅ Summary:
🧩 Element 📊 Value
Trade Type 🔻 Short (Sell)
Entry Point 📌 1.13694
Stop Loss ⛔ 1.14419
Take Profit 🎯 1.10970
RRR ⚖️ ~3:1
Sentiment 📉 Bearish

Bullish Breakout in EUR/USD: Key Levels to Watch This WeekHi everyone,
EUR/USD had a strong week, climbing higher from the May 12 low and further reinforcing our view of a potential long-term bullish trend.
We anticipate further upside towards the 1.13768–1.13940 zone, followed by a possible pullback toward the 1.1200 area. We’ll share more updates on the expected path for EUR/USD if and when price reaches that zone.
The longer-term outlook remains bullish, and we expect the rally to extend towards the 1.2000 level, as long as price holds above the 1.10649 support.
We’ll be keeping you updated throughout the week with how we’re managing our active ideas. Thanks again for all the likes/boosts, comments and follows — we appreciate the support!
All the best for the week ahead. Trade safe.
BluetonaFX

EURUSD - Expecting Bearish Continuation In The Short TermM15 - Clean bearish trend with the price creating series of lower highs, lower lows.
No opposite signs.
Expecting further continuation lower until the two Fibonacci resistance zones hold.
If you enjoy this idea, don’t forget to LIKE 👍, FOLLOW ✅, SHARE 🙌, and COMMENT ✍! Drop your thoughts and charts below to keep the discussion going. Your support helps keep this content free and reach more people! 🚀
--------------------------------------------------------------------------------------------------------------------
Disclosure: I am part of Trade Nation's Influencer program and receive a monthly fee for using their TradingView charts in my analysis.

EUR/USD Rising Wedge Breakdown – Bearish Opportunity in Sight🔍 Technical Breakdown
🟦 1. Rising Wedge Pattern (Bearish)
The price has been moving within a tightening upward channel — forming higher highs and higher lows, but with decreasing momentum. This is a typical Rising Wedge, a pattern that signals exhaustion in an uptrend and typically resolves to the downside.
The pattern formed over several days.
Volume has been declining as the price pushed higher — a classic sign of weakening trend strength.
🚨 2. Major Resistance Zone
The wedge culminated near a major historical resistance zone (around 1.1400), which price failed to break multiple times — showing strong seller presence. This adds confluence to the bearish breakdown.
📉 3. Breakdown & Retest
Price broke below the lower wedge trendline, confirming the bearish reversal. After the breakdown, the pair appears to be retesting the previous support line — now acting as new resistance.
This retest is crucial — a successful rejection here typically confirms the breakdown and provides an ideal entry point for short positions.
⚡ Volume Clues
Note the "Volume Burst" earlier in the chart, followed by a sharp move up. But that rally was unsustainable — buyers couldn’t hold above resistance, and volume has since faded. This volume exhaustion is further evidence that bullish momentum is weakening.
🔄 Key Support Zones Below
Around 1.1200: A strong SR flip zone (support-turned-resistance), which could act as temporary support.
Final Bearish Target: Around 1.1070, a strong demand zone where price previously consolidated before the last bullish run.
This is the measured move target from the wedge height applied to the breakdown point.
🧠 Why This Matters (Trader Insight)
This setup combines:
A reliable bearish pattern (rising wedge)
Key horizontal resistance
A volume drop
A clean retest structure
That makes it a high-confluence short trade idea. These patterns don't always play out immediately, but when they do, they often drop hard.
📌 Trade Setup Summary
Bias: Bearish
Pattern : Rising Wedge (broken)
Current Action: Retesting the broken wedge
Entry Zone: 1.135–1.138 (retest confirmation)
First Target: 1.1200 (SR Flip)
Final Target: 1.1070 (Demand Zone)
Invalidation: Break and hold above 1.1410

EURUSD SELL/SHORTBy utilizing levels, historical patterns, , we can formulate a hypothesis that the market might follow a similar trajectory if bearish sentiment prevails.

EUR/USD Short Opportunity – Rising Wedge + Retest + TargetThis technical setup on EUR/USD (1H timeframe) highlights a potential high-probability short opportunity based on a combination of price action, chart patterns, and key structural levels. The pair is showing signs of weakening bullish momentum and preparing for a bearish continuation.
🔎 1. Pattern Analysis: Rising Wedge Formation
The primary pattern visible is a Rising Wedge, which is traditionally a bearish reversal formation. It’s defined by:
Higher highs and higher lows, but both trendlines are converging, suggesting weakening bullish control.
Volume (not shown here) typically decreases within a rising wedge, further confirming a potential breakout.
This wedge formed after a previous sharp bullish recovery, acting as a continuation structure that often reverses.
In this case, the price formed multiple touches on both wedge boundaries, enhancing the reliability of the pattern.
🧱 2. Key Structural Zones:
Minor Resistance Zone (~1.1270–1.1285):
Clearly marked on the chart with a blue shaded zone.
Price has reacted from this level multiple times, validating it as a supply area.
The most recent attempt to break above this level failed, further confirming seller dominance.
Consolidation Zone (highlighted in yellow):
Prior to the wedge’s formation, price entered a consolidation phase.
Consolidation often precedes a breakout or a trend reversal. In this case, it provided a base for the rally that formed the wedge.
🔁 3. Breakout and Retest:
Price has broken below the lower support line of the rising wedge.
This breakout is a bearish signal and suggests the pair may now be ready for a stronger downside move.
The price appears to be retesting the broken wedge support, which is a classic confirmation move before continuation.
Retests of broken structures often offer low-risk, high-reward entry opportunities.
🎯 4. Trade Plan and Setup:
Entry Zone: Watch for bearish rejection or candle confirmation on the retest of the wedge support turned resistance.
Stop Loss (SL): Positioned just above the resistance zone, at 1.12887, protecting the trade against false breakouts or reversals.
Take Profit Levels:
TP1 – 1.10649: This level is a strong support zone based on previous price action and structural significance.
TP2 – 1.09670: The full measured move from the height of the wedge. This also aligns with historical support and psychological round number proximity (1.10).
🧠 5. Confluence Factors:
Technical Pattern: Rising wedge = bearish.
Support/Resistance: Multiple reactions to both the resistance zone and wedge trendlines confirm market memory.
Price Action: Break + retest = ideal entry confirmation.
Risk-Reward Ratio: Favorable, especially with conservative TP1 and aggressive TP2 levels.
Macro Context (optional): If posted during news week – potential USD strength based on rate expectations, NFP, or inflation.
⚠️ 6. Risk Management Tips:
Use a position size that aligns with your account risk tolerance (1–2% rule).
Wait for confirmation (bearish engulfing candle or rejection wick) before entering.
Always be prepared for invalidation. If price closes above the resistance zone, this idea is voided.

EURUSD SELL/SHORTBy utilizing levels, historical patterns, , we can formulate a hypothesis that the market might follow a similar trajectory if bearish sentiment prevails.

Bearish AB=CD - Sell at Current Price!FX:EURUSD has broken its bullish support and formed a bearish AB=CD pattern. AB=CD is a bearish continuation pattern which aligns with the overall price action.
I am shorting EURUSD at current market price and expecting retracement until Point D to complete the pattern!

EURUSD - Expecting Bearish Continuation In The Short TermH1 - Clean bearish trend with the price creating series of lower highs, lower lows.
Lower lows on the moving averages of the MACD indicator.
Expecting further continuation lower until the two Fibonacci resistance zones hold.
If you enjoy this idea, don’t forget to LIKE 👍, FOLLOW ✅, SHARE 🙌, and COMMENT ✍! Drop your thoughts and charts below to keep the discussion going. Your support helps keep this content free and reach more people! 🚀
--------------------------------------------------------------------------------------------------------------------
Disclosure: I am part of Trade Nation's Influencer program and receive a monthly fee for using their TradingView charts in my analysis.

EUR/USD Bearish Setup: Supply Zone Rejection Toward1.0900 Target(Swing Trade Setup)
📉 Trendline + CHoCH Confirmation
🔻 Downtrend marked by a falling blue trendline.
🔄 CHoCH (Change of Character) shows a bearish market structure shift, confirmed by a lower low.
🟦 Supply Zone (Sell Zone)
💥 Strong seller reaction previously occurred between:
1.12956 – 1.13896
🔹 Wait for price to retrace into this zone.
🎯 Ideal for short entries.
🎯 Entry & Stop-Loss
🔵 Entry Point: Around 1.12956 – 1.13005
(below supply zone and EMA)
🛑 Stop Loss: 1.13896 – 1.13929
(above the last high + supply zone)
🟦 EMA 70 (Purple Line)
📈 Currently at 1.13051
Acts as dynamic resistance — strengthening the short setup.
🏁 Target Zone
🎯 Main Target: 1.09000
Marked as TARGET POINT 1.0900
🟦 Support Levels Inside Target Zone:
1.09229
1.09150
1.08814
✅ Summary of Trade Idea
📍 Short Position
⬆️ Entry: ~1.13000
🛑 Stop Loss: ~1.13900
⬇️ Take Profit: ~1.09000
⚖️ Risk-to-Reward: ~1:3+ potential
