EURUSD setting up for next leg upHi there
Dxy is setting up for a big drop as all safe havens have been crashing this past months, with JPY going to new lows, CHF taking the same road, the next is USD, which will send euro to 1.30+ target.
Dont miss this long
Eurusdshort

EURUSD Short We have broken an up trend on eurusd, I expect this pair to fall towards highlighted area, SELL!!

Day ShortKing W. Harbmayg's Journal Entry#11
Primary— “High & Low Approach”
Day Trade
1. Thesis:
Short
2. Performance: (1 out of 5)
Confidence— 5
Discipline— 5
Communication— 5

Interday ShortKing W. Harbmayg's Journal Entry#12
Primary— “High & Low Approach”
Interday Trade
1. Thesis:
Short
2. Performance: (1 out of 5)
Confidence— 5
Discipline— 5
Communication— 5

Day ShortKing W. Harbmayg's Journal Entry#13
Primary— “High & Low Approach”
Day Trade
1. Thesis:
Long
Short
2. Performance: (1 out of 5)
Confidence— 4
Discipline— 4
Communication— 4

EURUSD - Daily Analysis Bearish Pole Flag PatternEURUSD in a Bearish Trend and now it's foam a Bearish Flag Pattern. For Trade plan wait for to break the neckline. If it's break then open a Sell Trade.

EUR USD SHORTRisk 0.5%
TP1 = 1:2 RR
Disclaimer:
The contents in this Idea are intended for information purpose only and do not constitute investment recommendation or advice. Nor are they used to promote any specific products or services. They serve as an integral part of a case study to demonstrate fundamental concepts in risk management under given market scenarios. A full version of the disclaimer is available in our profile description.

EUR / USD - Done with the Long, now Short with the trendTarget achieved on the previous position, now we risk it for the biscuit and we go short in line with the overall structure after the reaction on this supply zone.

EURUSDHello traders, EURUSD is setting up for a downside move watch EURUSD in a mentioned area with your own according strategy and look for a short position opportunity.
This is just analysis
GOOD LUCK & GOOD TRADING

eurusd full analysis -- great setupafter the price made liquidity sweep
the price now rejected the supply area
now we expect more continuation to the downside
the only confirmation for selling is to break the support level
_____________________________________________________________
don't forget your risk management
follow for more :))

Eurusd short 2nd QuarterEURUSD is currently bullish, which should continue for a while, A break of price action would push price lower, creating lower lows and lower highs below the 1.0500 mark. As such, the bearish run can only mature after the break of the trendline and lows extending towards the 1.0000 mark. Sell single at critical points, preferably the round figures, and anticipate increased volatility and momentum beyond these price points. Fundamentals coinciding with these levels will be an added advantage since price will make major moves in shorter periods of time.


; Chart: H1EURUSD UPDATE: SELLThere is already the break of structure and the price is making lower high and lower low.

EURUSD [SELL]SL - 1.09334
TP - 1.05227
EURUSD broke the trend line and showing the trend change from Bullish to Bearish.
SELL opportunity still open.


EURUSD sellEURUSD breakout its trend line and showing the trend change from bullish to bearish. Better to look sell opportunity on every resistance you got.

EURUSD | Bearish Trend | DownsideHigher highs and higher lows are terms used in technical analysis to describe a pattern of price movements in a financial market or asset.
Higher highs refer to a pattern where each new high price in a trend is higher than the previous high price. This indicates that the market is experiencing an upward trend and that buyers are willing to pay increasingly higher prices for the asset.
Higher lows, on the other hand, refer to a pattern where each new low price in a trend is higher than the previous low price. This indicates that the market is experiencing an upward trend and that buyers are continuing to step in at higher and higher prices, creating a pattern of higher support levels.
Together, higher highs and higher lows can be indicative of an uptrend in the market, while lower highs and lower lows would indicate a downtrend. These patterns are commonly used by traders to identify trends and make trading decisions.

Best zone for short in Eurusdwe had a bullish choch in the daily timeframe, so if i want to take a risk and if i want to open a short position (with a low probability of activation), I will do so from the two specified areas and i avoid getting short on gaps, because the trend is bullish (in the bigger timeframe(daily))
GoodLuck everyone.

EURUSD, Can the bears get a lower highEURUSD / 1D
Hello traders, welcome back to another market breakdown.
Bears want a reversal from a lower high major trend reversal or a double top second leg down.
I'm watching closely to see what the bears can offer.

eurusd short here is my eurusd short idea
its based on
we been bullish on this pair since 16th march, creating daily higher highs higher lows, clearly bullish
usd very strong now, eur weakening
we are early in the london session
may we see an bounce back to the weekly pivot for a retest ?
yellow line represent first take profit 50 pips
im thankful to see how this setup plays out

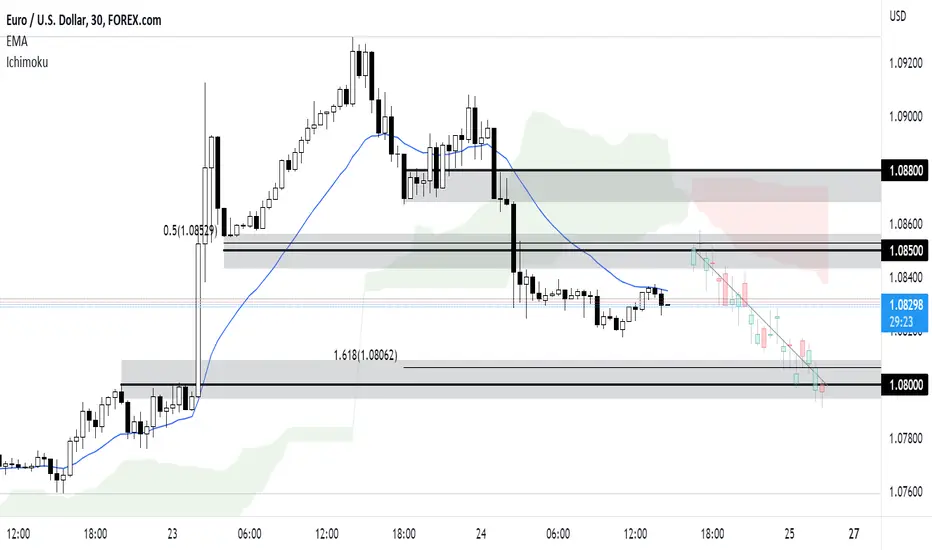
Bearish outlook on EURUSD - 24 March 2023Prices are testing a key resistance zone at 1.0850 on the M30 timeframe. A pullback to this zone, which coincides with the 50% Fibonacci retracement, could present the opportunity to ride the drop to the support zone at 1.0800, which is in line with the 161.8% Fibonacci extension. Price is holding below the 20 EMA and Ichimoku cloud, supporting our bearish bias.
EURUSDI am looking to short EURUSD on one of the RED areas. I am waiting for a distribution on 1 min Time frame, the entry will be on that TF. I will update my entry and the stop loss here on the comments. I would prefer an entry on the 8:30 NY time. Stay tuned!

EURUSD ShortI am seeing that EURUSD met its resistance and will start to have selling pressure.
However, if EURUSD break its resistance, we should start to take long position for EURUSD.
