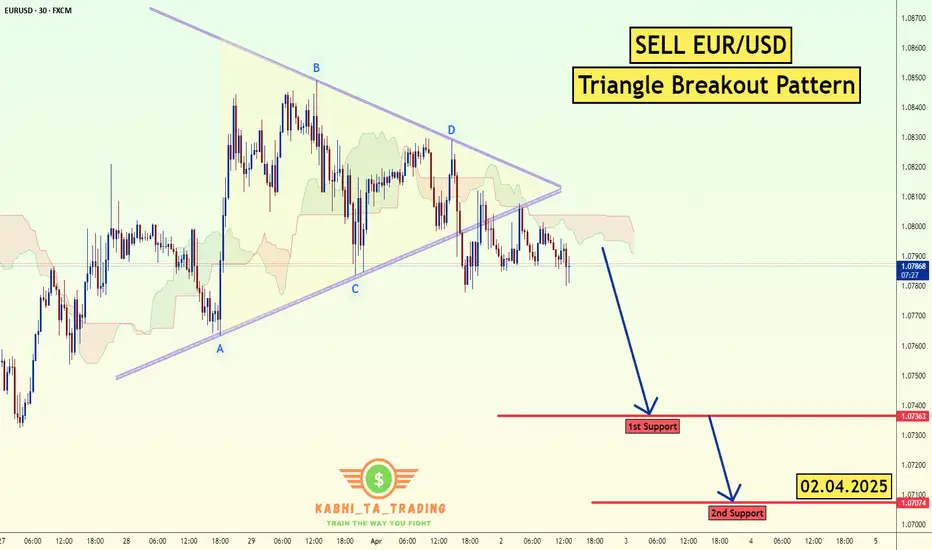
EUR/USD Triangle Breakout (02.04.2025)The EUR/USD Pair on the M30 timeframe presents a Potential Selling Opportunity due to a recent Formation of a Triangle Breakout Pattern. This suggests a shift in momentum towards the downside in the coming hours.
Possible Short Trade:
Entry: Consider Entering A Short Position around Trendline Of The Pattern.
Target Levels:
1st Support – 1.0736
2nd Support – 1.0707
🎁 Please hit the like button and
🎁 Leave a comment to support for My Post !
Your likes and comments are incredibly motivating and will encourage me to share more analysis with you.
Best Regards, KABHI_TA_TRADING
Thank you.
Eurusdshort
EURUSD - what’s next?Here is our in-depth view and update on EURUSD . Potential opportunities and what to look out for. This is a long-term overview on the pair sharing possible entries and important Key Levels .
Alright first, let’s take a step back and take a look at EURUSD from a bigger perspective.
After making such a huge upside move, we are expecting EURUSD to have some sort of a correction or a pullback to the downside. After that we got a sell off on EURUSD and just today we hit the 50% correction level at around 1.08442 . After failing to break to the upside we can expect more sells to be in play. Any breaks to the downside from the current price will confirm this. Although TVC:DXY is not as strong at the moment, it still is a global reserve currency . We seen that in play last week when we saw massive upside on OANDA:XAUUSD and on TVC:DXY . We must understand that investors are also pouring their money into DXY as it is a global reserve currency. I still personally believe TVC:DXY holds more strength against TVC:EXY hence why I am still looking to short the pair.
Scenario 1: SELLS from current price
With the instant sell, we are risking a possible pullback and continuations to the upside however, DXY is looking like it will reverse. Failing to break to the upside can also be taken as a confirmation for potential sells.
Scenario 2: BUYS at the break of the Key Level (around 1.085)
With the break to the upside, we can expect more buys to come in play possibly targeting previous highs on EURUSD at around 1.09444.
KEY NOTES
- DXY possible reversal to the upside.
- Breaks above the KL and to the upside would confirm higher highs.
- EURUSD has completed the 50% correction to the upside.
- DXY is the global reserve currency.
Happy trading!
FxPocket

EUR/USD Double Top Analysis - Bearish Reversal Trade Setup This analysis highlights a Double Top pattern forming on the EUR/USD 4-hour timeframe, which is a classic bearish reversal pattern. The pattern signals a potential shift from a bullish trend to a downtrend, providing traders with a well-defined entry, stop loss, and target levels.
1. Understanding the Double Top Pattern
A Double Top is a trend reversal pattern that forms after an extended uptrend. It consists of two peaks (Top 1 and Top 2) at approximately the same resistance level, followed by a break below the neckline (support level), confirming the pattern.
Pattern Breakdown:
Top 1 & Top 2: These peaks represent failed attempts to break higher, showing strong selling pressure at resistance.
Support (Neckline): The price found support at a key level, where buyers initially stepped in, but eventually, this level was broken, triggering a potential downtrend.
2. Key Levels & Trading Setup
📌 Resistance Level (Bearish Rejection Zone)
The resistance level is marked in the 1.09500 - 1.09600 range.
Price action tested this zone twice (Top 1 & Top 2) but failed to sustain above it.
The repeated rejection indicates that sellers are dominant in this zone.
📌 Support Level (Neckline Breakout Confirmation)
The support level is marked in the 1.07700 - 1.07800 zone.
The price bounced off this area initially, but later broke below it, confirming a bearish move.
The breakout suggests selling momentum is increasing.
3. Trading Strategy – Bearish Setup
🔴 Entry Point (Sell Trigger)
A short trade is confirmed when the price breaks below the neckline (support level) after forming the Double Top.
The breakout confirms seller dominance and signals potential downside movement.
🚨 Stop Loss Placement
Stop Loss is placed slightly above the resistance level at 1.09575.
This ensures protection against false breakouts or price retracements.
🎯 Target (Take Profit Projection)
The price target is calculated based on the height of the Double Top pattern.
Target Level: 1.06639, aligning with the measured move from the resistance to the neckline.
4. Market Outlook & Risk Management
📉 Bearish Scenario (High Probability Move)
✔️ The market structure shows a strong bearish reversal with price failing to break above resistance.
✔️ The confirmed neckline break indicates sellers have taken control.
✔️ If the price continues lower, we can expect a move toward 1.06639.
📈 Bullish Scenario (Invalidation of Trade)
❌ If price closes back above resistance (1.09575), it would invalidate the bearish setup.
❌ This would indicate that buyers are regaining control, and the trade setup should be re-evaluated.
5. Final Thoughts & TradingView Tags
Summary of Trading Setup:
✅ Pattern: Double Top (Bearish Reversal)
✅ Sell Entry: Below the support neckline
✅ Stop Loss: Above 1.09575
✅ Target: 1.06639
✅ Risk-Reward Ratio: Favorable
📌 Tags for TradingView Idea:
#EURUSD #DoubleTop #ForexTrading #BearishReversal #SupportResistance #PriceAction #TechnicalAnalysis #ForexSetup #TradingStrategy

EURUSD Short IdeaTrade entered. Entry rules met.
Confluences:
✅ Bearish overall bias
✅ Bearish demand zone
✅ Bearish impulse crab pattern
✅ Bearish divergence
✅ Bearish break of structure
✅ Entering London close zone
✅ Price is in entry zone
✅ Required risk:reward met
⭐ I shared this watch zone in my weekly forex outlook this week, you can subscribe by clicking the link in my bio.

EURUSD Trading: Unveiling the Precise Strategy GuideAfter last week's decline, the euro against the US dollar started to recover at the beginning of this week and is currently trading within the positive range around 1.0850.
According to the Wall Street Journal, the White House is adjusting its tariff policy set to take effect on April 2nd. It may cancel a series of tariffs targeting specific industries and instead impose reciprocal tariffs on countries with significant trade relations with the US. Affected by this news, during the European morning session, US stock index futures rose by 0.8% to 1.0%.
On the 4 - hour chart in the European morning session on Monday, the Relative Strength Index (RSI) indicator climbed to 50, indicating that the recent bearish momentum has dissipated to some extent.
In terms of the upward direction, the 50 - period Simple Moving Average (SMA) forms an interim resistance level at 1.0880, followed by 1.0900. If the euro - US dollar pair can firmly stand above this level, the next resistance level may be at 1.0950.
EURUSD Trading Strategy:
buy@1.08200-1.08500
tp:1.08900-1.09300
I will share trading signals every day. All the signals have been accurate for a whole month in a row. If you also need them, please click on the link below the article to obtain them.

EUR/USD: Bearish Reversal Potential at Fibonacci LevelEUR/USD daily chart provides a nice short opportunity. The pair recently experienced a retracement as part of an extended downtrend, reaching the 70.00% Fibonacci retracement level and facing resistance at the 1.09957/1.09947 level. A confluence of technical variables in this way can serve as a potential reversal point and resumption of the underlying bearish trend.
Trading Strategy:
Entry: Sell short EUR/USD at or near the prevailing price (1.08361) on confirmation of bearish price action such as a rejection candle off the resistance point.
Stop Loss: Place a stop-loss order above the new high (1.12142) or at a judiciously chosen resistance level to manage risk.
Take Profit: Look for the following support levels as probable take-profit points:
1.07323
1.07286
1.06794

EURUSD Maintains Bearish Momentum - Is 1.07500 the Next Target?OANDA:EURUSD is trading within a well-defined descending channel, with price action consistently respecting both the upper and lower boundaries. Recently, the price rejected a key resistance zone, reinforcing bearish momentum and signaling a potential continuation toward lower levels.
The current price action suggests that if price continues to respect this resistance, we could see further downside toward 1.07500, aligning with the lower boundary of the channel. However, if price breaks above the channel and sustains above it, the bearish outlook may be invalidated, potentially signaling a shift in momentum. Monitoring price action and volume at this level will be essential for confirmation.
Just my take on support and resistance zones—not financial advice. Always confirm your setups and trade with solid risk management.
Best of luck!

Fri 21st Mar 2025 EUR/USD Daily Forex Chart Sell SetupGood morning fellow traders. On my Daily Forex charts using the High Probability & Divergence trading methods from my books, I have identified a new trade setup this morning. As usual, you can read my notes on the chart for my thoughts on this setup. The trade being a EUR/USD Sell. Enjoy the day all. Cheers. Jim

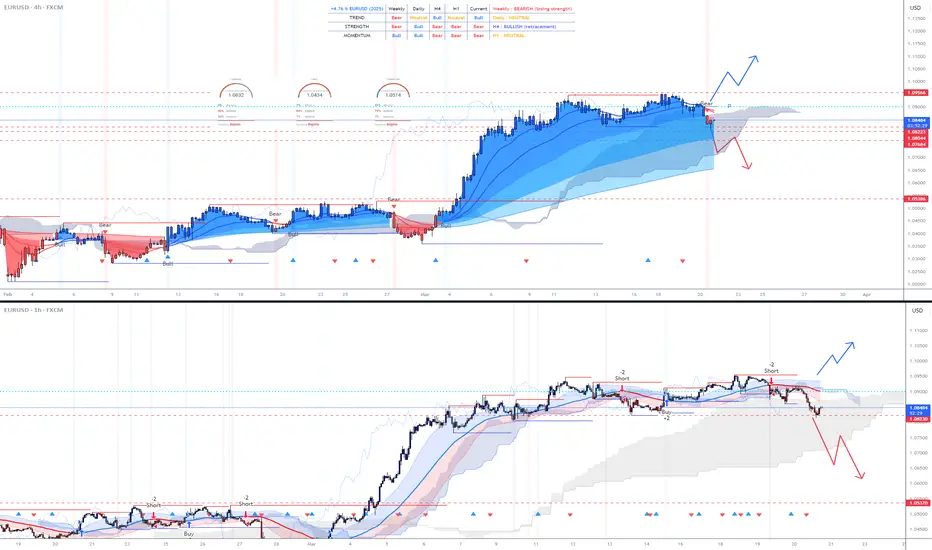
EURUSD: What does mathematics say about its trend?EURUSD pair!! What can we expect from its trend in the coming weeks? It's common knowledge that the euro has strengthened significantly since March 3rd, as the chart clearly shows. What has this been due to? Multiple factors (Trump, USD technical decline, tariffs, manipulation, etc.). But what's important for a trader? Knowing the direction in the coming weeks. If we look at the surveys (shown in the chart), 90% of traders believe that the EURUSD will go down. And us? What do we think...
---> Let's analyze the chart to think mathematically and forget about surveys and people's opinions because that's how a profitable trader should think, like a bot!
Mathematically, it's clear: BEARISH in the long term and BULLISH in a RECUMBENT PHASE or LOSING STRENGTH in the short term. In the chart above (H4), we clearly see that the trend is bullish, but that it has begun to retreat and break through key support zones. And if we look at the chart below (H1), the price is entering a POSSIBLE TREND CHANGE ZONE! If it breaks through the gray zone, the EURUSD WILL DROP STRONGLY!
With this data and the SURVEY... What would you think as a TRADER? That the EURUSD WILL DROP IN THE COMING WEEKS, and therefore, we must be prepared for possible short entries.
---> But is this opinion reliable yet? From my point of view, when the trend on the H1 chart turns bearish (Bear), I would enter short without hesitation, but NOT BEFORE! The volatility due to tariffs can MANIPULATE MATHEMATICS and therefore give us FALSE SIGNALS. And the fault won't lie with math, but with market manipulation, because math works perfectly in a stable market, but when there are people (Mr. TRUMP) who manipulate everything, ANYTHING CAN HAPPEN IN A MATTER OF HOURS OR MINUTES :-).
In short, we clearly see a BEAR PHASE in the EURUSD, which is also in favor of its weekly trend, so it could be strong and take us back to the 1.05000 zone.
Best regards, and I will update the PAR information in the coming days.
EURUSD SHORT Sell until 38.2% fibboEURUSD Sell until 38.2% fibbonacci level on daily timeframe. Moreover the RSI created Bearish divergence on H4 timeframe.

EUR USD Trade Setup Daily Timeframe EUR USD has tapped on a Daily supply level that also acted as a strong resistance level in the past.
So we will be looking for selling opportunities from the lower timeframe.

EURUSD at Key Resistance Level – Will Sellers Step In?OANDA:EURUSD has reached a key resistance level, marked by prior price rejections, suggesting strong selling interest. This area has previously acted as a key supply zone, increasing the likelihood of a bearish reversal if sellers step in.
If bearish signals emerge, such as rejection wicks, bearish candlestick patterns, or signs of weakening bullish pressure, I anticipate a move toward the 1.07400 level. However, a clear breakout above this resistance could challenge the bearish outlook and open the door for further upside. It's a pivotal area where price action will likely provide clearer clues on the next direction.
Just my take on support and resistance zones, not financial advice. Always confirm your setups and trade with a proper risk management.

EUR/USD Triangle Pattern (13.3.25)The EUR/USD Pair on the M30 timeframe presents a Potential Selling Opportunity due to a recent Formation of a Triangle Pattern. This suggests a shift in momentum towards the downside in the coming hours.
Possible Short Trade:
Entry: Consider Entering A Short Position around Trendline Of The Pattern.
Target Levels:
1st Support – 1.0805
2nd Support – 1.0771
🎁 Please hit the like button and
🎁 Leave a comment to support for My Post !
Your likes and comments are incredibly motivating and will encourage me to share more analysis with you.
Best Regards, KABHI_TA_TRADING
Thank you.

EURUSDEURUSD has gotten to the Daily OB where we are looking for possible reversal confirmations. And here on the 15mins - price has Changed Character and also confirmed with a new BOS, before the BOS, we can see how price has reacted, creating even more liquidity - equal highs close to our entry zone which is above 50% fib retracement. I am looking to short price from the 1.09048 zone targeting the 1.08416 zone where we have a possible roadblock for price to stop and continue the buys on the 1H TF, or sell all the way to the 1.06068 zone to facilitate a new buys.

What to do after you missed a big price move (Example: EUR/USD)There was a big fast move in EUR/USD last week.
The ‘European currencies’ did especially well versus the US dollar, including GBP/USD and USD/CHF as well as the ‘Skandies’ SEK/USD and NOK/USD.
If you rode the move, then job done. If you did ride the move up, you might have taken full profits already - or maybe you are leaving a little bit of the position open to ride any continuation of the move.
But, what to do if you missed it completely?
Explosive moves in the market usually mean traders who were on the ‘losing’ side step out for a while, having lost confidence in their view. For example if you were bearish and the market makes a significant move higher - you’re probably going to be a lot less confident in your bearish view - but perhaps also not ready to take an opposite bullish view. The loss of sellers in the market can see the up-move continue with minimal pullback.
This might suggest buying any small dips to ride the next leg higher, and emotionally it would offer some salvation to capture the second leg of the move even if you missed the first leg. However, what you are doing here is ‘chasing the market’.
One trouble is that after a big move in the market, there is no definitive place to put your stop loss, except at the beginning of the move - which is now far away. That's a bad risk: reward.
It is tempting to place a closer (more manageable) stop loss under lower timeframe levels of support - but then you find yourself trading an unknown strategy that requires different rules to follow because it is based on a lower timeframe.
And indeed, after a sharp move in the market - there is still a chance for a sharp pullback to match. Why? Because buyers quickly take profits on their unexpected quick gains, which will create selling pressure into minimal support - because the next support level is far away.
A sharp pullback would mean an opportunity to buy into the uptrend at a lower level, closer to the previous support. But then the flipside of the sharp pullback is that it raises questions over the sustainability of the initial move.
Probably the biggest takeaway here is not to think about this ‘explosive’ move in isolation.
Instead of forcing a trade, consider:
1. Waiting for the right setup in the same market. If your strategy is based on structured breakouts, wait for the next clean consolidation or pattern before re-engaging. A big move often leads to a new setup—but forcing a trade in the middle of a volatile move isn’t a strategy, it’s FOMO.
2. Looking at uncorrelated markets. Just because EUR/USD already made a big move doesn’t mean you have to trade it now. If you want to be in at the start of a move, shift focus to another market that hasn’t yet made its move.
3. Sticking to your edge. If your strategy works over hundreds of trades, don’t abandon it just because one market moved without you. The next opportunity will come—if not in this market, then in another.
Again, the best trades don’t come from reacting to what already happened, but from positioning for what’s about to happen. If you missed the move, accept it, reset, and wait for the next high-quality setup—whether in the same market or somewhere else.

EURUSD IDEA : SHORTS | SELL (07/03/25)This is a theory. I believe price on the weekly is clearly over extended. With the NFP incoming, it may seek to fall from here especially with a clear setup occurring on the W TF. I believe price to be bearish at this point, having interacted on the weekly POI - Please look at the charting before making any decisions, and let me know what you think of it.
N.B.: This is not financial advice. Trade safely and with caution.

EURUSD Approaching Key Resistance – Will Sellers Step In?OANDA:EURUSD is approaching a significant resistance zone, highlighted by previous price reactions and strong selling interest. This area has historically acted as a supply zone, where sellers have stepped in, leading to notable price reversals. The current price action suggests a potential bearish reaction if the resistance holds.
If sellers maintain control, we could see a decline toward the 1.03940 level, which represents a logical target based on the current market structure. Confirmation signals—such as a bearish engulfing candle, rejection wick, or increased selling volume—would strengthen the bearish outlook.
However, if the price breaks above this resistance zone and sustains momentum, the bearish outlook may be invalidated, signaling a potential shift in favor of buyers.
Monitoring how price reacts to this zone is crucial for identifying entry opportunities. As always, applying proper risk management is essential given the potential for volatility.
Just my take on support and resistance zones—not financial advice. Always confirm your setups and trade with solid risk management.
Best of luck!

EUR/USD: Is History Repeating? Key Levels to Watch NowHey Realistic Traders, Will FX:EURUSD Repeat its Bearish Cycle? Let’s dive into the analysis...
On the H4 chart, EUR/USD is trading below the 200-day EMA once again, signaling that the bearish trend is still in play. This downward movement has been reinforced by a rising wedge breakout, a common pattern that often leads to further declines.
Just a few days ago, we spotted a similar bearish breakout in FX:EURUSD , which resulted in a continued drop. As traders, we follow the Dow Theory principle: "History Repeats Itself ." Based on this idea, we expect the price to follow the same pattern, keeping the bearish momentum intact.
Looking ahead, EUR/USD could move lower toward the first target at 1.02861 and, if selling pressure continues, potentially reach the second target at 1.02205. These targets are based on previous price movements and key historical support levels.
However, this bearish scenario depends on the price staying below the critical stop-loss level at Stop Loss 1.05039
Support the channel by engaging with the content, using the rocket button, and sharing your opinions in the comments below.
Disclaimer: “Please note that this analysis is solely for educational purposes and should not be considered a recommendation to take a long or short position on FX:EURUSD ”.

Fri 28th Feb 2025 EUR/USD Daily Forex Chart Sell SetupGood morning fellow traders. On my Daily Forex charts using the High Probability & Divergence trading methods from my books, I have identified a new trade setup this morning. As usual, you can read my notes on the chart for my thoughts on this setup. The trade being a EUR/USD Sell. Enjoy the day all. Cheers. Jim

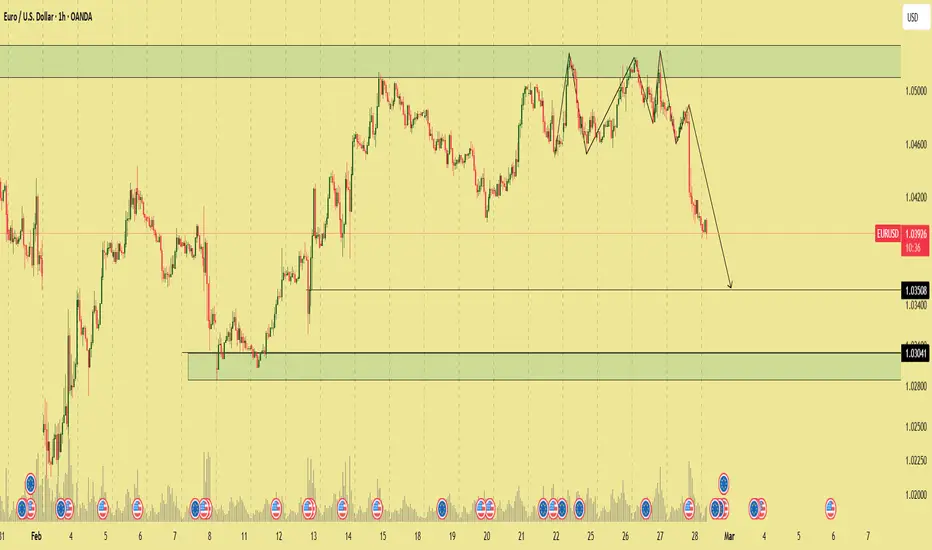
EUR/USD confirms the downtrend.EUR/USD confirms the downtrend.
Current targets are 1.03508 and 1.03041
where the previous strong buying pressure was concentrated.
Wait to sell until the target is reached
#EURUSD
EUR/USD - H1- Chart - Ascending Triangle (27.02.2025) The EUR/USD Pair on the H1 timeframe presents a Potential Selling Opportunity due to a recent Formation of a Triangle Breakout Pattern. This suggests a shift in momentum towards the downside in the coming hours.
Possible Short Trade:
Entry: Consider Entering A Short Position around Trendline Of The Pattern.
Target Levels:
1st Support – 1.0433
2nd Support – 1.0405
🎁 Please hit the like button and
🎁 Leave a comment to support for My Post !
Your likes and comments are incredibly motivating and will encourage me to share more analysis with you.
Best Regards, KABHI_TA_TRADING
Thank you.

EUR/USD at a Crossroads: Will Trade Tensions Push It Lower? EUR/USD has been struggling to maintain momentum above the 1.0500 mark, facing renewed selling pressure as macroeconomic and geopolitical factors influence sentiment. With the US Dollar regaining strength and concerns about European economic stagnation growing, the pair remains vulnerable to further downside.
Technical Analysis:
Resistance Levels: 1.0532 (January 27 high), 1.0629 (December peak), 1.0744 (200-day SMA).
Support Levels: 1.0405 (55-day SMA), 1.0282 (February 10 low), 1.0209 (February 3 low), and 1.0176 (January 13 YTD low).
Indicators: The Relative Strength Index (RSI) is near 55, indicating modest momentum, while the Average Directional Index (ADX) remains around 15, suggesting a weakening trend.
Moving Averages: The 200-day SMA at 1.0744 serves as a key dynamic resistance, while the 55-day SMA at 1.0405 acts as interim support.
Fundamental Analysis:
Several key fundamental factors are exerting downward pressure on EUR/USD:
Trade Policy Uncertainty: While US tariff tensions have temporarily eased, lingering trade disputes, including a 10% duty on Chinese imports and potential EU-targeted tariffs, keep investors cautious.
Diverging Central Bank Policies: The Federal Reserve remains firm on keeping interest rates elevated, while the European Central Bank has begun rate cuts, signaling weaker economic confidence in the Eurozone.
Economic Growth Divergence: The US economy continues to show resilience with robust labor markets and stable inflation, while the Eurozone faces stagnation and potential contraction, particularly in Germany.
European Political Risks: Uncertainty in Germany and wider Eurozone economic struggles add to the Euro’s bearish outlook, making it less attractive compared to the US Dollar.
The EUR/USD pair is at a critical juncture, with key support levels in focus. Trade policies, central bank divergence, and economic growth disparities continue to drive market sentiment. This week is pivotal for the Eurozone, with key economic data releases culminating in Friday’s PMI figures, which could determine the pair’s next major move. Traders should remain cautious and closely monitor both technical and fundamental developments.
Note: Please remember to adjust this trade idea according to your individual trading conditions, including position size, broker-specific price variations, and any relevant external factors. Every trader’s situation is unique, so it’s crucial to tailor your approach to your own risk tolerance and market environment.

Euro / U.S. Dollar
Hello Dear Traders
Euro Analysis
Based on the DXY analysis, which is bullish, I present to you the updated analysis for the Euro. I have identified the suitable selling area on the 1-hour timeframe. We are in a downward structure on the 4-hour timeframe, while the minor 1-hour chart is bullish. By obtaining confirmation from the 1-hour chart—validated by breaking the CHoCH—we can utilize this area of the Secret Order Block (1H) for entering a sell position.
Again, in the selling area, a 5-minute confirmation can help us optimize our entry into the trade.
First Support: 1.04494
1-Hour Liquidity: 1.03731
Potential Suitable Buying Area: 1.02720, which I will update once the price reaches this level.
Thank you for your support and companionship, dear friends.
Wishing you all success!
Fereydoon Bahrami
A retail trader in the Wall Street Trading Centre (Forex)
Risk Disclosure:
Trading in the Forex market is risky due to high price volatility. This analysis is solely my personal opinion and should not be considered financial advice. Please do your own research. You are responsible for any profits or losses resulting from this analysis.
