DeGRAM | EURUSD breakout📊 Technical Analysis
● Breakout – candles have closed twice above the channel roof (black), then retested 1.1690 as support (blue circled zone); the pull-back printed higher-lows along the intraday trend-line, confirming a bullish transition.
● The flag forming beneath 1.1750 measures toward the confluence of the July swing high and rising fork top at 1.1810; invalidation rests at the last swing-low 1.1615.
💡 Fundamental Analysis
● Euro sentiment improves after Euro-area core CPI edged up to 2.9 % y/y while soft US durable-goods orders trimmed 2-yr Treasury yields, narrowing the rate gap.
✨ Summary
Buy 1.1685-1.1700; hold above 1.169 targets 1.175 ➜ 1.181. Exit on an H1 close below 1.1615.
-------------------
Share your opinion in the comments and support the idea with a like. Thanks for your support!
Eurusdsignal

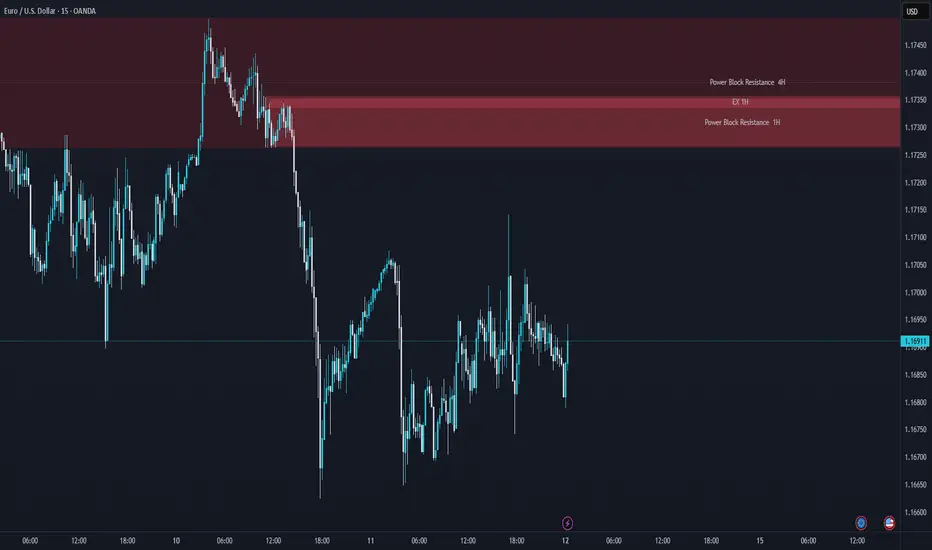
DeGRAM | EURUSD in the consolidation zone📊 Technical Analysis
● Price broke the month-long bearish channel and is now basing inside the 1.165-1.169 consolidation block; repeated intraday retests (blue zone) turn the former cap into fresh support.
● A steep hourly up-sloper is carving successive higher-lows; its width and the prior channel depth project follow-through toward 1.1745 (mid-July pivot) with room to the next swing line at 1.1800.
💡 Fundamental Analysis
● FXStreet highlights softer US PMIs and a pull-back in 2-yr yields, while ECB sources flag “data-dependent patience” rather than imminent cuts—narrowing the short-rate gap and favouring the euro.
✨ Summary
Long 1.1650-1.1680; hold above the blue base targets 1.1745 ➜ 1.1800. Long view void on an H1 close below 1.1615.
-------------------
Share your opinion in the comments and support the idea with a like. Thanks for your support!

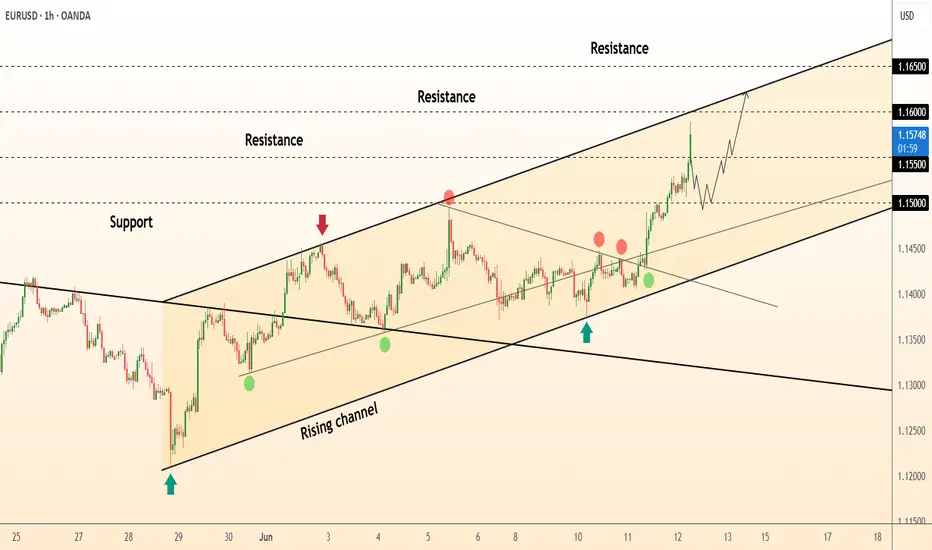
DeGRAM | EURUSD moving in an ascending channel📊 Technical Analysis
● Bulls punched through the 11-day descending trend-line (circled “breakout”) and immediately based on it, keeping the rising 30-min channel of higher-lows intact.
● The next confluence lies at 1.1665 where the channel mid-line meets the prior swing top; clearance unlocks the upper band / July supply at 1.1692-1.1700.
💡 Fundamental Analysis
● Friday’s slide in US 2-yr yields after soft existing-home-sales and mixed Fed speak trims dollar carry, while pre-ECB-meeting sources stress “data-dependent patience,” limiting euro downside.
✨ Summary
Long 1.1635-1.1650; hold above 1.1665 targets 1.1692 → 1.1700. Bias void on an H1 close below 1.1615.
-------------------
Share your opinion in the comments and support the idea with a like. Thanks for your support!

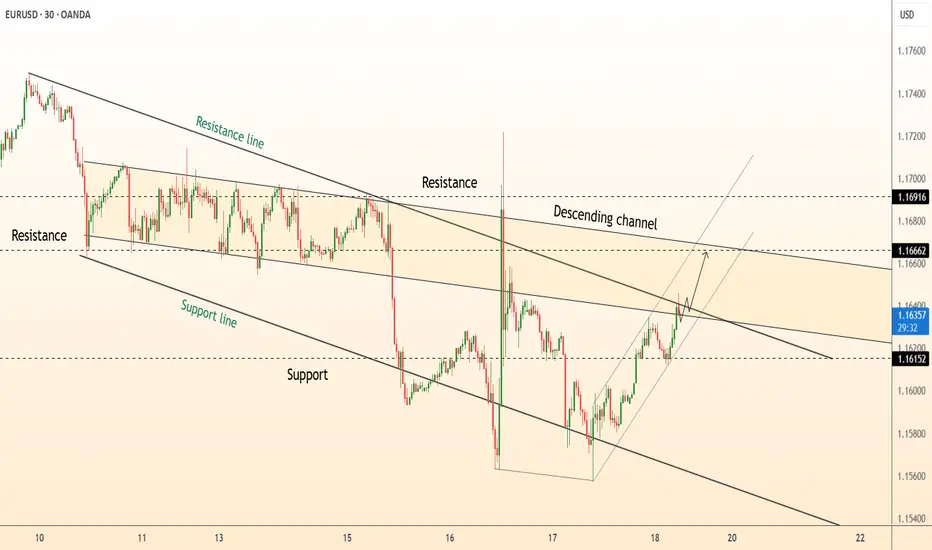
DeGRAM | EURUSD reached the resistance line📊 Technical Analysis
● EUR/USD has reclaimed the inner resistance of the 8-day descending channel after a V-shaped rebound from the lower rail; candles are now riding a fresh micro up-sloper.
● A 30 min close above 1.1666 (channel roof / prior pivot) confirms trend reversal and projects the measured move to the higher congestion band at 1.1690-1.1700.
💡 Fundamental Analysis
● Yesterday’s dip in US 2-yr yields after weaker Philly-Fed new-orders and higher jobless claims softens dollar demand, while ECB minutes signalled no rush to ease further, supporting the euro.
✨ Summary
Long 1.1630-1.1650; break of 1.1666 targets 1.1690 → 1.1700. Invalidate on an H1 close below 1.1585.
-------------------
Share your opinion in the comments and support the idea with a like. Thanks for your support!
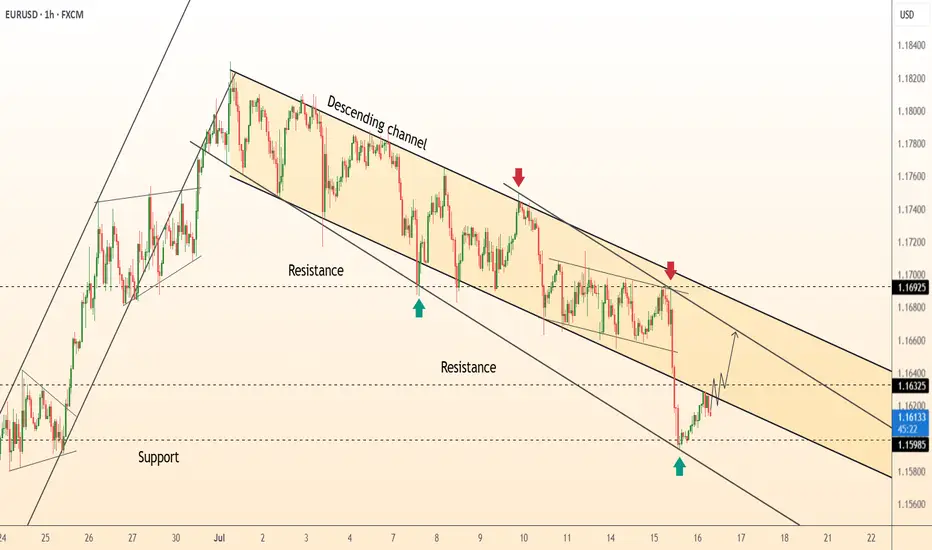
DeGRAM | EURUSD rebound from the trend line📊 Technical Analysis
● Price printed a hammer and bullish RSI divergence on the lower rail of the 3-week descending channel (green arrow 1.1598), breaking the inner wedge that guided last leg down.
● First resistance is the channel mid-line / prior pivot 1.1632; a move through it exposes the upper band near 1.1692, where July supply and the larger bearish trend-line converge.
💡 Fundamental Analysis
● Softer US retail-sales control-group and Daly’s “more evidence needed” remarks cooled 2-yr yields, trimming dollar support, while ECB’s Knot said additional cuts “are not imminent,” limiting euro downside.
✨ Summary
Long 1.1600-1.1620; hold above 1.1632 targets 1.1690. Long view void on an H1 close below 1.1580.
-------------------
Share your opinion in the comments and support the idea with a like. Thanks for your support!
DeGRAM | EURUSD fixed under the resistance level📊 Technical Analysis
● Price is stalling against the upper band of a three-month rising channel (≈ 1.1790) after producing a false break and quick rejection—marking a potential bull-trap at trend resistance.
● Bearish divergence on the 4 h RSI and the first lower-high inside a micro rising wedge suggest momentum is fading; a slide through 1.1745 should trigger profit-taking toward the mid-channel support at 1.1595.
💡 Fundamental Analysis
● Solid US payrolls and a hawkish tone in FOMC minutes lift two-year yields, reviving the dollar bid, while post-election coalition wrangling in France keeps a risk premium on the euro.
✨ Summary
Sell 1.1785 ± 15 pips; break below 1.1745 targets 1.1595. Invalidate on a 4 h close above 1.1810.
-------------------
Share your opinion in the comments and support the idea with a like. Thanks for your support!

EUR/USD –Bullish Flag After Long Term Trend Shift: Is 1.20 Next?📌 In my previous EUR/USD analysis, I mentioned that the long-term trend likely reversed, and we could see a move toward the 1.23 zone in the medium to longer term.
That view is playing out.
Recently, the pair printed a new local high above 1.18, confirming the trend change.
📉 After this rise, EUR/USD pulled back –but the structure is clearly corrective: overlapping and a classic bullish flag formation.
What's next?
This correction looks close to completion, and bulls may soon return to push toward the key 1.20 level.
Trading Plan:
The 1.1620–1.1650 area stands out as a strong confluence zone – ideal for looking for buying opportunities.
The trend has changed. The setup is forming. Now it’s about timing.
Disclosure: I am part of TradeNation's Influencer program and receive a monthly fee for using their TradingView charts in my analyses and educational articles.

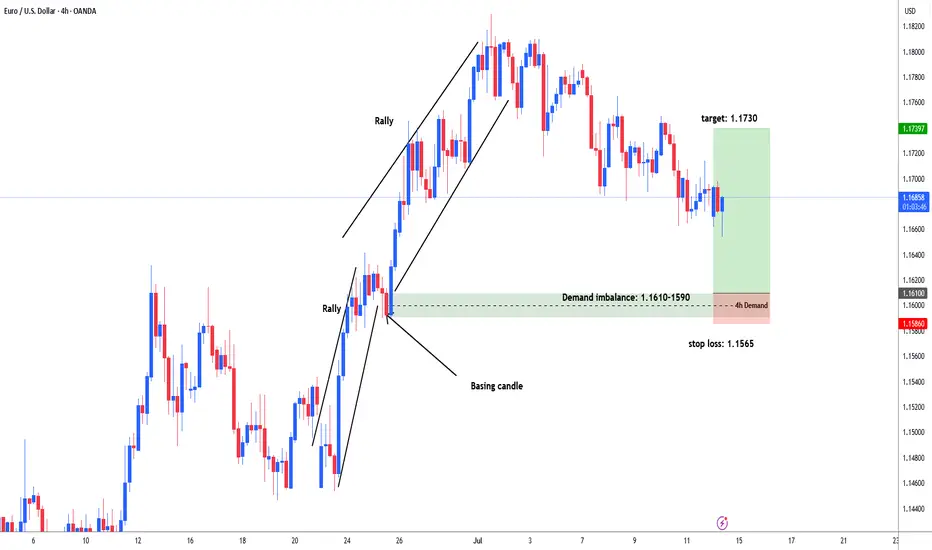
EURUSD possible long from 1.1610 area for 1.1730#eurusd market rallied 1.1450 - 1.1640. then consolidation between 1.1580-1640 area. Institutions put more buy orders and price rallied again after bases out and reached upto 1.1830 area. Now market sell off / retracement to test demand area to fill the remaining unfilled order for another leg higher. Demand zone: 1.1610-1.1590. stop loss: 1.1565, target: 1.1730. in weekly and daily chart market forming distribution shape for big sell opportunity.
Bearish Signal | Technical + Custom AlgoSmart Trend Signal | Technical Analysis + Custom Algorithm
This signal is the result of a combination of classic technical trend analysis and a proprietary software I personally developed.
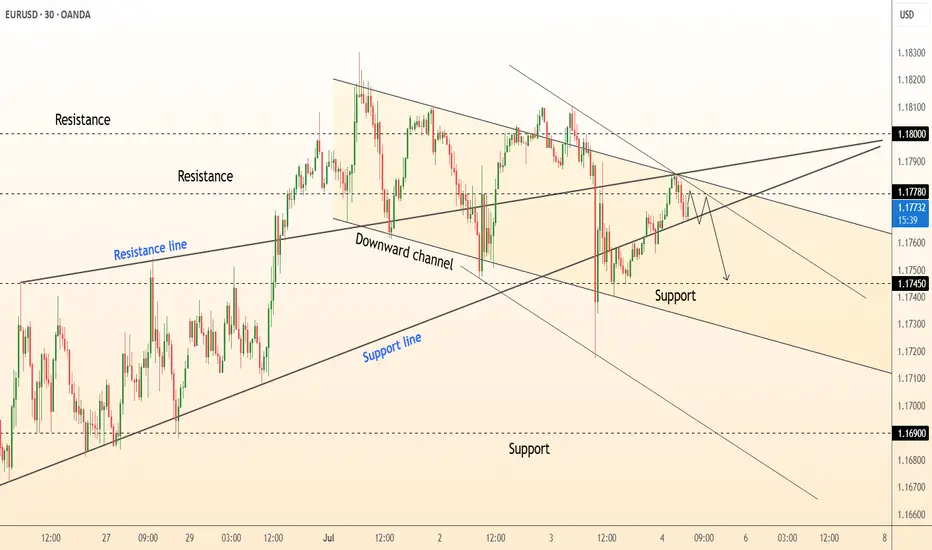
DeGRAM | EURUSD downturn in the channel📊 Technical Analysis
● Price is capped by a confluence of the June-July down-sloping channel roof and the former median resistance line at 1.1780; the last three candles form lower highs inside a micro bear-flag.
● Intraday structure now leans on the 1.1745–1.1750 support cluster: a break beneath this shelf completes the flag and exposes the channel floor/June pivot at 1.1690.
💡 Fundamental Analysis
● Pre-NFP dollar demand is rebuilding as ADP and ISM-services beat consensus, while French election uncertainty revives euro risk premium.
✨ Summary
Sell 1.1775 ± 5 pips; sustained trade below 1.1745 targets 1.1690. Short thesis void if 30-min candle closes above 1.1800.
-------------------
Share your opinion in the comments and support the idea with a like. Thanks for your support!
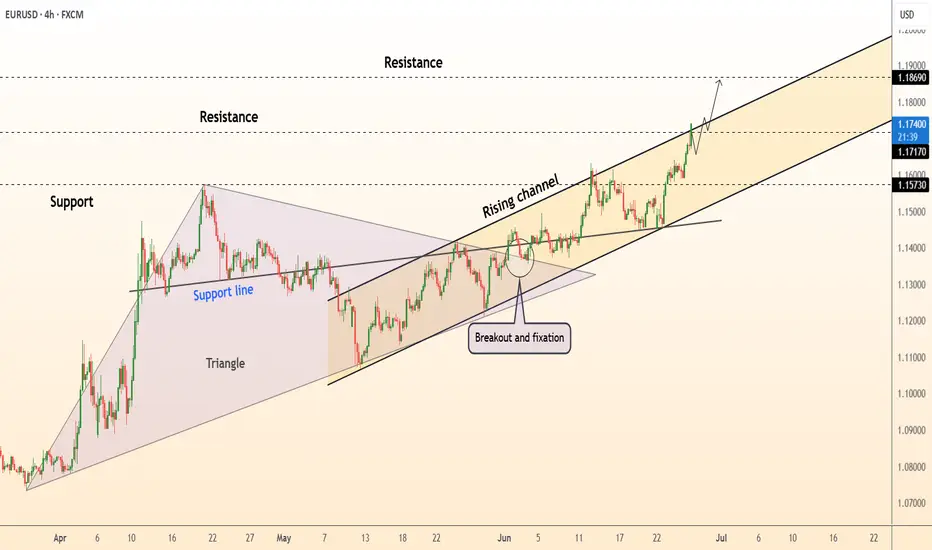
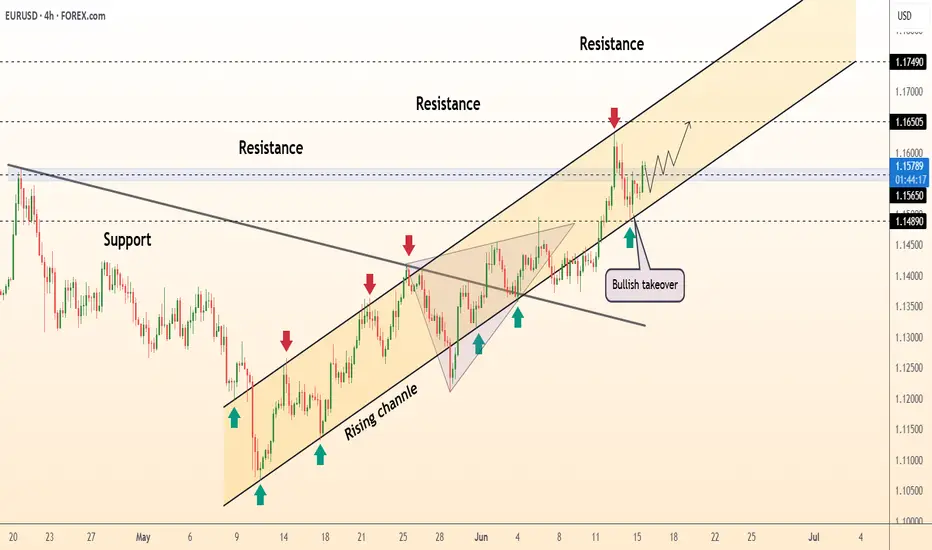
DeGRAM | EURUSD will continue to grow rapidly📊 Technical Analysis
● Euro keeps hugging the upper rail of the 3-month rising channel after re-testing the broken April triangle top as support, confirming fresh trend acceleration.
● Momentum is unbroken – every 4 h pullback since 17 Jun has held above the inner trend-line (now 1.1717); measured channel height points to the next fib / horizontal cluster at 1.1869.
💡 Fundamental Analysis
● Softer US durable-goods orders and slowing housing data cooled 2-yr yields, while ECB speakers signalled no rush to ease again; the short-rate gap narrowed for a third session, underpinning EUR strength.
✨ Summary
Buy dips ≥1.1717; upside targets 1.1800 then 1.1869. Bull view void on a 4 h close below 1.1600.
-------------------
Share your opinion in the comments and support the idea with a like. Thanks for your support
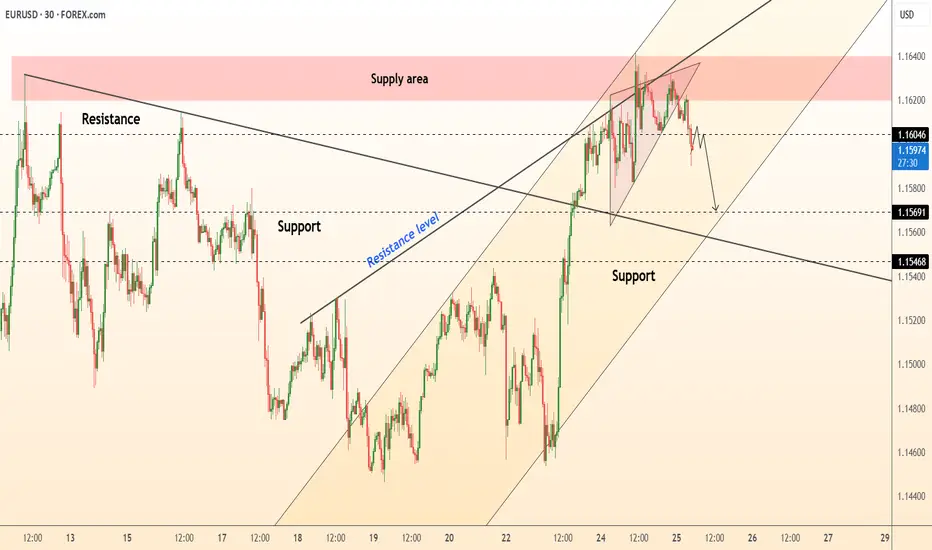
DeGRAM | EURUSD reached the supply area📊 Technical Analysis
● Price formed an intraday rising wedge right inside the 1.1615-1.1635 supply band; the wedge has broken lower and the last two candles closed back under the long-term trendline retest.
● Bearish follow-through is favoured while price stays below 1.1604; first magnet is the confluence of former breakout base and inner channel support at 1.1569, with 1.1547 (mid-June pivot) the next objective.
💡 Fundamental Analysis
● Fresh Euro-area PMIs dipped below consensus while U.S. consumer-confidence beat, widening the short-rate gap and reviving USD bids.
✨ Summary
Sell rallies ≤1.1600; targets 1.1569 → 1.1547. Bias invalid if 30-min candle closes above 1.1635.
-------------------
Share your opinion in the comments and support the idea with a like. Thanks for your support
EURUSD Short Part IIEURUSD Analysis
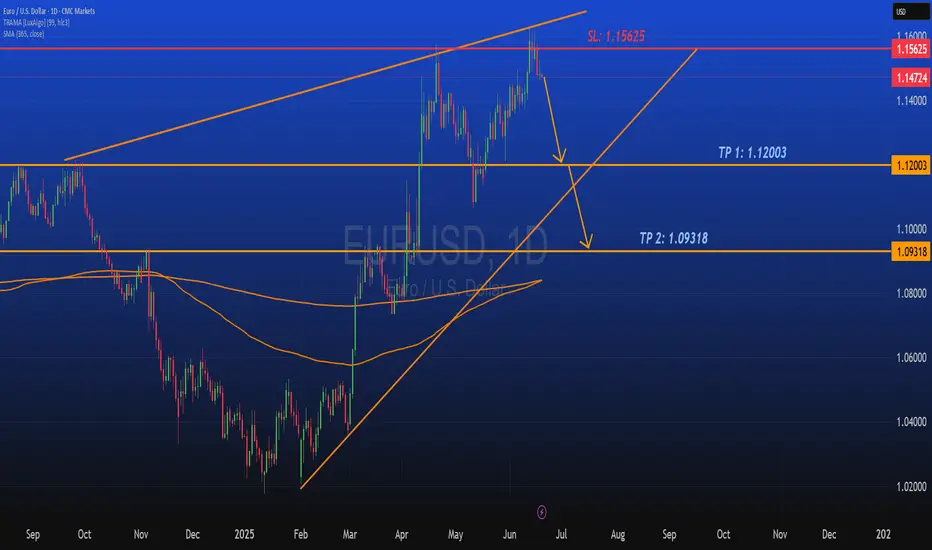
On EURUSD daily chart from CMC Markets quota, indicates a bullish trend with a symmetrical triangle pattern forming. The price has recently broken above a key resistance level, suggesting potential for continued upward movement.
Key Price Levels
Current Price: 1.16932
Stop Loss (SL): 1.16549
Take Profit 1 (TP1): 1.12003
Take Profit 2 (TP2): 1.09318
Trend Analysis
EURUSD shows clear signs on an ascending trend supported by higher lows and higher highs since early 2025. Both orange trend-lines which I created form a symmetrical triangle, with the price nearing the apex, hinting at a potential breakout or reversal which I have been looking for a reversal bearish breakout.
The upward momentum is strong, but the proximity to the upper trend-line and set take-profit levels indicates preparation for a possible correction. I still believe in shorts on EURUSD.
Conclusion
Traders and investors should monitor the price action near the triangle apex for breakout confirmation. The set stop loss and take-profit levels provide a structured approach to managing the trade, balancing potential gains with risk mitigation. Stay tuned for more updates on the trade.

EURUSD Sell/ShortFundamental Analysis
EURUSD rates is being influenced by the current Eurozone's economic performance, driven by key economies like Germany and France, continues to be shaped by industrial output, consumer confidence, and inflation trends. The European Central Bank (ECB) has likely maintained a cautious monetary policy, with interest rates possibly held steady or adjusted slightly to combat inflation while supporting growth. On the U.S. side, the Federal Reserve's stance on interest rates, potentially in a tightening phase to address persistent inflation plays a critical role. Recent U.S. economic data, including GDP growth, employment figures, and consumer spending, may indicate a robust dollar, putting downward pressure on EURUSD. Additionally, geopolitical tensions, energy prices (affecting Eurozone energy imports), and trade balances between the U.S. and EU are likely contributing to volatility. Given the current date, recent ECB and Fed statements or data releases for June 2025 inflation reports.
Technical Analysis:
Based on the provided EURUSD 1D chart (covering mid-2024 to mid-2025), the following technical observations can be made:
Trend and Moving Averages:
For EURUSD it shows a descending trend from a peak around 1.48 in mid-2024, with a potential reversal or consolidation forming in mid-2025. The 50-day and 200-day moving averages (depicted as orange lines) are sloping downward, with the price recently testing these levels around 1.12-1.13. A break above the shorter-term moving average could signal bullish momentum, while a failure to hold might confirm a continuation of the downtrend. Looking for key support levels here are identified at 1.09318 (TP 2) and 1.08000, with the current price hovering near 1.12003 (TP 1). Resistance is notable at 1.15625 (SL) and the previous high near 1.4800. The price action suggests a potential bounce from the recent low, with the next target being the resistance zone around 1.15625 if bullish momentum persists. Candlesticks and volume patterns are showing a recent green candlesticks indicate buying pressure, potentially forming a reversal pattern near the 1.12 level. Volume analysis would confirm the strength of this move, with higher volume on upticks supporting a breakout.
Overall Bias:
The technical setup suggests a short-term bullish correction within a broader bearish trend, contingent on breaking and holding above 1.15625. A drop below 1.09318 would invalidate the bullish case and resume the downtrend toward 1.08000 or lower.
Sentiment Analysis
Market sentiment as of June 2025 likely reflects heightened interest in EUR/USD due to recent economic data and central bank policies. Traders and analysts are closely watching for signs of ECB rate cuts or Fed rate hikes, which could sway the pair. On social platforms and financial forums, there may be a mix of caution and optimism looking out for caution due to the Eurozone's economic challenges (energy costs, political uncertainty), and optimism if U.S. data softens, weakening the dollar. The chart's visibility on trading platforms suggests retail and institutional traders are actively monitoring this pair, with a focus on the 1.12-1.16 range as a critical decision point. Sentiment could shift rapidly based on upcoming economic releases or geopolitical developments.
Conclusion
The EUR/USD pair is at a pivotal juncture, with fundamentals pointing to a stronger USD due to Fed policy, while from a technical standpoint suggest a short-term bounce toward 1.15625 if support at 1.12003 holds. Sentiment indicates active trader interest, with eyes on central bank moves. A break above resistance could target 1.4800 (long-term), while a failure might see a decline to 1.08000. Monitor upcoming data for confirmation.
DeGRAM | EURUSD reached the resistance level📊 Technical Analysis
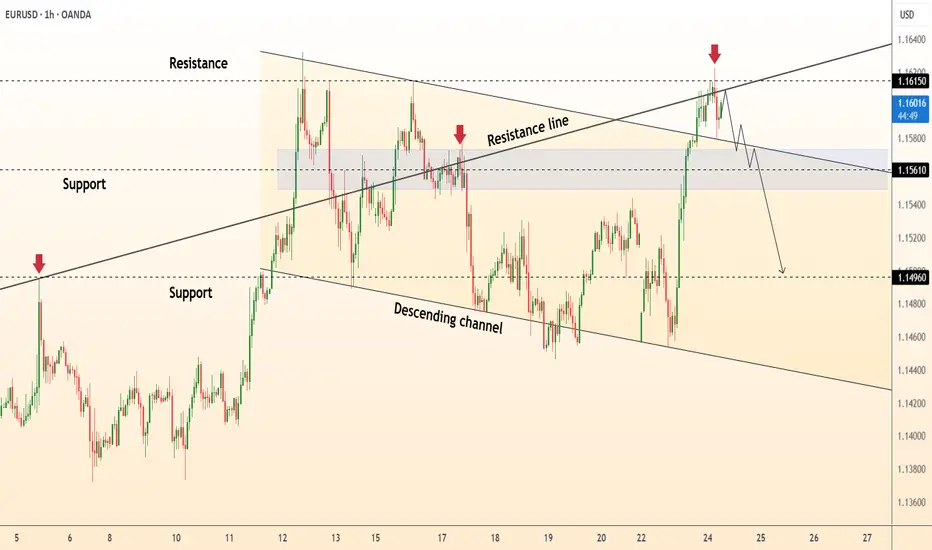
● Price has spiked into the confluence of the long-term channel roof (≈1.1615) and a steeper resistance line, printing a rejection candle and bearish divergence on the 1 h RSI.
● The move leaves a lower high versus 13 Jun and snaps the micro up-sloper; a slide back inside the grey 1.1560-1.1520 supply should accelerate toward the mid-June swing floor at 1.1490.
💡 Fundamental Analysis
● Hotter US S&P-global PMIs rekindled Fed “higher-for-longer” chatter, lifting two-year yields and the DXY, while French election uncertainty widens Bund-Treasury spreads—both pressuring EUR.
✨ Summary
Fade rallies 1.1580-1.1610; sustained trade beneath 1.1560 targets 1.1520 ➜ 1.1490. Bearish view void on an hourly close above 1.1630.
-------------------
Share your opinion in the comments and support the idea with a like. Thanks for your support
DeGRAM | EURUSD growth in the channel📊 Technical Analysis
● The chart for EURUSD, as indicated in the upper right corner, displays a classic descending wedge pattern, which is typically a bullish reversal signal. Price action has respected the wedge’s lower boundary multiple times, forming a series of higher lows while sellers failed to push the pair below the 1.0670 support zone. The most recent candles show a decisive breakout above the wedge’s upper trendline, accompanied by increased volume, suggesting that buyers are regaining control. This breakout is further validated by the RSI indicator, which has moved out of oversold territory and is now trending upward, confirming the shift in momentum.
● The technical setup is reinforced by the presence of a horizontal resistance level at 1.0750, which has acted as a magnet for price in previous attempts. The chart also highlights a bullish engulfing pattern on the daily timeframe, signaling strong demand and a potential continuation toward the next resistance at 1.0820. The moving averages are beginning to converge, with the shorter-term MA crossing above the longer-term MA, a classic bullish crossover that often precedes sustained upward movement. These factors collectively point to a high-probability scenario for further gains in the EURUSD pair.
💡 Fundamental Analysis
● Recent fundamental developments support the bullish technical outlook. Over the past two days, the Federal Reserve has maintained its policy rate, but forward guidance has hinted at a possible rate cut later this year, which has weighed on the US dollar. Meanwhile, the European Central Bank has adopted a more cautious stance, with the probability of a near-term rate cut decreasing as inflation data remains sticky in the eurozone. Additionally, easing geopolitical tensions in the Middle East and stable US retail sales have reduced safe-haven demand for the dollar, further supporting the euro’s advance.
✨ Summary
● A confirmed breakout above the descending wedge and bullish momentum indicators suggest a long entry on EURUSD above 1.0750, targeting 1.0820. The bullish scenario remains valid as long as price holds above the 1.0670 support. A close below this level would invalidate the setup and call for a reassessment of the trend.
-------------------
Share your opinion in the comments and support the idea with a like. Thanks for your support
DeGRAM | EURUSD reached the resistance level📊 Technical Analysis
● Bulls defended the rising-channel mid-line (≈1.1480), turning it into support and snapping the intraday falling wedge; hourly closes now print higher highs above the reclaimed 1.1520 pivot.
● A tight bull flag is forming against 1.1560; its 1.618 swing coincides with the upper rail / 1.1617 resistance, keeping the channel’s momentum bias pointed north.
💡 Fundamental Analysis
● Softer US housing starts and a slide in 2-yr yields pulled the DXY to two-week lows, while ECB’s Knot warned “premature cuts risk inflation flare-ups,” widening the short-rate gap in the euro’s favour.
✨ Summary
Long 1.1515-1.1530; flag break >1.1560 targets 1.1617, stretch 1.1670. Bias void on an H1 close below 1.1480.
-------------------
Share your opinion in the comments and support the idea with a like. Thanks for your support
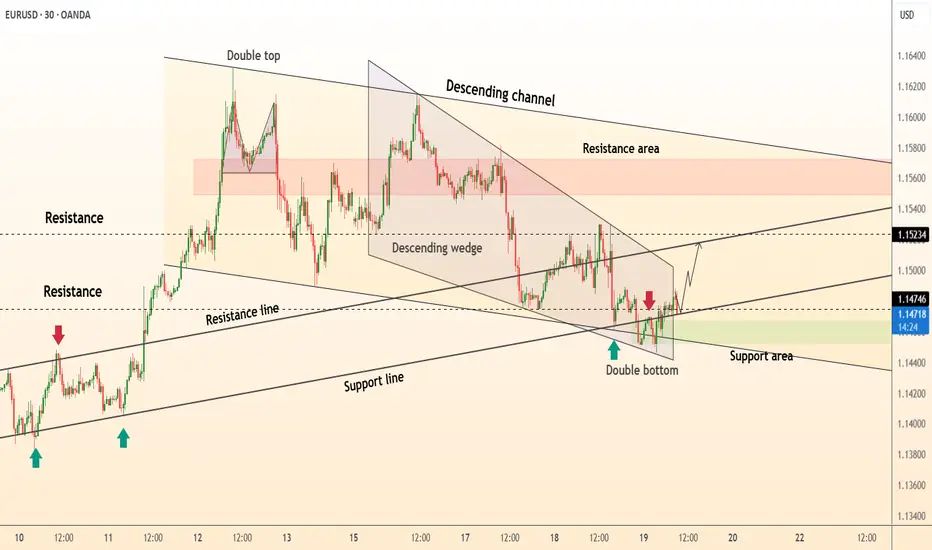
DeGRAM | EURUSD double bottom📊 Technical Analysis
● The price is currently testing the upper resistance of a descending wedge pattern after forming a clear double bottom formation. This double bottom occurred precisely at a confluence of support, where the long-term ascending support line intersects with the lower boundary of the wedge, indicating a strong potential for a bullish reversal from the 1.1450-1.1470 area.
● This recent bullish price action follows a prior "double top" pattern that initiated the corrective move downwards into the current wedge. A decisive breakout and hold above the wedge's resistance would invalidate the recent bearish pressure and confirm that buyers are taking control, with the first significant target being the horizontal resistance line near 1.1523.
💡 Fundamental Analysis
● Market attention is centered on the upcoming U.S. Federal Reserve policy meeting. While no rate change is expected, forward guidance is key. Current market sentiment, as noted by analysts at RoboForex and FreshForex, is pricing in the possibility of a Fed rate cut later this year, which could place downward pressure on the US Dollar.
● Conversely, the Euro is finding support from a comparatively hawkish European Central Bank (ECB). Recent reports indicate that the probability of an ECB rate cut has diminished, suggesting a policy divergence that favors EUR strength against the USD, underpinning the technical case for a move higher.
✨ Summary
Long entry on a confirmed 30-minute candle close above the descending wedge resistance (~1.1485); initial target 1.1523 → 1.1560. The bullish outlook is invalidated on a close below the double bottom support at 1.1450.
-------------------
Share your opinion in the comments and support the idea with a like. Thanks for your support
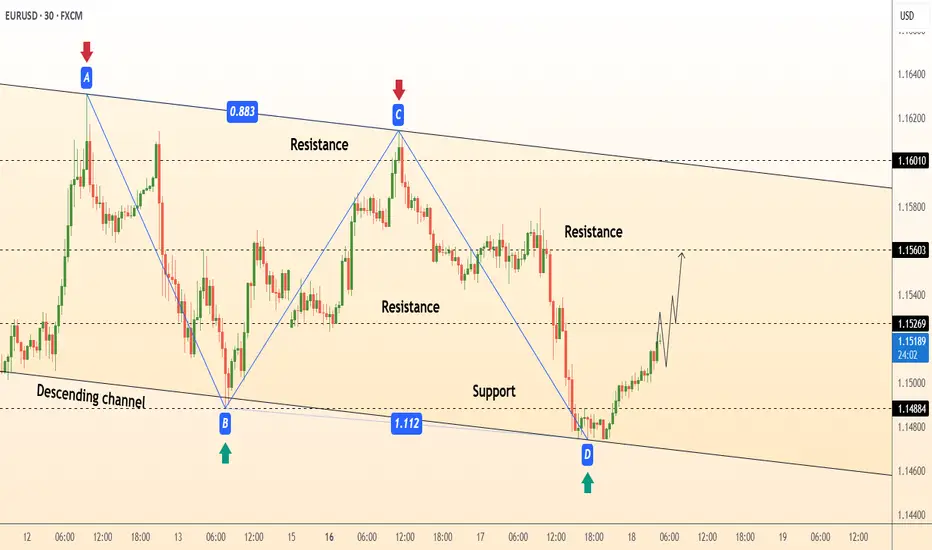
DeGRAM | EURUSD rebound from the lower boundary of the channel📊 Technical Analysis
● A completed AB=CD (0.883 / 1.112) pattern at the channel floor (1.1488) produced a hammer, signalling exhaustion of bears at the measured PRZ.
● Price is now reclaiming the micro structure high 1.1526; that flips the inner range to support and opens the next intra-channel pivot 1.1560, with room to the upper wall near 1.1600.
💡 Fundamental Analysis
● EZ May trade balance swung back to a €4 bn surplus while weak US housing starts shaved another 4 bp off 2-yr yields, compressing the short-rate gap and underpinning EUR bids.
✨ Summary
Buy 1.1500-1.1530; break >1.1560 targets 1.1600, stretch 1.1650. Bull bias void on 30 min close below 1.1480.
-------------------
Share your opinion in the comments and support the idea with like. Thanks for your support!
Opportunity for selling EURUSDI see that EURUSD has confirmed strong resistance, so I took a sell trade with it.

DeGRAM | EURUSD fixed above the lower boundary of the channel📊 Technical Analysis
● Euro keeps stair-stepping along the inner trend-line of the 2-month rising channel; each dip to the line (green arrows) is met with higher lows, confirming firm demand around 1.1485-1.1500.
● Friday’s break back above the former wedge cap turned 1.1550 into support; clearing the last swing high at 1.1605 would expose the channel median / fib cluster at 1.1650, with the upper rail near 1.1745 as an extension.
💡 Fundamental Analysis
● Softer US retail-sales and a slump in NY Fed manufacturing pulled Treasury 2-yr yields under 4.70 %, while ECB speakers warned that further cuts “are not a given,” narrowing the rate gap and reviving euro bids.
✨ Summary
Long 1.1520-1.1560; hold above 1.1550 targets 1.1650 ➜ 1.1745. Bias void on an H4 close below 1.1480.
-------------------
Share your opinion in the comments and support the idea with like. Thanks for your support!
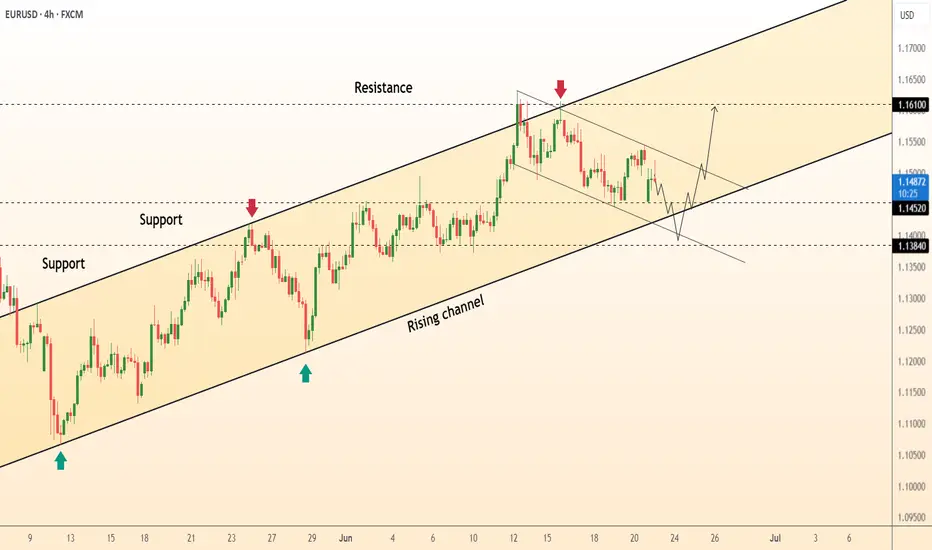
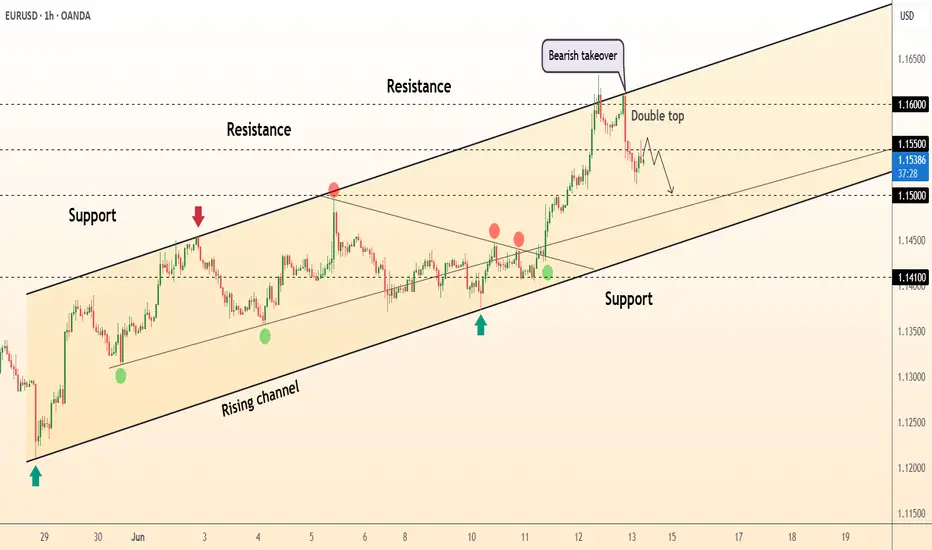
DeGRAM | EURUSD formed the double top📊 Technical Analysis
● A double-top printed at the channel roof (≈ 1.1600) and a bearish engulfing candle signal exhaustion; price is slipping back inside last week’s inner trend-median, turning 1.1550 into fresh resistance.
● Hourly RSI diverged lower and the grey return line from 1 June has broken; pattern depth points to 1.1500 support, with the channel mid-band / former triangle apex near 1.1470 as the next magnet.
💡 Fundamental Analysis
● Post-CPI profit-taking meets cautious ECB rhetoric: Lagarde reiterated “no preset easing path,” yet money-markets still price two Fed cuts by year-end, inviting near-term dollar reprieve.
✨ Summary
Short 1.1540-1.1560; break below 1.1520 targets 1.1500 → 1.1470. Bear view void on an H1 close above 1.1600.
-------------------
Share your opinion in the comments and support the idea with like. Thanks for your support!
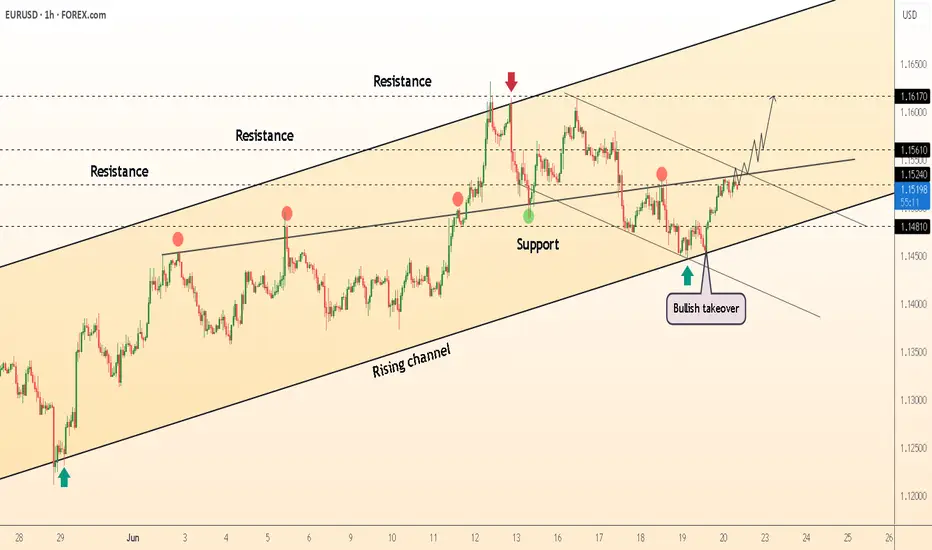
DeGRAM | EURUSD above the 1.15📊 Technical Analysis
● Hourly close above 1.1500 completed a small ascending triangle; price is now hugging the rising-channel’s upper rail after a chain of higher-lows, pointing toward the 1.1600 objective.
● Triangle top and channel mid-line overlap at 1.1500-1.1520; while candles stay above, risk : reward favours a push to the next fib / upper parallel near 1.1650.
💡 Fundamental Analysis
● US core-CPI eased to 0.1 % m/m, driving Treasury yields lower and lifting September Fed-cut odds >70 %, weakening the dollar, while ECB officials talked up a “data-dependent” pause, keeping euro bids firm.
✨ Summary
Long bias while price holds 1.1520; targets 1.1600 then 1.1650. Invalidate on an hourly close below 1.1470.
-------------------
Share your opinion in the comments and support the idea with like. Thanks for your support!