EURUSD → BUY SIGNALBuy opportunity in the FX:EURUSD with a target at 1.09715 for a profit of 20 pips.
Eurusdsignal

EURUSD : Long Trade , 4hHello traders, we want to check the EURUSD chart. The price is moving in an ascending channel and has pulled back to the specified support level after failing to break the resistance level. If the price cannot break this support level and stabilize itself above this level, we expect the price to grow again to the specified resistance level. Good luck.

EURUSD → SELL SIGNALSell opportunity in the FX:EURUSD with a target at 1.09600 for a profit of 20 pips.

EURUSD → BUY SIGNALBuy opportunity in the FX:EURUSD with a target at 1.09650 for a profit of 20 pips.
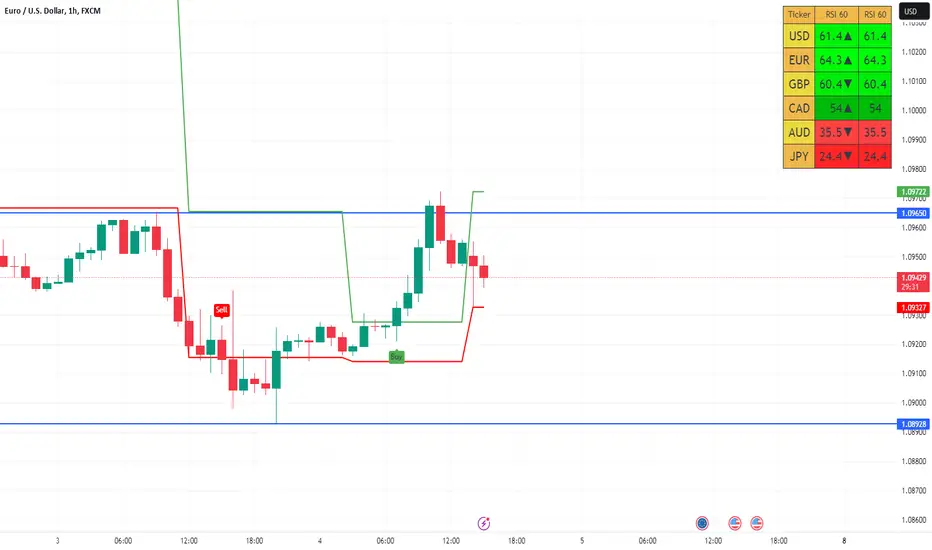
EURUSD M15 / STRUCTURE CHANGE, LONG OPPORTUNITY ✅Hello Traders1
This is my idea related to EURUSD M15. We can see a structure change in the chart, I still see DXY as weak, that's why I expect an increase of EURUSD until the price of 1.10000.
Traders, if you liked my idea or if you have a different vision related to this trade, write in the comments. I will be glad to see your perspective.
____________________________________
Follow, like, and comment to see my content:
www.tradingview.com

EURUSD → SELL SIGNALSell opportunity in the FX:EURUSD with a target at 1.09000 for a profit of 20 pips.

EURUSD → SELL SIGNALSell opportunity in the FX:EURUSD with a target at 1.09387 for a profit of 20 pips.

EURUSD (H4) Sell now (1.1113)OANDA:EURUSD EURUSD (H4) Sell now (1.1113)
Stop loss at 1.11450
TP 1 at 1.10430
TP 2 at 1.10100
Divergence of RSI
Note: Capital management 2%

EURUSD : Long Trade , 4hHello traders, we want to check the EURUSD chart. The price is moving in an ascending channel and has reached a resistance level, and after failing to break this level, it is pulling back to the support level. We expect the price to maintain this level and the price to grow again to the specified resistance level. Good luck.

EURUSD → SELL SIGNALSell opportunity in the FX:EURUSD with a target at 1.10450 for a profit of 30 pips.

EURUSD Bullish on 4HR Market is in Up Trend and after Fib 50% retracement making a cup and handle patter its going to make an upside move again. It breaks its key resistance Level. You can take a Buy trade with proper risk management

EURUSD → BUY SIGNALBuy opportunity in the FX:EURUSD with a target at 1.10400 for a profit of 20 pips.

🗺️EURUSD Roadmap🗺️🏃 EURUSD is moving near the 🔴 Heavy Resistance zone($1.11850-$1.0980) 🔴,the Resistance lines .
🌊According to Elliott wave theory , EURUSD is completing Corrective Waves in the 1-hour time frame.
🌊The structure of correction waves is Zigzag(ABC/5-3-5) type.
🔔I expect EURUSD to start falling to 🎯 Target 🎯, 🟢 Support zone($1.0800-$1.0756) 🟢 and Uptrend line .
Euro/U.S.Dollar Analyze ( EURUSD), 1-hour Time frame ⏰.
Do not forget to put Stop loss for your positions (For every position you want to open).
Please follow your strategy; this is just my idea, and I will gladly see your ideas in this post.
Please do not forget the ✅' like '✅ button 🙏😊 & Share it with your friends; thanks, and Trade safe.

EURUSD → BUY SIGNALBuy opportunity in the FX:EURUSD with a target at 1.10030 for a profit of 15 pips.

EURUSD → SELL SIGNALSell opportunity in the FX:EURUSD with a target at 1.09350 for a profit of 30 pips.

EURUSD → BUY SIGNALBuy opportunity in the FX:EURUSD with a target at 1.09900 for a profit of 30 pips.

EURUSD → SELL SIGNALSell opportunity in the FX:EURUSD with a target at 1.09000 for a profit of 25 pips.

EURUSD possible drop to support levelThe downward trend for EURUSD is anticipated to persist, having peaked at 1.10 last week before a rapid retreat.
The failure to breach this resistance level for the second time signals robust downward pressure against bullish movements. Although short-term corrections may occur in the upcoming week, the overall outlook favors a decline. The potential liquidity and turning point for EURUSD are projected to be around the 1.78 mark.

💡 EURUSD: Waiting for the opportunity to sellEURUSD rebounded strongly in the past session, broke the upper boundary of the accumulation zone and created a reversal pattern on H4, but the overbought phenomenon is occurring. We can place a Sell Limit order at the above resistance area

EURUSD and GBPUSD Top-down analysis Hello traders, this is a complete multiple timeframe analysis of this pair. We see could find significant trading opportunities as per analysis upon price action confirmation we may take this trade. Smash the like button if you find value in this analysis and drop a comment if you have any questions or let me know which pair to cover in my next analysis.

EURUSD → SELL SIGNALSell opportunity in the FX:EURUSD with a target at 1.08800 for a profit of 80 pips.

EURUSD → SELL SIGNALSell opportunity in the FX:EURUSD with a target at 1.08500 for a profit of 30 pips.

💡 EURUSD: Continued declineEURUSD continues to fall sharply and has had six consecutive losing sessions. By this time, more oversold signals have appeared. In addition, the 1.075 resistance zone is also an important resistance zone. Please pay attention to observe the signs. Price behavior here, if there is a signal of price increase, you can consider buying again. In case it is broken, the price will likely adjust sharply down, towards the resistance area around the 1.0500 threshold.
