EUR/USD – Bearish Setup with Potential Drop Toward 1.1285 and 1.EUR/USD is showing signs of exhaustion near the 1.1475 Fibonacci extension level (127.2%), with a completed five-wave impulse pattern likely followed by an ABC correction.
🔻 Bearish Scenario:
A clear 5-wave Elliott structure suggests a top might be in.
Price is now losing momentum, indicating the start of a corrective move.
If selling continues, 1.12850 will be the first key level to watch.
A break below that could open the door for a deeper correction toward 1.12286.
📉 Momentum Support:
The Detrended Oscillator shows a loss of bullish momentum, aligning with the corrective structure expectation.
🔴 Invalidation:
A break back above 1.1475 would invalidate the bearish count and suggest trend continuation.
This setup favors short opportunities on breakdown confirmation with targets at the next major supports.
Eurusdsignal

DeGRAM | EURUSD formed a bullish takeover📊 Technical Analysis
● A bullish engulfing on the grey 1.135-1.139 demand band reclaimed the inner trend-median and confirmed the base of the rising 2-month channel.
● The pull-back has just retested the broken wedge top (~1.140) as support; pattern height projects a grind to the channel mid-rail / horizontal cluster at 1.1565.
💡 Fundamental Analysis
● Ahead of the ECB’s expected “one-and-pause” 25 bp cut, EZ core CPI stayed stuck at 2.9 % y/y while soft US job-openings and lower T-bill yields narrowed the 2-yr spread, helping bids return to the euro.
✨ Summary
Long 1.137-1.140; hold above 1.135 seeks 1.156 ➜ 1.160. Invalidate on H4 close < 1.126.
-------------------
Share your opinion in the comments and support the idea with like. Thanks for your support!

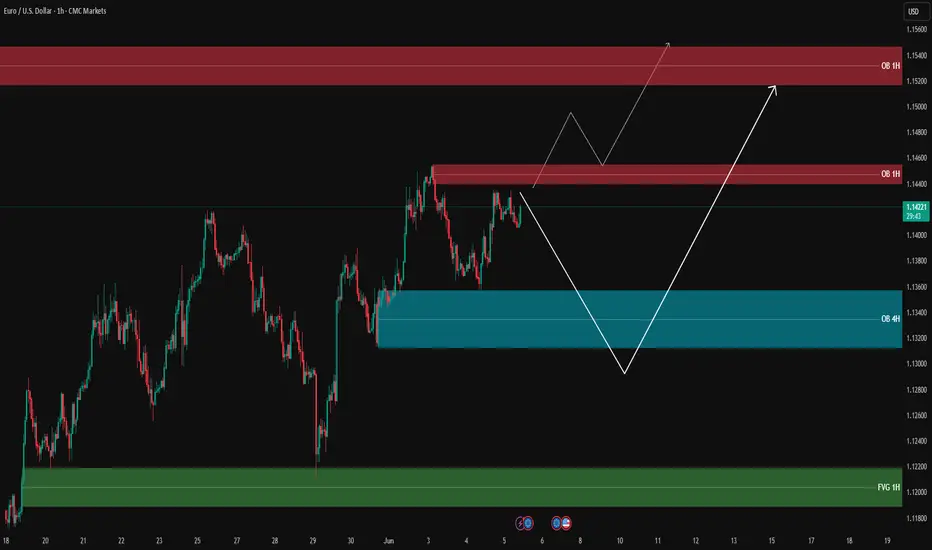
EUR/USD Analysis – Possible Scenarios🔹 Price is currently trading around 1.1421, consolidating between key supply and demand zones.
🔴 Supply Zone (Order Block 1H): 1.14360 – 1.14590
📌 Strong bearish reaction from this resistance area. First scenario: rejection from this OB and a move downward.
🔵 Demand Zone (Order Block 4H): 1.13050 – 1.13430
✅ If price fails to break the resistance, we could see a retracement to this OB. Bullish reaction here may offer long opportunities.
🟢 Fair Value Gap (FVG 1H): 1.11800 – 1.12220
📉 If OB 4H fails to hold, price could drop into this FVG area – a high-liquidity zone for potential reversal.
📊 Possible Scenarios:
1️⃣ Break and hold above OB 1H → price may extend toward next OB zone at 1.15150 – 1.15400
2️⃣ Rejection from OB 1H → pullback to OB 4H → possible long setup if confirmed
3️⃣ Break below OB 4H → deeper move into FVG 1H
‼️ Avoid premature entries – wait for valid confirmations.
🔍 Insight by ProfitaminFX
If this outlook aligns with your bias, or if you see it differently, feel free to share your perspective in the comments. Let’s grow together 📈
DeGRAM | EURUSD fixed above the resistance line📊 Technical Analysis
● Price has broken the H1 descending-channel roof and twice “fixed” above it at ≈1.137, turning the former ceiling into short-term support.
● The rebound forms an ascending triangle under 1.142; its measured swing targets 1.156 – 1.160, where the violet long-term resistance line and mid-channel parallel converge.
💡 Fundamental Analysis
● Markets expect the ECB to cut only 25 bp on 6 Jun and signal patience, while soft US JOLTS openings and slipping ISM-prices lifted September Fed-cut odds past 60 %, narrowing the 2-yr yield gap and underpinning EUR.
✨ Summary
Buy 1.135-1.137; triangle break >1.142 seeks 1.156 → 1.160. Long view void on an H1 close below 1.126.
-------------------
Share your opinion in the comments and support the idea with like. Thanks for your support!

EURUSD: Pullback From Support Confirmed 🇪🇺🇺🇸
Update for our yesterday's setup on EURUSD.
It feels like the pair has successfully completed a retracement,
respecting an intraday horizontal support.
A double bottom formation on that and a formation of a bullish
imbalance candle provide a strong bullish confirmation.
I think the pair may rise at least to 1.144 support soon.
❤️Please, support my work with like, thank you!❤️
I am part of Trade Nation's Influencer program and receive a monthly fee for using their TradingView charts in my analysis.

DeGRAM | EURUSD broke the downward channel📊 Technical Analysis
● Price broke the H4 descending channel roof and reclaimed 1.130 support; the breakout is holding above the long-term blue trend-line, creating a fresh higher-low cluster.
● Momentum is compressing in a bull flag between 1.1420 resistance and 1.1330 support; flag depth projects to 1.1565-1.1600 near the violet channel cap.
💡 Fundamental Analysis
● Flash EZ CPI jumped to 2.6 % y/y vs 2.5 % est. while US ISM mfg. slid to 48.1, trimming Treasury yields and widening EUR-USD rate appeal.
✨ Summary
Long 1.133-1.136; flag break >1.142 targets 1.156 → 1.160. Trend risk flips on a close below 1.126.
-------------------
Share your opinion in the comments and support the idea with like. Thanks for your support!

EURUSD on 3rd May 2025By looking at EURUSD in 4h timeframe, it is trading on very strong zone as it became support now due to yesterday breakout. Also there is uptrend trendline which is acting as strong support, if it breaks our next target will be down to 1.12490 and 1.12930. if this support holds then price may surge in upward direction. Need to wait till breakout in downward.
Key point.
Support - 1.14190, 1.13600, 1.13152
Resistance - 1.14906, 1.15440
If you like it do follow and share.
Any Query Reach Us or comment down.
Follow for more updates.
Rudra Vasaikar Wishes You A Great And Very Amazing Trading Life. Trade Safe, Trade Right.
RISK WARNING 🔴 🔴 🔴
There is high risk of loss in Trading Forex, Crypto, Indices, CFDs, Features and Stocks. Choose your trade wisely and confidently, please see if such trading is appropriate for you or not. Past performance is not indicative of future results. Highly recommended - Information provided by Pro Trading Point are for Educational purpose only. Do your investment according to your own risk. Any type of loss is not our responsibility.
HAPPY TRADING.

DeGRAM | EURUSD retest of the support📊 Technical Analysis
● Price rebounded off the flag base (1.128) and reclaimed the inner grey trend-median, keeping the sequence of higher-lows inside the two-year rising channel.
● The flag’s upper rail at 1.145 has been tested twice; a close above completes the pattern and projects to the channel roof / horizontal confluence at 1.1600, while dynamic support rises with the violet breakout line at 1.1214.
💡 Fundamental Analysis
● Euro stays bid after May EZ headline CPI re-accelerated to 2.6 % y/y, tempering expectations for aggressive ECB cuts, whereas weaker US ADP hiring and cooling core-PCE pressured real yields and the dollar.
✨ Summary
Long bias above 1.128; flag break > 1.145 targets 1.1600, stretch 1.1950. Invalidate on daily close < 1.1080.
-------------------
Share your opinion in the comments and support the idea with like. Thanks for your support!

EURUSD: Detailed Support & Resistance Analysis For Next Week
Here is my latest structure analysis
and important supports and resistances for EURUSD
for next week.
Consider these structures for pullback/breakout trading.
❤️Please, support my work with like, thank you!❤️
I am part of Trade Nation's Influencer program and receive a monthly fee for using their TradingView charts in my analysis.

EURUSD,GBPUSD and AUDUSD Analysis todayHello traders, this is a complete multiple timeframe analysis of this pair. We see could find significant trading opportunities as per analysis upon price action confirmation we may take this trade. Smash the like button if you find value in this analysis and drop a comment if you have any questions or let me know which pair to cover in my next analysis.

DeGRAM | EURUSD held the support line📊 Technical Analysis
● Price broke the two-year descending channel roof and completed a daily “cup-with-handle”; the handle low held exactly on the 1.121-1.128 former supply, confirming it as demand.
● Pattern height added to the breakout line projects to 1.1600, which coincides with the violet channel-top; next target is the upper parallel / 1.1950, while the handle floor at 1.1080 guards the trend.
💡 Fundamental Analysis
● Euro support grows as April EZ wage-growth beat ECB staff forecasts, tempering expectations for an aggressive easing cycle, while softer US core-PCE keeps real-yield spreads tilting in the euro’s favour.
✨ Summary
Long bias intact above 1.121; objectives 1.145 breakout ➜ 1.1600, stretch 1.1950. Invalidate on a daily close below 1.1080.
-------------------
Share your opinion in the comments and support the idea with like. Thanks for your support!

DeGRAM | EURUSD held the accumulation zone📊 Technical Analysis
● Two-year rising channel is intact; price just rebounded from the lower rail (RB) and punched back above the 2020-2024 red resistance trend-line, repeating the 2022 “break-retest-fixation” pattern.
● An 18-month accumulation rectangle (1.06-1.13) has resolved higher, printing a bullish weekly engulfing; the measured move points to the channel mid-band / horizontal cluster at 1.1600, then the upper rail near 1.1950.
💡 Fundamental Analysis
● Eurozone core CPI is stuck at 2.7 % y/y while US ISM and housing prints cooled, dragging real U.S. yields lower and narrowing the policy-rate gap priced for 2025.
✨ Summary
Long above 1.1214; breakout projects 1.16 ➜ 1.195. Risk flips only on a weekly close back below 1.108.
-------------------
Share your opinion in the comments and support the idea with like. Thanks for your support!

Big Picture Shift: EURUSD Bulls Eye 1.23–1.25 Zone📊 EURUSD – Has the Long-Term Trend Finally Reversed?
Since the 2008 all-time high at 1.60, EURUSD has been in a persistent downtrend, dropping all the way below parity in September 2022.
Following the recovery back above parity, the pair has been range-bound in a 700-pip channel for nearly two years. And while early 2025 brought a sharp decline toward the 1.02 zone, this move was quickly reversed, forming what now looks like a higher low relative to the sub-parity bottom.
❓ The big question: Is the long-term trend now bullish?
There are several signs supporting this idea:
✅ From 2008 to 2014, the pair formed a massive descending triangle, which eventually broke to the downside.
✅ The area around 1.05 held as a long-term support, and price began trading in a broader range with 1.22–1.23 resistance.
✅ The break below parity could now be interpreted as a false breakdown, with the strong reversal from 1.02 this year confirming the historical support zones from 2015 and 2017.
✅ Most importantly, the recent push to 1.1550 could be the first higher high on the long-term chart — a potential signal that the downtrend of nearly two decades is ending.
🎯 Conclusion and Long-Term Target
In my view, the long-term trend has shifted. The structure now favors bullish continuation, and my primary target on the long term is the 1.23–1.25 zone.
Disclosure: I am part of Trade Nation's Influencer program and receive a monthly fee for using their TradingView charts in my analyses and educational articles.

DeGRAM | EURUSD reached the upper boundary of the channel📊 Technical Analysis
● Price is capped by the H4 supply at 1.130-1.135 and the roof of a year-long downward channel; the latest test printed a bearish pin (red arrow).
● Inside, a smaller blue rising channel has just broken south—turning 1.128 into fresh resistance—and leaves room to the mid-channel support at 1.121, then the lower rail / 1.113.
💡 Fundamental Analysis
● ECB’s Villeroy repeated that a June cut is “very likely” while Fed minutes stressed rates may stay restrictive; widening yield gap revives USD demand.
✨ Summary
Fade 1.128-1.131; targets 1.121 ➜ 1.113, extension 1.106. Short view void on a close above 1.135.
-------------------
Share your opinion in the comments and support the idea with like. Thanks for your support!

DeGRAM | EURUSD testing the resistance line📊 Technical Analysis
● Euro rebounded from the channel mid-line and reclaimed the purple corrective trend-line; that switch from resistance to support confirms a bull-flag breakout.
● Fresh upside is opening above 1.1280 (prior swing cap). Clearing it exposes the channel top / horizontal hurdle at 1.1380; measured move of the flag aligns with 1.1550.
💡 Fundamental Analysis
● FXStreet notes US April leading-index fell for a 25th month, pulling 2-yr yields off highs, while Yahoo Finance reports German PPI turned positive m/m, limiting ECB-cut bets and lending bid to the euro.
✨ Summary
Buy 1.122-1.128 ; objectives 1.138 → 1.155, invalidate below 1.108.
-------------------
Share your opinion in the comments and support the idea with like. Thanks for your support!

EUR/USD Bullish Breakout Ahead – Inverse Head and Shoulders + ChThe EUR/USD pair is showing a strong bullish setup supported by multiple confluences:
🔹 Inverse Head & Shoulders Pattern
A clean inverse head and shoulders formation has completed near the 1.1225–1.1207 support zone. This structure typically signals a reversal to the upside and has been confirmed with neckline breakout.
🔹 Breakout from Falling Channel
The breakout above the descending channel further supports bullish momentum, suggesting that the prior downtrend has likely ended.
🔹 Ascending Channel Structure
Price is currently respecting a rising channel, with higher highs and higher lows clearly forming. The lower boundary has been tested successfully, adding confidence to long positions.
🔹 Bullish Targets
I’m targeting the Fibonacci extension levels at:
127.2% at 1.13030
141.4% at 1.13223
These levels align with upper channel resistance and offer solid risk-reward potential.
🔻 Key Support / Invalidation
The key support zone is 1.1225–1.1207. A break below this area invalidates the bullish setup.
🎯 Trade Plan
Entry: After neckline breakout or on a minor pullback into the red support zone
TP1: 1.13030
TP2: 1.13223
SL: Below 1.1207 (conservative stop)

DeGRAM | EURUSD holding the 1.12 level📊 Technical Analysis
● Price defended the rising-channel median (1.1200) and formed a bullish pennant against the blue corrective trend-line; pattern completion projects to the next horizontal/diagonal confluence at 1.1380.
● Momentum is flipping positive as the pair climbs back above the short-term descending channel roof, turning it into support and aligning with repeat bounces off 1.1100.
💡 Fundamental Analysis
● May euro-area flash PMIs surprised on the upside while US industrial output slipped, narrowing growth differentials and cooling USD demand.
✨ Summary
Pennant + channel support and firmer EU data vs. softer US output back a push toward 1.1300 → 1.1380; bias void if 1.1100 breaks.
-------------------
Share your opinion in the comments and support the idea with like. Thanks for your support!

EURUSD Near Top Of Channel — Correction Imminent!!!EURUSD ( FX:EURUSD ) is trading in the Resistance zone($1.1310-$1.1162) , near the upper line of the descending channel and the Monthly Pivot Point .
In terms of Elliott wave theory , it seems that EURUSD has completed five main impulse waves , and with the break of the Uptrend lines , we should expect corrective waves . Most likely, EURUSD is completing microwave 4 , and we should expect the next decline and the formation of microwave 5 .
I expect EURUSD to fall to at least $1.1073 , and the next targets are marked on the chart.
Note: If EURUSD touches $1.1330 , we should expect further gains.
Please respect each other's ideas and express them politely if you agree or disagree.
Euro/U.S. Dollar Analyze (EURUSD), 4-hour time frame.
Be sure to follow the updated ideas.
Do not forget to put a Stop loss for your positions (For every position you want to open).
Please follow your strategy and updates; this is just my Idea, and I will gladly see your ideas in this post.
Please do not forget the ✅' like '✅ button 🙏😊 & Share it with your friends; thanks, and Trade safe.

DeGRAM | EURUSD rebound in the channel📊 Technical Analysis
● Strong rebound from 1.1070/channel base produced a V‑shape and broke a minor falling wedge; price is now carving higher lows above 1.1200 support.
● Room remains to the upper wedge rail / supply 1.1380, which aligns with the channel’s mid‑line; invalidation if 1.1200 fails.
💡 Fundamental Analysis
● US April CPI printed 0.3 % m/m (vs 0.4 % cons) while retail‑sales missed, knocking 2‑yr yields beneath 4.70 % and weakening the USD.
● ECB hawks (Vujčić, Nagel) said cuts after June hinge on data, tempering dovish bets and underpinning euro rates. FXStreet flags fresh demand above 1.12.
✨ Summary
Channel‑floor bounce + softer US data versus guarded ECB tone favour a grind to 1.1300 → 1.1380; long bias void under 1.1200.
-------------------
Share your opinion in the comments and support the idea with like. Thanks for your support!

DeGRAM | EURUSD retest of the support level📊 Technical Analysis
● Price is testing the confluence of the blue corrective channel floor, the long‑term rising‑channel base and the 1.11 support, replicating April’s launch point.
● A close above the blue channel roof (~1.127) would confirm a break and target the mid‑channel 1.134 resistance, then the supply zone / upper rail near 1.140; bias is invalidated on a sustained close below 1.11.
💡 Fundamental Analysis
● US initial claims jumped to 252 k (5‑week high) while two FOMC voters signalled readiness to cut if labour softens, pressuring yields and the USD.
● ECB’s Lane said inflation is “on track” but emphasised data‑dependence beyond June, tempering easing expectations and underpinning euro rates.
✨ Summary
Channel‑base retest + weaker US data versus cautious ECB keep the short‑term long in play: objectives 1.134 → 1.140, cut if < 1.11.
-------------------
Share your opinion in the comments and support the idea with like. Thanks for your support!

EURUSD: Pullback From Support 🇪🇺🇺🇸
It looks like it is finally the moment for EURUSD to pull back.
I see a strong intraday bullish confirmation this morning
with a formation of a cup & handle pattern on an hourly time frame.
I expect a pullback at least to 1.117
❤️Please, support my work with like, thank you!❤️
I am part of Trade Nation's Influencer program and receive a monthly fee for using their TradingView charts in my analysis.

1. EUR/USD Buy Setup1. Entry Point:
Marked at: 1.12243
This is the suggested price level to enter a long (buy) trade.
2. Stop Loss:
Set at: 1.11542
Placed below a support zone, it limits the downside risk if the trade moves against the position.
3. Target Points:
EA Target Point One: 1.13891
EA Target Point (Final): 1.15929
These levels are profit-taking zones, with the first being a conservative target and the second being a more extended move.
4. Technical Indicators:
Moving Averages:
A red shorter-term moving average (possibly 20 EMA)
A blue longer-term moving average (possibly 200 EMA)
Price is currently below both, indicating bearish momentum, though the long setup is anticipating a reversal.
5. Support/Resistance Zones:
Purple Zones: Highlighted as key demand and supply areas.
The lower purple zone supports the entry and stop-loss area.
The upper purple zones mark resistance areas aligning with the target levels.
6. Current Price:
Around 1.12459, slightly above the entry zone.
Conclusion:
This setup is a bullish trade idea with a clearly defined:
Entry (1.12243),
Stop-loss (1.11542), and
Two take-profit levels (1.13891 and 1.15929).

DeGRAM | EURUSD is holding the accumulation zone📊 Technical Analysis
● CAPITALCOM:EURUSD is pressing the purple resistance line (~1.1335); a close above it should carry the pair to the mid‑channel support level at 1.1450, then to the upper resistance level near 1.1560.
💡 Fundamental Analysis
● US initial claims rose to 241 k and continuing claims to 1.916 m, pushing yields lower and softening the USD.
● ECB officials signal caution on additional rate cuts after June, helping anchor euro yields and sentiment.
✨ Summary
Accumulation‑zone strength, weakening USD data, and a cautious ECB support a short‑term long view: objectives 1.1450 → 1.1560; the daily candlestick closes under the channel.
-------------------
Share your opinion in the comments and support the idea with like. Thanks for your support!
