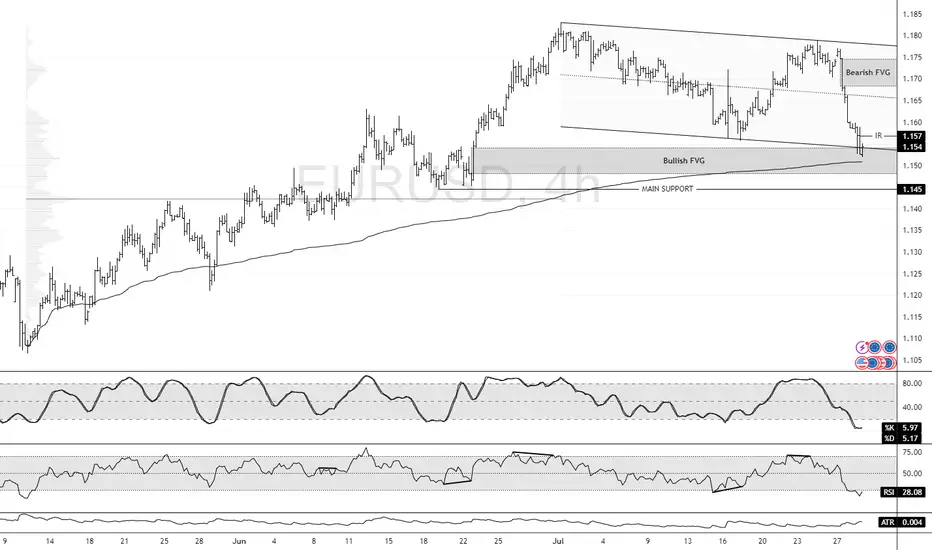
EUR/USD at Discount Level: Bullish Setup in FocusFenzoFx—EUR/USD bearish momentum extended to $1.154, the lower line of the flag. This is a support area backed by the Bullish FVG.
The immediate resistance is at $1.157. From a technical perspective, a close above this level can trigger an uptrend, targeting the bearish FVG at approximately $1.170 to $1.175.
Please note that the bullish outlook should be invalidated if EUR/USD falls below the main support level at $1.145.
Eurusdsignals
EURUSD Will the 1D MA50 hold?The EURUSD pair has been trading within a Channel Up pattern since the April 21 2025 High. The price is right now on a strong pull-back and is about to test the 1D MA50 (blue trend-line) for the first time since May 12.
As long as the 1D candle closes above the 1D MA50, it will be a buy signal, targeting 1.19250 (a standard +3.20% rise).
If the candle closes below the 1D MA50, the buy will be invalidated and we will switch to a sell, targeting the 1D MA100 (green trend-line) at 1.14100.
-------------------------------------------------------------------------------
** Please LIKE 👍, FOLLOW ✅, SHARE 🙌 and COMMENT ✍ if you enjoy this idea! Also share your ideas and charts in the comments section below! This is best way to keep it relevant, support us, keep the content here free and allow the idea to reach as many people as possible. **
-------------------------------------------------------------------------------
Disclosure: I am part of Trade Nation's Influencer program and receive a monthly fee for using their TradingView charts in my analysis.
💸💸💸💸💸💸
👇 👇 👇 👇 👇 👇

EURUSD – Bulls Still in Control, Trend ResumesIn my previous EURUSD analysis, I pointed out that the pair was nearing an important confluence support around 1.1620, and that – given the overall bullish trend – this zone could offer solid long opportunities.
What followed?
The market briefly dipped below that zone, even challenging the psychological 1.1600 round number. But instead of breaking down, bulls regrouped, stepped in with force, and pushed the pair aggressively higher.
📍 At the time of writing, EURUSD is trading at 1.1770, and my long trade is running with a comfortable 150 pips profit.
🔍 W hat’s Next?
The current structure suggests a continuation of the uptrend, and the logical technical target is the recent high at 1.1830.
Until proven otherwise, this is still a buy-the-dip market.
✅ Buying around 1.1700 could be a valid setup, especially if we see buying power on the intraday chart
⚠️ The Warning Sign
Despite the bullish bias, keep in mind:
If EURUSD drops and closes below 1.1670, the structure begins to shift — and this could signal a deeper correction or even trend reversal.
📌 Until then, the bias remains bullish, dips are to be watched for entries, and 1.1830 is the next checkpoint.
D isclosure: I am part of TradeNation's Influencer program and receive a monthly fee for using their TradingView charts in my analyses and educational articles.

EUR/USD Eyes $1.179 If Resistance BreaksFenzoFx—EUR/USD is testing the 100-day moving average as resistance, a supply zone backed by VWAP at $1.171. The Stochastic Oscillator depicts 81.0 in the description, meaning the Euro is overpriced in the short term.
Therefore, we expect the pair to test the $1.160 demand zone before the uptrend resumes. Furthermore, the bullish outlook remains valid above $1.155, and a break above resistance at $1.171 can trigger the uptrend, targeting $1.179.

EURUSD Will the 1D MA50 hold?The EURUSD pair seems to be rebounding just before a 1D MA50 (blue trend-line) test, which is its short-term Support. At the same time it bounced off the 0.382 Fibonacci retracement level, which after a +6.92% rise, it resembles the March 27 rebound.
The 1D RSI is printing a standard bullish reversal setup, seen already 4 times since February, and a break above its MA will confirm it.
As long as the 1D MA50 holds, it may extend the uptrend to a new Channel Up (dashed), outside the blue one that may look for a new +6.92% rise. In that case our Target will be 1.21000.
If the 1D MA50 breaks, we will add one last buy at 1.14000, near the 1D MA100 (green trend-line).
-------------------------------------------------------------------------------
** Please LIKE 👍, FOLLOW ✅, SHARE 🙌 and COMMENT ✍ if you enjoy this idea! Also share your ideas and charts in the comments section below! This is best way to keep it relevant, support us, keep the content here free and allow the idea to reach as many people as possible. **
-------------------------------------------------------------------------------
Disclosure: I am part of Trade Nation's Influencer program and receive a monthly fee for using their TradingView charts in my analysis.
💸💸💸💸💸💸
👇 👇 👇 👇 👇 👇

EURUSD: Support & Resistance Analysis 🇪🇺🇺🇸
Here is my fresh support & resistance analysis for EURUSD.
Vertical Structures
Vertical Support 1: Rising trend line
Vertical Support 2: Falling trend line
Vertical Resistance 1: Falling trend line
Horizontal Structures
Support 1: 1.1577 - 1.1600 area
Support 2: 1.1445 - 1.1458 area
Support 3: 1.1356 - 1.1373 area
Support 4: 1.1190 - 1.1280 area
Resistance 1: 1.1682 - 1.1766 area
Resistance 2: 1.1807 - 1.1830 area
Consider these structures for pullback/breakout trading.
❤️Please, support my work with like, thank you!❤️
I am part of Trade Nation's Influencer program and receive a monthly fee for using their TradingView charts in my analysis.

EURUSD The 4H MA200 distinguishes bullish from bearish.The EURUSD pair has been trading within a (blue) 2-month Channel Up since the May 12 Low and it just broke below its 4H MA100 (green trend-line). The previous two Bearish Legs of this pattern bottomed (made a Higher Low) on or just above the 0.5 Fibonacci retracement level.
As a result, the price is very close to the most optimal buy level of this pattern and as long as it holds, we expect to start the new Bullish Leg and target the 1.5 Fibonacci extension (1.20000 our Target just below), which is in line with the previous two Bullish Legs.
If however the 4H MA200 (orange trend-line) breaks, we will take the loss on that long and go short as technically the price should seek the bottom of the (dotted) wider Channel Up. Our Target on that occasion will be 1.14000, right at the top of the High Volatility Zone.
-------------------------------------------------------------------------------
** Please LIKE 👍, FOLLOW ✅, SHARE 🙌 and COMMENT ✍ if you enjoy this idea! Also share your ideas and charts in the comments section below! This is best way to keep it relevant, support us, keep the content here free and allow the idea to reach as many people as possible. **
-------------------------------------------------------------------------------
Disclosure: I am part of Trade Nation's Influencer program and receive a monthly fee for using their TradingView charts in my analysis.
💸💸💸💸💸💸
👇 👇 👇 👇 👇 👇

EURUSD Bounce on the 4H MA100 eyes 1.2000.The EURUSD pair has been trading within a Channel Up pattern since the May 12 Low. Right now it is expanding its 3rd Bearish Leg of this structure, with the previous two reaching at least either the 4H MA100 (green trend-line) or the 0.5 Fibonacci retracement level before rebounding.
As a result, we expect a rebound soon around the 1.16500 level to start the new Bullish Leg. The last two peaked on the 1.5 Fibonacci extension, which gives us a clear Target at 1.2000.
Notice also that every time the 4H MACD formed a Bullish Cross below the 0.0 mark, it was a confirmed buy signal. Use that to your advantage.
-------------------------------------------------------------------------------
** Please LIKE 👍, FOLLOW ✅, SHARE 🙌 and COMMENT ✍ if you enjoy this idea! Also share your ideas and charts in the comments section below! This is best way to keep it relevant, support us, keep the content here free and allow the idea to reach as many people as possible. **
-------------------------------------------------------------------------------
Disclosure: I am part of Trade Nation's Influencer program and receive a monthly fee for using their TradingView charts in my analysis.
💸💸💸💸💸💸
👇 👇 👇 👇 👇 👇

EURUSD Sell signal at the top of the Channel Up.Last time we analyzed the EURUSD pair (June 23, see chart below) we gave a strong buy signals at the bottom of the 1.5-month Channel Up:
The price is almost near our Target but since it's been consolidating for so many 4H candles on the pattern's top, it is better to take the good profit and turn bearish.
The 0.5 Fibonacci retracement level has been a solid target for the previous two Bearish Legs, but since the last one bottomed just above it on the 4H MA100 (green trend-line), we will place the Target a little higher this time also at 1.16100.
-------------------------------------------------------------------------------
** Please LIKE 👍, FOLLOW ✅, SHARE 🙌 and COMMENT ✍ if you enjoy this idea! Also share your ideas and charts in the comments section below! This is best way to keep it relevant, support us, keep the content here free and allow the idea to reach as many people as possible. **
-------------------------------------------------------------------------------
Disclosure: I am part of Trade Nation's Influencer program and receive a monthly fee for using their TradingView charts in my analysis.
💸💸💸💸💸💸
👇 👇 👇 👇 👇 👇

EURUSD Channel Up formed bottom. Heavily bullish.The EURUSD pair has been trading within a Channel Up since the May 12 Low. Today it hit its 4H MA100 (green trend-line) for the first time since May 12 and having just broken also above its 4H MA50 (blue trend-line), it confirmed that the pattern has already priced its bottom.
This is initiating the new Bullish Leg and based on the previous two, it should grow by at least +3.21%. We have a modest short-term Target at 1.1800.
-------------------------------------------------------------------------------
** Please LIKE 👍, FOLLOW ✅, SHARE 🙌 and COMMENT ✍ if you enjoy this idea! Also share your ideas and charts in the comments section below! This is best way to keep it relevant, support us, keep the content here free and allow the idea to reach as many people as possible. **
-------------------------------------------------------------------------------
Disclosure: I am part of Trade Nation's Influencer program and receive a monthly fee for using their TradingView charts in my analysis.
💸💸💸💸💸💸
👇 👇 👇 👇 👇 👇

EURUSD: Important Supports & Resistances For Next Week 🇪🇺🇺🇸
Here is my latest structure analysis for EURUSD for next week.
Consider these supports and resistances for breakout/pullback trading.
❤️Please, support my work with like, thank you!❤️
I am part of Trade Nation's Influencer program and receive a monthly fee for using their TradingView charts in my analysis.

EURUSD Last push before correction.The EURUSD pair made a new High by breaking above the 1.15725 Resistance and is extending the rally since the January 13 2025 Low. That Low was the Higher Low of the multi-year Channel Up, so the current uptrend is technically its latest Bullish Leg.
The first Bullish Leg of that pattern peaked after a +15.75% rise. We expect a similar peak for the current rally, thus targeting 1.17750, before a new pull-back below the 1D MA50 (blue trend-line).
-------------------------------------------------------------------------------
** Please LIKE 👍, FOLLOW ✅, SHARE 🙌 and COMMENT ✍ if you enjoy this idea! Also share your ideas and charts in the comments section below! This is best way to keep it relevant, support us, keep the content here free and allow the idea to reach as many people as possible. **
-------------------------------------------------------------------------------
Disclosure: I am part of Trade Nation's Influencer program and receive a monthly fee for using their TradingView charts in my analysis.
💸💸💸💸💸💸
👇 👇 👇 👇 👇 👇

EURUSD: Move Up Ahead?! 🇪🇺🇺🇸
EURUSD nicely respected the underlined key horizontal support.
A strong rejection from that and a formation of a bullish imbalance candle
indicate a highly probably bullish continuation next week.
Goal - 1.1608
❤️Please, support my work with like, thank you!❤️
I am part of Trade Nation's Influencer program and receive a monthly fee for using their TradingView charts in my analysis.

EURUSD Buy the next dip and target 1.17700The EURUSD pair has been trading within a Channel Up pattern and is currently on its 2nd Bullish Leg that hasn't yet been completed.
It does print an identical price action to the 1st Bullish Leg of the pattern, having already made its first pull-back near the 0.382 Fibonacci retracement level and is now rising for the 2nd rejection.
Our plan is to buy the next dip and target 1.17700, which is the -0.136 Fibonacci extension, the level where the 1st Bullish Leg topped.
-------------------------------------------------------------------------------
** Please LIKE 👍, FOLLOW ✅, SHARE 🙌 and COMMENT ✍ if you enjoy this idea! Also share your ideas and charts in the comments section below! This is best way to keep it relevant, support us, keep the content here free and allow the idea to reach as many people as possible. **
-------------------------------------------------------------------------------
Disclosure: I am part of Trade Nation's Influencer program and receive a monthly fee for using their TradingView charts in my analysis.
💸💸💸💸💸💸
👇 👇 👇 👇 👇 👇

EURUSD: Pullback From Support Confirmed 🇪🇺🇺🇸
Update for our yesterday's setup on EURUSD.
It feels like the pair has successfully completed a retracement,
respecting an intraday horizontal support.
A double bottom formation on that and a formation of a bullish
imbalance candle provide a strong bullish confirmation.
I think the pair may rise at least to 1.144 support soon.
❤️Please, support my work with like, thank you!❤️
I am part of Trade Nation's Influencer program and receive a monthly fee for using their TradingView charts in my analysis.

EURUSD: Rise Ahead! 🇪🇺🇺🇸
EURUSD successfully violated a significant horizontal supply area yesterday.
The broken structure and a rising trend line compose a contracting demand zone now.
It will be the area from where I will expect a rise to higher level.
The next strong resistance is 1.151
❤️Please, support my work with like, thank you!❤️
I am part of Trade Nation's Influencer program and receive a monthly fee for using their TradingView charts in my analysis.

EURUSD Channel Up targeting 1.15000.The EURUSD pair just broke above the Resistance 1 level (1.14250) confirming the extension of the current Bullish Leg of the short-term Channel Up.
With their 4H RSI patterns very similar, the previous Bullish Leg rose by +2.58% before a pull-back to the 4H MA50 (blue trend-line). That gives us a potential Target of 1.15000 on the short-term.
-------------------------------------------------------------------------------
** Please LIKE 👍, FOLLOW ✅, SHARE 🙌 and COMMENT ✍ if you enjoy this idea! Also share your ideas and charts in the comments section below! This is best way to keep it relevant, support us, keep the content here free and allow the idea to reach as many people as possible. **
-------------------------------------------------------------------------------
Disclosure: I am part of Trade Nation's Influencer program and receive a monthly fee for using their TradingView charts in my analysis.
💸💸💸💸💸💸
👇 👇 👇 👇 👇 👇

EURUSD: Detailed Support & Resistance Analysis For Next Week
Here is my latest structure analysis
and important supports and resistances for EURUSD
for next week.
Consider these structures for pullback/breakout trading.
❤️Please, support my work with like, thank you!❤️
I am part of Trade Nation's Influencer program and receive a monthly fee for using their TradingView charts in my analysis.

EURUSD Rally already underway on the 1D MA50.The EURUSD pair has been trading within a Channel Up since practically the beginning of the year. The recent rebound (May 12) on its 1D MA50 (blue trend-line) has technically started the pattern's new Bullish Leg.
Given that the previous two have risen by +7.50% on average, and were both confirmed by a 1D MACD Bullish Cross like the one formed today, we expect a minimum +7.20% rise from the bottom. Our Target is 1.18500.
-------------------------------------------------------------------------------
** Please LIKE 👍, FOLLOW ✅, SHARE 🙌 and COMMENT ✍ if you enjoy this idea! Also share your ideas and charts in the comments section below! This is best way to keep it relevant, support us, keep the content here free and allow the idea to reach as many people as possible. **
-------------------------------------------------------------------------------
Disclosure: I am part of Trade Nation's Influencer program and receive a monthly fee for using their TradingView charts in my analysis.
💸💸💸💸💸💸
👇 👇 👇 👇 👇 👇

EURUSD 1st 4H Death Cross after 7 months. Is it enough to short?The EURUSD pair just formed its first Death Cross on the 4H time-frame since October 04 2024. The last such formation signaled the bearish extension of the trend by breaking below its Higher Lows trend-line.
That was a similar Higher Lows trend-line the price rebounded on on May 12, exactly on the 1D MA50 (red trend-line). With the 1D RSI on levels similar with that previous Death Cross, we will wait for confirmation before shorting again and the price to break is the Higher Low/ 1D MA50 Cluster.
If broken, our Target will be just above the 0.618 Fibonacci from the bottom at 1.07350.
-------------------------------------------------------------------------------
** Please LIKE 👍, FOLLOW ✅, SHARE 🙌 and COMMENT ✍ if you enjoy this idea! Also share your ideas and charts in the comments section below! This is best way to keep it relevant, support us, keep the content here free and allow the idea to reach as many people as possible. **
-------------------------------------------------------------------------------
Disclosure: I am part of Trade Nation's Influencer program and receive a monthly fee for using their TradingView charts in my analysis.
💸💸💸💸💸💸
👇 👇 👇 👇 👇 👇

EURUSD: Bearish Continuation After Breakout 🇪🇺🇺🇸
EURUSD broke and closed below a significant horizontal support this week.
After a retest of a broken structure, the price formed a descending triangle pattern
on a 4h time frame.
Its neckline violation is a strong bearish confirmation signal.
The price is going to continue falling next week.
Next support - 1.11
❤️Please, support my work with like, thank you!❤️
I am part of Trade Nation's Influencer program and receive a monthly fee for using their TradingView charts in my analysis.

EURUSD: Pullback From Support 🇪🇺🇺🇸
It looks like it is finally the moment for EURUSD to pull back.
I see a strong intraday bullish confirmation this morning
with a formation of a cup & handle pattern on an hourly time frame.
I expect a pullback at least to 1.117
❤️Please, support my work with like, thank you!❤️
I am part of Trade Nation's Influencer program and receive a monthly fee for using their TradingView charts in my analysis.

EURUSD first 1D MA50 test since March 03. Bearish?Last time we had a look at the EURUSD pair (April 28, see chart below), we gave a bearish continuation signal, which not only did it hit its 1.12500 Target but also broke below the 3-month Channel Down:
This has brought us to the almost the first 1D MA50 (blue trend-line) test since the March 03 break-out. As long as this holds, it keeps the trend bullish but the 1D RSI is on a Bearish Divergence, indicating a potential long-term trend change.
Technically it is similar with the December 28 2023 High, which at the time of the 1D MA50 test was also on Higher Lows but its RSI on Lower Lows (Bearish Div). The 1D MA50 eventually broke, leading to a sell continuation that hit the 0.618 Fibonacci retracement level from the bottom.
As a result, if the D MA50 breaks, we will turn bearish, targeting 1.07000 (the 0.618 Fib).
-------------------------------------------------------------------------------
** Please LIKE 👍, FOLLOW ✅, SHARE 🙌 and COMMENT ✍ if you enjoy this idea! Also share your ideas and charts in the comments section below! This is best way to keep it relevant, support us, keep the content here free and allow the idea to reach as many people as possible. **
-------------------------------------------------------------------------------
Disclosure: I am part of Trade Nation's Influencer program and receive a monthly fee for using their TradingView charts in my analysis.
💸💸💸💸💸💸
👇 👇 👇 👇 👇 👇
