SNATCH & RUN: EUR/USD Long Setup (High-Risk Loot Zone)🔥 EUR/USD Heist: Bullish Loot Before the Trap! (Thief Trading Strategy) 🔥
🌟 Hi! Hola! Ola! Bonjour! Hallo! Marhaba! 🌟
Attention, Money Makers & Market Robbers! 🤑💰💸✈️
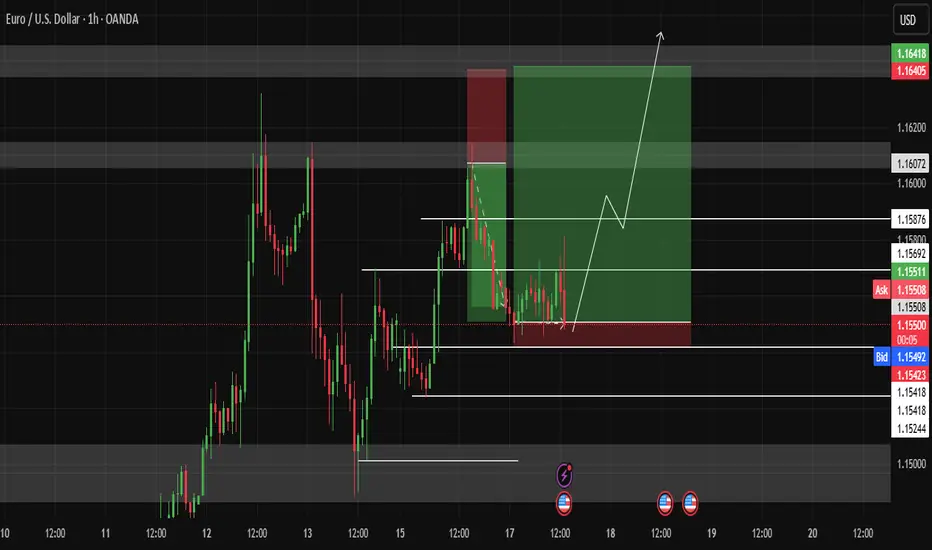
Based on the 🔥Thief Trading Style🔥, here’s our master plan to loot the EUR/USD "The Fiber" Forex Market! Follow the strategy on the chart—Long Entry is key. We’re targeting the high-risk Red Zone: overbought, consolidating, and primed for a reversal. Beware the trap—bulls must strike fast before bears ambush! 🏆💸
"Take the profit and treat yourself, trader. You deserve this heist!" 💪🎉
🚪 Entry Point (The Vault is Open!)
📈 "Swipe the bullish loot at any price—the heist is LIVE!"
Pro Tip: Use Buy Limit orders within a 15-30 min timeframe (recent swing low/high). ALERTS ARE A MUST!
🛑 Stop Loss (Escape Route)
Thief SL at nearest swing low (1.12500) on the 3H timeframe (Day/Swing trade).
Adjust based on your risk, lot size, and multiple orders.
🎯 Target (Loot & Scoot!)
🎯 1.17200 (or escape earlier if the cops show up!)
⚡ Scalpers’ Quick Grab
👀 Only scalp LONG!
Big wallets? Raid straight in.
Small stacks? Join swing traders for the robbery.
Use Trailing SL to protect your stolen cash! 💰
📢 Why This Heist? (EUR/USD Bullish Momentum)
"The Fiber" is heating up! Key drivers:
Fundamentals (COT Reports, Macro Data)
Sentiment & Intermarket Trends
Future Targets & Score Outlook
🔗 Want the full intel? Check our bio0 for linkks! 👉👉
⚠️ Trading Alert: News = Danger! 📰🚨
News releases = volatility spikes! Protect your loot:
❌ Avoid new trades during news.
🔒 Use Trailing SL to lock profits.
💖 Support the Heist Crew!
💥 Smash the Boost Button! 💥
More boosts = easier money steals!
Strengthen our robbery squad!
Every day is a heist—profit with Thief Trading Style! 🏆🚀
Stay tuned for the next robbery plan! 🤑🐱👤🤩
Eurusdtrade

EURUSD..BUYAnalysis complete — scenarios outlined. The zone could be a decision point for . Price reaction here may define the next move.
If price breaks and pulls back to retest, a reversal setup might emerge.

#EURUSD: +770 Pips Swing Move, DXY to Plumment! EURUSD is extremely bullish and is on track to cross the 1.21 area in our long-term swing plan. Based on recent price action, we have set two targets. As DXY continues to drop, the price is likely to remain bullish in the coming days or weeks. Please use accurate risk management while trading and consider this analysis.
Good luck and trade safely!
-Like
-Comment
-Share
Team Setupsfx_

EURUSDWe are expecting more strength in EURO after small correction towards 1.18 level.
Disclosure: We are part of Trade Nation's Influencer program and receive a monthly fee for using their TradingView charts in our analysis.

EUR/USD Holds Above Support – Watching 1.17400 and BeyondHi Everyone,
As highlighted, a successful bounce from the near-term support at 1.16680 provided a retest of the 1.17400 zone. Looking ahead, we expect price action to revisit this level in the coming week.
A confirmed break above this resistance could open the path toward 1.18000, where we anticipate encountering dynamic resistance.
As outlined in our analysis last week, we anticipated a continued move higher toward the 1.16564 and 1.18325 levels, provided price held above 1.14483.
Price respected this level, and EUR/USD extended its rally, reaching our first key target at 1.16564 and pushing above 1.17400 — marking the highest level since February 2022.
We will provide further updates on the projected path for EUR/USD should price reach this level.
The longer-term outlook remains bullish, with expectations for the rally to extend toward the 1.2000 level, provided the price holds above the key support at 1.10649.
We will continue to update you throughout the week with how we’re managing our active ideas and positions. Thanks again for all the likes/boosts, comments and follows — we appreciate the support!
All the best for a good end to the week. Trade safe.
BluetonaFX

EURUSD ( AB Algorithm Setup) 30.06.2025 - 04.07.2025 While everyone is waiting for a pullback or a downward correction, or expecting this aggressive trend to break and lead to a sharp drop, the market will continue to rise. Because a trend is sustained by those who don't believe in it

Expecting a pullback to test the channel’s floorA strong candle without follow-through is a sign of trend weakness, and from where the channel has formed, a pullback to the channel’s floor is logical
OANDA:EURUSD

EUR/USD Pair Hits Yearly HighEUR/USD Pair Hits Yearly High
Yesterday, the EUR/USD exchange rate rose above the 1.1700 level for the first time this year. The last time one euro was worth more than 1.70 US dollars was in autumn 2019.
The main driver behind the euro’s rise is the weakening dollar, largely due to decisions made by the Trump administration. This week alone, the EUR/USD pair has gained more than 2%, partly as a result of escalating tensions between the US President and the Chair of the Federal Reserve.
According to Reuters, Trump called Powell “terrible” and said he had three or four candidates in mind for the top job at the Fed. It was also reported that Trump had considered selecting and announcing a replacement for Powell by September or October (his current term officially runs until May 2026).
Technical Analysis of the EUR/USD Chart
Price movements are forming an upward channel (highlighted in blue), with the following observations:
→ Midweek, the price consolidated around the channel’s median line (as indicated by arrow 1);
→ It then broke through the 1.6300 level with strong bullish momentum (shown by arrow 2), a level that had acted as resistance earlier in the month;
→ The long upper wicks on the candles forming yesterday’s highs (circled) suggest increased selling pressure near the upper boundary of the channel.
Given this, we could assume that in the short term, the price might form a new consolidation zone around the median line above the 1.6300 level. Significant fundamental catalysts would be required to break the developing upward trend.
This article represents the opinion of the Companies operating under the FXOpen brand only. It is not to be construed as an offer, solicitation, or recommendation with respect to products and services provided by the Companies operating under the FXOpen brand, nor is it to be considered financial advice.

EUR/USD Short Idea Analysis EUR/USD exhibits bearish potential on the daily timeframe, with the 1.17160–1.18070 zone acting as a key resistance area for a short setup.
Technical Analysis:
Price Action: Price is testing the 1.17160–1.18070 resistance zone, which aligns with prior highs and a rejection area. A bearish reversal pattern (e.g., shooting star or engulfing) could confirm the short.
Support/Target: Initial support at 1.1600, with a deeper target at 1.1500 if selling pressure accelerates.
Indicators: RSI is nearing overbought levels (above 65), suggesting a potential reversal. MACD shows weakening bullish momentum, supporting a bearish bias.
Fibonacci: The 1.17160–1.18070 zone aligns with the 78.6% Fibonacci retracement of the prior downmove, reinforcing resistance.
Risks: A break above 1.1820 could invalidate the setup. Watch for ECB policy updates or unexpected US data shifts.
Conclusion: The 1.17160–1.18070 resistance zone offers a compelling short opportunity for EUR/USD, backed by technical and fundamental factors. Use tight risk management due to potential volatility.

eurusd updateentry price 1.1329
stop loss update 1.133
take profit
1.153
1.165
1.177
1.194
result we hit first two target

Shorting Optimism: EUR/USD Rally vs RealityAfter the spike to 1.1640 driven by temporary ceasefire news and USD weakness, I’ve taken a short position on EUR/USD. The market priced in too much optimism too fast, and I see limited upside beyond this zone in the current macro landscape. I’m positioned for a controlled retracement back toward the 1.1460–1.1520 region.
The play? Fade the overextension, follow structure, and manage from strength.
Technicals:
• The pair ran into a strong supply zone near 1.1640, which aligns with a previous liquidity sweep.
• Momentum has slowed visibly on lower timeframes, with candles rejecting highs and wicks printing upper tails.
• Daily and 4H SMAs are overstretched. The 20 SMA on H4 is accelerating upward, but RSI is near overbought and flattening.
• My short entry was taken with a stop above 1.1745 and first target at 1.1540, second at 1.1500.
• A potential retest of the 1.1660 zone could offer additional entries if invalidation remains intact.
Fundamentals:
• ECB vs Fed Divergence: The Fed holds firm on rates amid sticky inflation, while the ECB is under pressure to ease further due to weak growth.
• EU Struggles: PMI data remains in contraction territory; HICP cooling to 1.7% YoY suggests little reason for tightening.
• Political Instability: Germany and France both facing internal political crises — risk premia rising.
• Ceasefire Priced In: EUR rally on Middle East headlines lacks depth — conflict paused, not resolved.
• USD Resilience: Weak recent data aside, the USD remains a safe haven. Fed’s Powell reiterated that cuts aren’t imminent.
⚠️ Bias: Bearish as long as price trades below 1.1640. Watching how the market reacts to Fed testimony and ECB rhetoric this week.
🧠 Reminder: Don’t get emotional after vertical rallies. When everyone gets excited, I look for exhaustion. That’s where trades begin.
Note: Please remember to adjust this trade idea according to your individual trading conditions, including position size, broker-specific price variations, and any relevant external factors. Every trader’s situation is unique, so it’s crucial to tailor your approach to your own risk tolerance and market environment.

EURUSD Will Keep Growing!
HI,Traders !
#EURUSD is trading in an
Uptrend along the rising
Support and the pair will
Soon retest the support
From where we will be
Expecting a bullish rebound
And a bullish continuation !
Comment and subscribe to help us grow !

EURUSDThis levels is for reactions to support and resistace.
Price can now in Bull-trend if keep 1.145$ in sypport and breaked trendline.
⚠️Control risk management for positions.

EURUSD Trading Strategy for the WeekEURUSD is reacting at the support zone of 1.14500. This is an important support zone that helps EURUSD continue to maintain its upward momentum. The uptrend in the h4 time frame is still strong and heading towards the peak of 1.161.
Below the support of 1.145 will be the 1.138 zone. When this 1.138 zone is broken, it confirms that a Downtrend is established. The possibility of breaking this zone is not high, so it is still possible to set BUY signals around these support zones. On the other hand, 1.153 is an important resistance zone in the near future where the pair will have a price reaction before finding the peak of last week.
Support: 1.13800
Resistance: 1.16000
Break out: 1.14600-1.15300
Recommended good trading strategy:
Trade when price confirms in Break out zone.
BUY 1.13800-1.13600 Stoploss 1.13300
SELL 1.16000-1.16200 Stoploss 1.16500

EURUSD Trade Plan: Retracement Into Key Fibo Zone POI.I’m currently watching EURUSD closely 👀. On the daily timeframe, it’s clearly broken structure and is now in a bullish trend 📈. Dropping down to the lower timeframes 🕒, price appears overextended and is now trading into a previous resistance level 🚧.
I’m anticipating a retracement into equilibrium — specifically the 50% level of the current swing, and ideally into the 50–61.8% Fibonacci retracement zone 🔁. If price pulls back into that range, I’ll be watching for a bullish market structure shift 🔄. I don’t want to see it push below the bullish imbalance 📉—I want that zone to hold as support so price can continue north 🔼.
If this plays out, my ideal entry would be around the imbalance and the 50% Fib level, with a stop loss just below the imbalance, and targets set at the current swing high and previous swing high, as detailed in the video 🎯.
⚠️ Disclaimer
This is not financial advice. Trading involves risk and you should only trade with capital you can afford to lose. Please do your own analysis or consult a licensed financial advisor.

EURUSD is in a Downside DirectionHello Traders
In This Chart EURUSD HOURLY Forex Forecast By FOREX PLANET
today EURUSD analysis 👆
🟢This Chart includes_ (EURUSD market update)
🟢What is The Next Opportunity on EURUSD Market
🟢how to Enter to the Valid Entry With Assurance Profit
This CHART is For Trader's that Want to Improve Their Technical Analysis Skills and Their Trading By Understanding How To Analyze The Market Using Multiple Timeframes and Understanding The Bigger Picture on the Charts

EURUSD Breaks Structure: Bullish Continuation Opportunity💶 EUR/USD Analysis – Bullish Momentum Builds 📈
Taking a look at the EUR/USD on the daily chart, it’s clear the pair is currently in a strong bullish trend 🚀. Momentum has been building consistently, reflecting underlying euro strength and continued USD weakness.
🕓 On the 4H timeframe, we’ve now seen a clear shift in market structure to the upside, confirming bullish intent. Look for a continuation entry after a retracement back into equilibrium — ideally around the 50% level of the current price swing 🔄📐.
🎯 Trade Plan Idea:
Wait for price to pull back into equilibrium 🌀
Entry: Long from the discounted zone 🟩
Stop loss: Just below the recent swing low 🔻
Target: Previous high as a logical take-profit zone 🎯📊
⚠️ Disclaimer:
This content is for educational and informational purposes only and should not be considered financial advice. Always do your own research and consult with a qualified financial advisor before making any trading decisions. 📚💼

Core Impact Logic of the Middle East Situation on EURUSD(I) Energy Transmission Chain: Oil Price Fluctuations → Eurozone Inflation and Economy
The escalation of the Middle East situation (the Iran - Israel conflict, risks in the Strait of Hormuz) directly impacts the global energy supply chain:
If the conflict expands to block the Strait of Hormuz (transports ~20% of global crude oil 🛢️), Brent crude has already soared from recent lows—spiking over 5% on June 17 amid tensions ⛽️. This pushes up imported inflation in the Eurozone.
As a net energy - importing region 🌍, prolonged high oil prices will squeeze corporate profits, suppress consumption, and drag Eurozone economic recovery (German/French manufacturing is acutely energy - cost - sensitive 🏭). This weakens the euro’s fundamental support.
(II) Geopolitical Safe - Haven Sentiment: The "Safe - Haven Balance" Between USD & EUR
Amid Middle East tensions, the US dollar’s traditional safe - haven status competes with Eurozone havens like German bonds 📈:
If the US (e.g., the Trump administration) intervenes militarily 💥, market fears of "America mired in war" rise. USD safe - haven demand may temporarily weaken ⬇️, and the euro benefits as funds shift 🔄
⚡️⚡️⚡️ EURUSD ⚡️⚡️⚡️
🚀 Buy@ 1.14500 - 1.15000
🚀 TP 1.15500 - 1.15600
Accurate signals are updated every day 📈 If you encounter any problems during trading, these signals can serve as your reliable guide 🧭 Feel free to refer to them! I sincerely hope they'll be of great help to you 🌟 👇

Market Analysis: EUR/USD Faces RejectionMarket Analysis: EUR/USD Faces Rejection
EUR/USD declined from the 1.1640 resistance and traded below 1.1550.
Important Takeaways for EUR/USD Analysis Today
- The Euro started a fresh decline after a strong surge above the 1.1600 zone.
- There is a connecting bearish trend line forming with resistance at 1.1545 on the hourly chart of EUR/USD at FXOpen.
EUR/USD Technical Analysis
On the hourly chart of EUR/USD at FXOpen, the pair rallied above the 1.1600 resistance zone before the bears appeared, as discussed in the previous analysis. The Euro started a fresh decline and traded below the 1.1550 support zone against the US Dollar.
The pair declined below 1.1520 and tested the 1.1475 zone. A low was formed near 1.1475 and the pair started a consolidation phase. There was a minor recovery wave above the 1.1495 level.
The pair tested the 23.6% Fib retracement level of the downward move from the 1.1614 swing high to the 1.1475 low. EUR/USD is now trading below 1.1550 and the 50-hour simple moving average. On the upside, the pair is now facing resistance near the 1.1505 level.
The next key resistance is at 1.1545 and the 50% Fib retracement level of the downward move from the 1.1614 swing high to the 1.1475 low. There is also a connecting bearish trend line forming with resistance at 1.1545.
The main resistance is near the 1.1580 level. A clear move above the 1.1580 level could send the pair toward the 1.1615 resistance. An upside break above 1.1615 could set the pace for another increase. In the stated case, the pair might rise toward 1.1650.
If not, the pair might resume its decline. The first major support on the EUR/USD chart is near 1.1475. The next key support is at 1.1450. If there is a downside break below 1.1450, the pair could drop toward 1.1400. The next support is near 1.1350, below which the pair could start a major decline.
This article represents the opinion of the Companies operating under the FXOpen brand only. It is not to be construed as an offer, solicitation, or recommendation with respect to products and services provided by the Companies operating under the FXOpen brand, nor is it to be considered financial advice.

EUR/USD Set to Soar or Crash? Forecast for next weekEverything is simple, if price will drop i will be looking for longs in daily FVG
if price goes up till PWH i will expect move towards daily FVG
If you like this type of content follow and like
I am trying to make my analysis short and simple)

Opportunity for selling EURUSDI see that EURUSD has confirmed strong resistance, so I took a sell trade with it.

buying EURUSD (update) 1:10 RREURUSD touched strong support, so I think it will rise further, as shown.
EURUSD(20250616) Today's AnalysisMarket news:
Trump: The United States may still intervene in the Iran-Israel conflict. If Iran launches an attack on the United States, the United States will "fight back with all its strength on an unprecedented scale." Iran and Israel should reach an agreement.
Technical analysis:
Today's buying and selling boundaries:
1.1550
Support and resistance levels:
1.1674
1.1628
1.1598
1.1502
1.1472
1.1426
Trading strategy:
If the price breaks through 1.1550, consider buying, and the first target price is 1.1598
If the price breaks through 1.1502, consider selling, and the first target price is 1.1472
