EURUSD Trading Price Channel, SELL Strategy✏️ OANDA:EURUSD H4 Timeframe EURUSD is trading in a bearish channel. This bearish channel may extend to the important support at 1.145. A break of this important support will form a Downtrend. Further upside recovery will remain limited by the channel, with the notable upper boundary at 1.16800.
📉 Key Levels
Sell trigger: rejection from 1.168 with bearish confirmation
Sell DCA: Break 1.155
Target: 1.145
Leave your comments on the idea. I am happy to read your views.
Eurusdtradeidea

Watch out for EURUSDEURUSD continues to move sideways above the support zone.
This week, the key event is the ECB’s interest rate decision.
Keep an eye on whether there's enough momentum for a breakout above 1,1720.
If it gets rejected again, we might see a deeper correction.

EURUSD Is Weaker vs USD. Look For Sells!Welcome back to the Weekly Forex Forecast for the week of July 21-25th.
In this video, we will analyze the following FX market:
EURUSD
Expecting the USD to continue to push higher, which would further drag the EURO down. Look to take advantage of this dynamic and wait for sell setups!
Enjoy!
May profits be upon you.
Leave any questions or comments in the comment section.
I appreciate any feedback from my viewers!
Like and/or subscribe if you want more accurate analysis.
Thank you so much!
Disclaimer:
I do not provide personal investment advice and I am not a qualified licensed investment advisor.
All information found here, including any ideas, opinions, views, predictions, forecasts, commentaries, suggestions, expressed or implied herein, are for informational, entertainment or educational purposes only and should not be construed as personal investment advice. While the information provided is believed to be accurate, it may include errors or inaccuracies.
I will not and cannot be held liable for any actions you take as a result of anything you read here.
Conduct your own due diligence, or consult a licensed financial advisor or broker before making any and all investment decisions. Any investments, trades, speculations, or decisions made on the basis of any information found on this channel, expressed or implied herein, are committed at your own risk, financial or otherwise.

EURUSD Holding Support — Bullish Move in ProgressHello everybody!
There is a strong higher timeframe resistance now acting as support.
Price is respecting this area and starting to form a strong move to the upside.
We are looking to enter a buy position here, as the overall bullish trend is likely to continue.
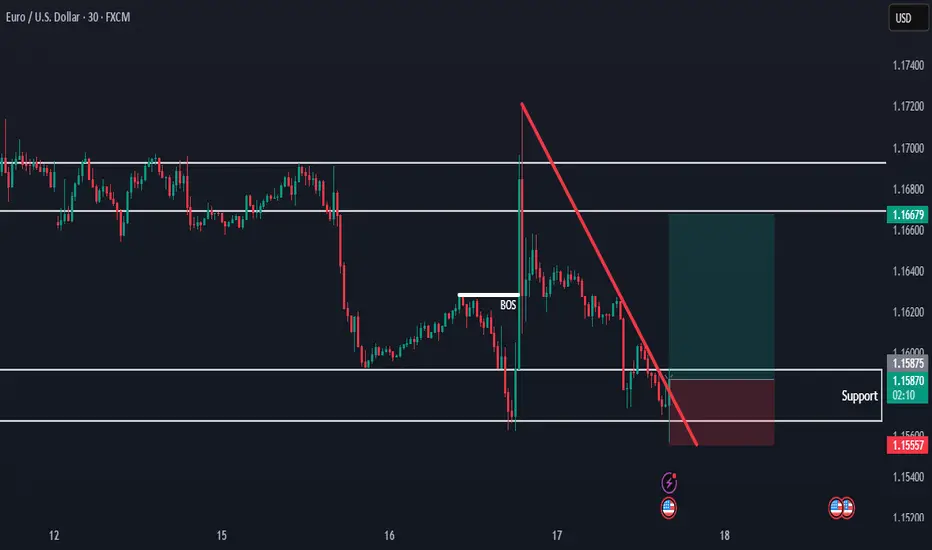
EURUSD Buy Trade Idea: Reversal Rocket Ready to Launch!Hey Fellow Traders! 👋
The EURUSD (EU) is setting up for a massive reversal that’s got me hyped! 🚀 After nailing the lows of that descending channel like a pro, price has retraced to our expected zone and is now bouncing hard. It’s time to gear up for a potential buy trade targeting the Buyside Liquidity! Let’s break down this fire setup and get ready to ride the wave! 🌊
📈 The Setup: Reversal in the Making!
EU hit the descending channel lows as predicted, and now it’s showing some serious bullish vibes with a strong bounce off a key weekly trendline support. This isn’t just a random move—price is reacting to a weekly demand zone and a trendline that’s holding like a fortress. 🏰 I’m expecting a reversal to kick in, aiming for that juicy Buyside Liquidity up top. But hold up—don’t just dive in blindly! Let’s talk strategy. 😎
🎯 Trade Details: How to Play It Smart
Entry Zone: Look for a calculated entry in this bounce area. Key setups to watch for:
FVG (Fair Value Gap) or IFVG (Imbalance Fair Value Gap) for precision entries.
Order Blocks (OB) for high-probability setups.
Trendlines/Support Zones: Use these for confluence, as EU is respecting that weekly trendline support.
Target: We’re gunning for the Buyside Liquidity—a high-probability target where price loves to gravitate.
Stop Loss: Place your stops below the recent lows or your chosen setup (FVG/OB) to keep risk tight.
👀 Keep an Eye on DXY for Confluence
The Dollar Index (DXY) is a key player here. A weakening DXY could supercharge this EU reversal, so monitor it closely for extra confirmation. If DXY starts to roll over, it’s like pouring rocket fuel on this trade! 🚀
🧠 Why This Reversal Makes Sense
Weekly Trendline Support: Price kissed this level and is bouncing like it means business.
Weekly Demand Zone: This area has historical strength, making it a prime reversal spot.
Channel Lows Conquered: EU smashed through the descending channel lows and is now retracing for the next leg up.
⚠️ Risk Management Reminder
Don’t YOLO this one! Use proper risk management—calculate your position size, set tight stops, and only enter when your setup aligns. Whether you’re using FVGs, OBs, trendlines, or classic support/resistance, make sure your entry is calculated to avoid getting caught in a fakeout. 💪
💬 Let’s Talk Trades!
What’s your take on this EU reversal? Are you jumping in with an FVG, OB, or something else? Drop your thoughts, setups, or questions in the comments below! 👇 If this idea gets you pumped, smash that LIKE button ❤️, follow for more banger trade ideas, and share your charts with the community! Let’s keep the vibes high and the profits higher! 💰
#EURUSD #ForexTrading #BuyTrade #Reversal #TradingView

EURUSD on the riseAfter Wednesday’s volatile spike, the market calmed down yesterday, with EURUSD holding above the support zone.
We’re seeing signs of a potential bottom forming — confirmation of this could open the door for a fresh move higher.
The goal remains to follow the bullish trend, but keep an eye out for signs of exhaustion and a possible pullback.
Stay flexible and ready to adapt!

#EURUSD: Still Extremely Bullish! Let's see how it goes! EURUSD is currently making minor correction and it is likely to reverse in coming days. We have to area from where price could reverse from. we advise you to read the chart and also do your analysis before making any decision.
Like and Comment For More!
Team Setupsfx_

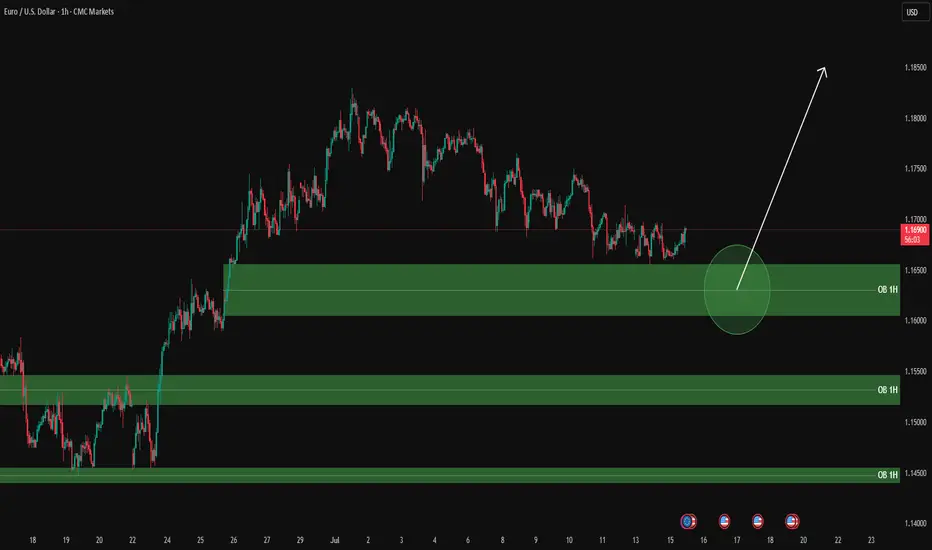
EURUSD analysis – 1H OB Setup
✅ Green zones = 1H Buy Order Blocks
Clean plan:
Wait for price to reach the green circle zone (1.1600 – 1.1650 OB).
Once there:
✅ Drop to LTF (5M / 3M) and wait for:
Price reaction to the OB zone
BOS / CHoCH structure confirmation
Strong bullish candle for clean entry
Then, enter with stop below the OB zone.
🎯 Targets:
First TP: 1.1690 – 1.1700
Second TP: higher previous highs if momentum continues
⚠️ Let price enter your zone, get your LTF confirmations, and then take your entry with discipline.
📊 ProfitaminFX | Gold, BTC & EUR/USD
📚 Daily setups & educational trades
Buying opportunities on EURUSDYesterday, EURUSD saw a sharp spike after reports that Trump might fire the Federal Reserve Chair.
Although this wasn’t confirmed, the news triggered short-term volatility before the market settled down again.
At the moment, EURUSD is reacting to key support levels. Watch for the formation of a higher low and potential signs of a new bullish move.
The goal remains a breakout above the previous high and continuation of the main uptrend.

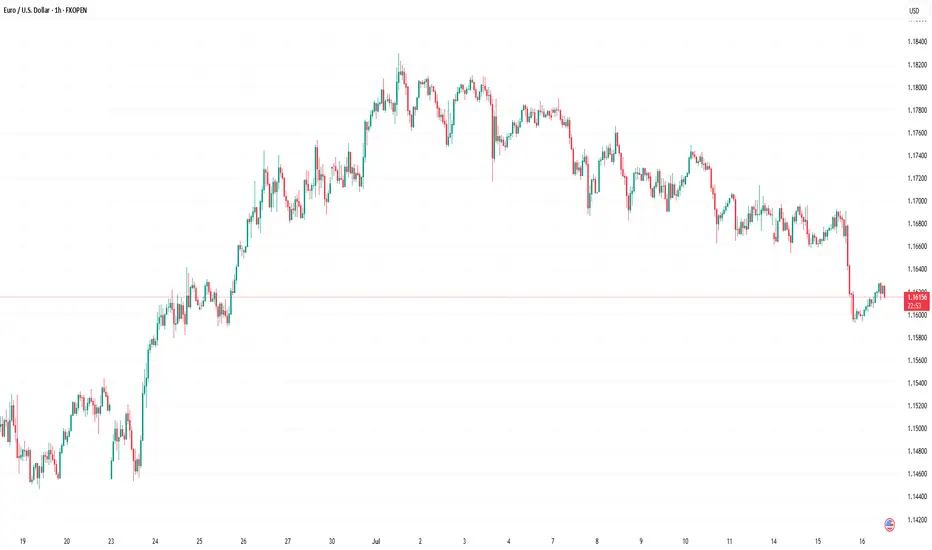
Market Analysis: EUR/USD Pares GainsMarket Analysis: EUR/USD Pares Gains
EUR/USD declined from the 1.1750 resistance and traded below 1.1650.
Important Takeaways for EUR/USD Analysis Today
- The Euro started a fresh decline after a strong surge above the 1.1720 zone.
- There is a connecting bearish trend line forming with resistance at 1.1660 on the hourly chart of EUR/USD at FXOpen.
EUR/USD Technical Analysis
On the hourly chart of EUR/USD at FXOpen, the pair rallied above the 1.1720 resistance zone before the bears appeared, as discussed in the previous analysis. The Euro started a fresh decline and traded below the 1.1660 support zone against the US Dollar.
The pair declined below 1.1620 and tested 1.1590. A low was formed near 1.1592 and the pair started a consolidation phase. There was a minor recovery wave above the 1.1610 level.
EUR/USD is now trading below the 50-hour simple moving average. On the upside, it is now facing resistance near the 1.1630 level. It is close to the 23.6% Fib retracement level of the downward move from the 1.1749 swing high to the 1.1592 low.
The next key resistance is at 1.1660 and the 50% Fib retracement level. There is also a connecting bearish trend line forming with resistance at 1.1660.
The main resistance is near the 1.1690 level. A clear move above it could send the pair toward the 1.1720 resistance. An upside break above 1.1720 could set the pace for another increase. In the stated case, the pair might rise toward 1.1750.
If not, the pair might resume its decline. The first major support on the EUR/USD chart is near 1.1590. The next key support is at 1.1550. If there is a downside break below 1.1550, the pair could drop toward 1.1520. The next support is near 1.1485, below which the pair could start a major decline.
This article represents the opinion of the Companies operating under the FXOpen brand only. It is not to be construed as an offer, solicitation, or recommendation with respect to products and services provided by the Companies operating under the FXOpen brand, nor is it to be considered financial advice.
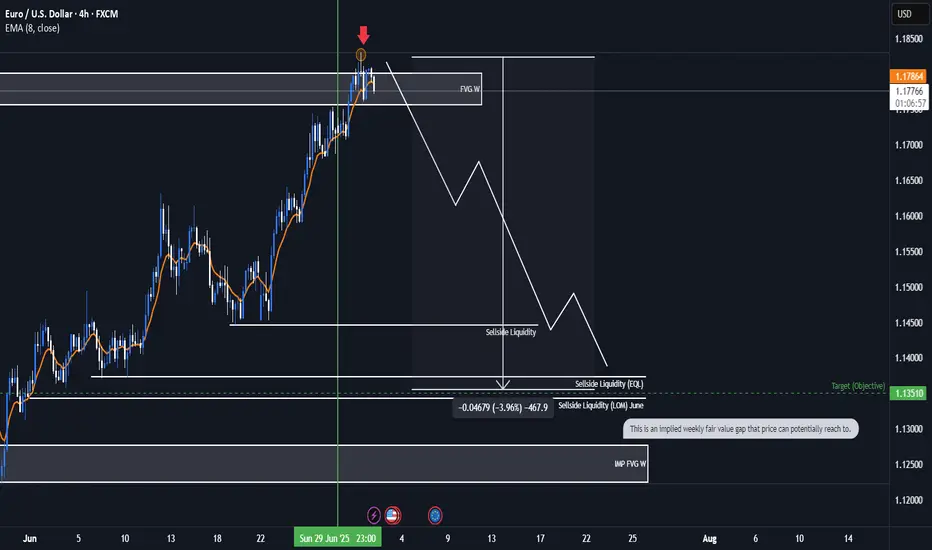
EURUSD Bearish ideaWe are in a weekly fair value gap that we have balance and potentially collected orders to prepare for a potential drop in price. We are anticipating a quarterly shift for the month of July were we could be targeting downside liquidity that is in open float.
* Fundamentals:
-Interest rate differentials shows us that USD interest rate of 4.5 is higher than the interest rate EUR 2.15 which lead to the longer fundamental frame work of price correcting to the higher dollar rate to the euro.
-The COT report also indicates to us that there is huge buying of Dollar by the commercials and a huge amount of selling of the EUR by commercials which can lead us to assume potential weaker dollar.
*Targeting:
-We are looking for the low of last month (June) to be taken out as well as even potentially reaching to the implied weekly fair value gap.
Important News for EURUSDYesterday, EURUSD continued moving sideways as the market waits for upcoming news.
Today at 1:30 PM London time, U.S. inflation data will be released.
This report has a strong impact and is likely to set the next direction for the pair.
It’s advisable to reduce your risk and avoid opening new positions before the news comes out.
The goal is to follow the trend once it resumes!

EURUSD buy zoneEURUSD is holding around levels just below 1,1700.
Tomorrow, U.S. inflation data is expected, which could trigger bigger moves.
The key zone to watch for a reaction is between 1,1591 and 1,1682.
Look for a bounce and potential buying opportunities in that area.
Next resistance levels to keep in mind are 1,1813 and 1,1916!

Ready to Swipe the Pips? | EUR/USD Heist Blueprint Unlocked🏴☠️💸 EUR/USD "Fiber Heist Plan" – Thief Trader Style 💸🏴☠️
The Vault is Open – Swipe the Bullish Bags! 🚀📈💰
🌟Hi! Hola! Ola! Bonjour! Hallo! Marhaba!🌟
Welcome, Money Makers & Market Robbers! 🤑✨
Here’s the latest masterstroke based on our Thief Trading Style™—a tactical breakdown of EUR/USD primed for a bullish breakout robbery. We’re targeting the red zone 🎯—where the weak hands panic, and the real players win.
🔓 Entry Plan (Buy Setup):
🟢 "The vault is wide open!" — We’re planning bullish entries using 15m–30m timeframe swing levels.
✅ Buy Limit Orders: Plot them smartly around most recent swing lows/highs.
⚠️ Chart Alert Suggested: Eyes on the prize, don’t miss the break-in.
🛑 Risk Guard (SL Setup):
💼 Stop-Loss: Set at nearest 30-min swing low (based on your risk appetite).
Remember, it’s about preserving your loot, not just grabbing it.
🎯 Target Area:
🎯 Primary Target: 1.19000
🎯 Optional Trailing SL: Ride the wave, lock the profits as price moves.
🧲 Scalpers' Notice:
Only scalp long. Got big pockets? Jump in. Smaller bags? Swing along.
💡 Trailing stop advised—don’t let the market steal your gains.
💹 Current Market Outlook:
EUR/USD is moving bullish—supported by technical signals, macro news, COT insights, and intermarket vibes.
🧠 Use all tools: Fundamental 📊 + Sentiment 🧭 + Quant + Bias Score 📈.
📎 Want the full breakdown? Check the 👉.Liinkk.🔗
(Keep updated, conditions shift fast!)
⚠️ News Risk Alert:
🚨 Stay alert during news drops—avoid fresh trades then.
Use trailing SLs to lock profits & guard against reversal raids.
💖 Support the Robbery Plan!
💥 Hit that Boost Button 💥 if you're riding with the Thief Team!
We steal smart, we trade sharp — every day’s a new heist in this market.
See you on the next plan! Stay legendary 🐱👤💸🤑🔥

EURUSD PullbackYesterday, EURUSD continued its pullback, reaching 1,1660.
The next support levels to watch are 1,1636 and 1,1591.
Keep an eye on price action around those support levels for potential buying opportunities.
At the current levels, there’s no reason to enter a trade yet!

NFP Bears gathering their troops? or will the Bulls stampede...The past 9 days have been quite interesting for the EUR/USD which has been relentless. Price has been rising like a helium balloon let loose at the park...
Bulls have clearly been in control, not only the past 9 days but since the beginning of the year with the exception of the strong pullback in April & May only to bounce for another 700 pip run.
I am totally USD bearish across the board as I have been mentioning in my analysis videos for the past few months but like all macro moves, we always have pullbacks along the way and that is why I have been shorting the EUR/USD back from 1.1500+ - 1.1700+
I've given this a lot of room to breathe, more than usual but considering the following technical setup, I'm willing to give the Bears some leeway and potentially show me they'll come through.
•Rising Broadening pattern (Where two trendlines start close together only to divergence and expand) - This is a bearish pattern.
•Negative Divergence on the MACD, Linear Regression & the RSI.
•Price has made a run to the yearly R3 pivot level. (Rare extension)
•Last daily candle is a hanging man candlestick (Reversal candle)
•Weekly chart has the EUR/USD at the upper band of a polynomial regression channel which calculates for price extremities in the market.
There are a few more setups as well but it's too much to describe here and I'd have to show it in a video (Which I plan to do over the weekend)
With all of that said... It could all fail lol but seriously speaking... You just can't ask for a better probabilistic setup so whatever happens during NFP... happens.
Aside from the technical aspect... I know yearly R2 around 1.1600 was a hotspot for shorts because divergence was at the early stages and taking a short there wouldn't have been a bad idea but we know institutions are in play as well, so above 1.1600 could have been a huge area to run stop losses and margin calls before a potential reversal.
250 pips would be enough to run a large pool of stops and liquidation.
IF price is going to reverse here during NFP, I believe late longs and breakout/pullback traders are going to try and buy at the trendline at 1.1660ish but it wont hold and trap them on the other side of the trade.
Under that, I can see us pulling back towards 1.1200ish...
If the Bears give up and price continues to climb... the original macro target may very well be under way which was 1.2000 - 1.2200 (Based on a Monthly and 3-Month chart analysis)
As of this writing the EUR/USD is pretty much completely flat which is expected before the NFP fireworks ahead of July 4th.
We'll see what happens tomorrow morning! buckle up!
As always, Good luck and Trade Safe! See you post NFP.

EURUSD Will Keep Growing!
HI,Traders !
#EURUSD is trading in an
Uptrend and the pair broke
The key horizontal level
Of 1.16370 and the breakout
Is confirmed so after a potential
Retest of the support cluster
Of the rising and horizontal
Support lines below we will
Be expecting a bullish continuation !
Comment and subscribe to help us grow !

The trend continues for EURUSDYesterday, EURUSD once again tested the support level at 1,1683 and bounced off it.
The uptrend remains strong, and we are monitoring for its continuation.
All positions should align with the main trend.
Watch for the end of the current pullback as a potential buying opportunity.
The next resistance levels are 1,1813 and 1,1916!

EurUsd - This is the deadly breakout!EurUsd - FX:EURUSD - is about to fly:
(click chart above to see the in depth analysis👆🏻)
EurUsd has been rallying about +15% over the past couple of months. Additionally the breakout at the current resistance trendline is about to be confirmed. Subsequently EurUsd is setting up for another major move higher, which will be painful for all European traders.
Levels to watch: $1.23, $1.11
Keep your long term vision🙏🙏
Philip (BasicTrading)

Uptrend in EURUSDYesterday, EURUSD once again tested the support level at 1,1683 and bounced off it.
We might see another retest of this support zone, but the overall trend remains unchanged.
Watch for signs that the correction is ending — this could present a buying opportunity.
The next resistance levels are at 1,1813 and 1,1916!

EUR/USD Holds Above Key Support — Outlook IntactHi Everyone,
Price briefly dipped below the 1.16680 support, but our broader outlook remains unchanged as long as it continues to hold above the key 1.16450 level. Should buyers successfully defend the 1.16450 zone, we still see potential for the pair to stabilise and make another attempt higher in the coming sessions.
We’ll be monitoring price action closely to see if support continues to hold and whether momentum starts to build back to the upside.
We maintain the view that a decisive break above last week’s high could attract additional buyers, paving the way for a move towards the 1.19290 level and ultimately the 1.20000 level.
We’ll share further updates on the projected path for EUR/USD if price breaks above this key resistance.
The longer-term outlook remains bullish, with expectations for the rally to extend towards the 1.2000 level, provided the price holds above the key support at 1.10649.
We will continue to update you throughout the week with how we’re managing our active ideas and positions. Thanks again for all the likes/boosts, comments and follows — we appreciate the support!
All the best for a good end to the week. Trade safe.
BluetonaFX

EURUSD Will Go Down!
HI,Traders !
#EURUSD is making a
Bullish rebound after a
Bearish breakout but the
Pair will soon hit a new
Horizontal resistance
Of 1.17489 from where
We will be expecting a
Further move down !
Comment and subscribe to help us grow !

EUR/USD Could Take Off From Here! Strategic SetupHi traders! , Analyzing EUR/USD on the 30 minute timeframe, price is currently reacting from a strong support zone near 1.1696, showing potential for a bullish rebound after a sharp drop.
🔹 Entry: 1.1696
🔹 Take Profit (TP): 1.1770
🔹 Stop Loss (SL): 1.1621
After a strong downside move, EUR/USD is attempting a recovery from a key intraday support area. The RSI is bouncing from oversold conditions (around 34), indicating a possible short-term shift in momentum.
Price is also approaching the 200 EMA from below, and a break above could confirm bullish continuation toward the 1.1770 resistance zone. The setup offers a solid risk-reward ratio and aligns with mean reversion expectations.
⚠️ DISCLAIMER: This is not financial advice. Every trader is responsible for their own decisions and risk management.
