EUR/USD "The Fiber" Forex Market Heist Plan🌟Hi! Hola! Ola! Bonjour! Hallo! Marhaba!🌟
Dear Money Makers & Robbers, 🤑💰✈️
Based on 🔥Thief Trading style technical and fundamental analysis🔥, here is our master plan to heist the EUR/USD "The Fiber" Forex Market. Please adhere to the strategy I've outlined in the chart, which emphasizes long entry and short entry. 🏆💸Be wealthy and safe trade.💪🏆🎉
Entry 📈 :
🏴☠️Bullish Entry - "The heist is on! Wait for the MA Pullback at Institutional Hidden Buy Zone (1.11000) & Big Players Verified Trade Zone (1.09000) then make your move - Bullish profits await!"
🏴☠️Bearish Entry - "The vault is wide open! Swipe the Bearish loot at any price.
Stop Loss 🛑:
🚩Thief SL placed at for Bullish Trade (Big Players Verified Trade Zone SL at 1.07000) & (Institutional Hidden Buy Zone SL at 1.09500)
🚩Thief SL placed at 1.13800 for Bearish Trade
Using the 30mins period, the recent / swing low or high level.
SL is based on your risk of the trade, lot size and how many multiple orders you have to take.
Target 🎯:
🏴☠️Bullish Robbers TP 1.17000 (or) Escape Before the Target
🏴☠️Bearish Robbers TP 1.10500 (or) Escape Before the Target
💰💵💸EUR/USD "The Fiber" Forex Market Heist Plan is currently experiencing a Bearish trend 🐻,., driven by several key factors.
📰🗞️Get & Read the Fundamental, Macro Economics, COT Report, Quantitative Analysis, Sentimental Outlook, Intermarket Analysis, Future trend targets with overall score... go ahead to check👉👉👉🔗🔗🌎🌏🗺
Detailed Point-by-Point Recap 📋✨
Fundamentals 📊: USD leads due to Fed policy, US growth, and tariffs; EUR limited by Eurozone risks 💵📉.
Macroeconomics 🌐: US resilience contrasts with Eurozone weakness, favoring USD 🚀📉.
Global Markets 🌍: US equities and yields drive USD strength; Eurozone trade woes hurt EUR 📈📉.
COT Data 📉: Bearish speculative positioning supports USD 🐻.
Seasonality 📅: May historically favors USD, aligning with current trends 📉.
Intermarket 🔗: USD benefits from equity/yield correlations; EUR hit by energy costs 📈📉.
Quantitative 📉: Technicals (RSI, Fibonacci, channels) confirm bearish momentum 🐻.
Sentiment 😣: Bearish institutional bias, with retail shorts suggesting short-term EUR bounce 📉📈.
Trend Prediction 🚀📉: Bearish across timeframes, with downside targets at 1.1080, 1.0445, and 1.00 🐻.
Outlook ⭐: Bearish (7/10), with USD dominance likely to persist 💪📉.
📌Keep in mind that these factors can change rapidly, and it's essential to stay up-to-date with market developments and adjust your analysis accordingly.
⚠️Trading Alert : News Releases and Position Management 📰 🗞️ 🚫🚏
As a reminder, news releases can have a significant impact on market prices and volatility. To minimize potential losses and protect your running positions,
we recommend the following:
Avoid taking new trades during news releases
Use trailing stop-loss orders to protect your running positions and lock in profits
💖Supporting our robbery plan 💥Hit the Boost Button💥 will enable us to effortlessly make and steal money 💰💵. Boost the strength of our robbery team. Every day in this market make money with ease by using the Thief Trading Style.🏆💪🤝❤️🎉🚀
I'll see you soon with another heist plan, so stay tuned 🤑🐱👤🤗🤩
Eurusdtradeidea

EUR/USD "The Fiber" Forex Bank Money Heist Plan (Bearish)🌟Hi! Hola! Ola! Bonjour! Hallo! Marhaba!🌟
Dear Money Makers & Robbers, 🤑💰✈️
Based on 🔥Thief Trading style technical and fundamental analysis🔥, here is our master plan to heist the EUR/USD "The Fiber" Forex Market. Please adhere to the strategy I've outlined in the chart, which emphasizes short entry. Our aim is the high-risk GREEN Zone. It's a Risky level, oversold market, consolidation, trend reversal, trap at the level where traders and bullish robbers are stronger. 🏆💸"Take profit and treat yourself, traders. You deserve it!💪🏆🎉
Entry 📈 : "The heist is on! Wait for the Neutral Level breakout then make your move at (1.12600) - Bearish profits await!"
however I advise to Place sell stop orders above the Moving average (or) after the Support level Place sell limit orders within a 15 (or) 30 minute timeframe most NEAREST (or) SWING low or high level for Pullback entries.
📌I strongly advise you to set an "alert (Alarm)" on your chart so you can see when the breakout entry occurs.
Stop Loss 🛑: "🔊 Yo, listen up! 🗣️ If you're lookin' to get in on a sell stop order, don't even think about settin' that stop loss till after the breakout 🚀. You feel me? Now, if you're smart, you'll place that stop loss where I told you to 📍, but if you're a rebel, you can put it wherever you like 🤪 - just don't say I didn't warn you ⚠️. You're playin' with fire 🔥, and it's your risk, not mine 👊."
📌Thief SL placed at the nearest/swing High or Low level Using the 3H timeframe (1.14200) Day/Scalping trade basis.
📌SL is based on your risk of the trade, lot size and how many multiple orders you have to take.
Target 🎯: 1.10800
💰💵💸EUR/USD "The Fiber" Forex Market Heist Plan (Day Trade) is currently experiencing a Bearish trend.., driven by several key factors.👇👇👇
📰🗞️Read the Fundamental, Macro Economics, COT Report, Seasonal Factors, Intermarket Analysis, Inventory and Storage Analysis, Sentimental Outlook, Future trend predict.
Before start the heist plan read it. go ahead to check 👉👉👉🔗🔗🌎🌏🗺
⚠️Trading Alert : News Releases and Position Management 📰 🗞️ 🚫🚏
As a reminder, news releases can have a significant impact on market prices and volatility. To minimize potential losses and protect your running positions,
we recommend the following:
Avoid taking new trades during news releases
Use trailing stop-loss orders to protect your running positions and lock in profits
💖Supporting our robbery plan 💥Hit the Boost Button💥 will enable us to effortlessly make and steal money 💰💵. Boost the strength of our robbery team. Every day in this market make money with ease by using the Thief Trading Style.🏆💪🤝❤️🎉🚀
I'll see you soon with another heist plan, so stay tuned 🤑🐱👤🤗🤩

EURUSD – 1H Update on Our Previous EURUSD Post +60 PipsAs expected from our last idea, price reacted well to our 1H Order Block zones.
🔹 Upon receiving bullish confirmation on the 3-minute timeframe, we entered a long position, which has now moved 60 pips in our favor.
📍 Current Setup:
Price is now at a decision point – around yesterday’s high (PDH) and the 1H supply (OB).
✅ If price breaks above PDH (dashed yellow line), it could lead to a clean break of the 1H resistance and continuation to the upside.
🚫 However, if bullish momentum weakens, there’s a real chance price may pull back to collect buy-side liquidity in the blue and green demand boxes below.
⚠️ It’s Friday – trade with caution!
Late-week volatility and false spikes are common before weekly close.
🔍 Insight by ProfitaminFX
If this outlook aligns with your bias, or if you see it differently, feel free to share your perspective in the comments. Let’s grow together 📈

EURUSD time for correctionMonthly
On the monthly timeframe, we came to the Premium zone and captured Monthly Fractal High, where previously there was predominance from the sell side.
Weekly
Price has formed a Weekly FVG, indicating strong dominance from the buy side. However, it is important to understand WHERE this has led us ? The current quotes are interesting for sellers. Hence, we should assume that the price may receive a counter offer from the sell side. It is logical to assume potential points A and B in this context.
Daily
Price has formed primary signs of change in the price delivery state:
- Bullish PD Array disrespecting
- BISI forming
- CISD forming
All this indicates a shift of initiative to the selling side, so it is logical to expect a continuation of the downward movement after interaction with the marked PD Array.
Also, I would like to draw your attention to the fact that the price is within the Inside Bar for the 3rd day already. This means that recently the price has been held within the same values, which indicates a balance of power between buyers and sellers at the current quotes. In such a situation, all we have to do is to find the optimal area to continue the downward price formation.

"Dare to Swipe EUR/USD Gains with Our Risky Heist Blueprint?"Ultimate EUR/USD Heist Plan: Snag Profits with the Thief Trading Strategy! 🚀💰
🌍 Greetings, Wealth Raiders! Ciao, Hello, Bonjour, Hola! 🌟
Fellow profit hunters, get ready to crack the EUR/USD "The Fiber" Forex vault with our slick Thief Trading Strategy! 🤑💸 This plan blends razor-sharp technicals and fundamentals to loot the market. Follow the chart’s long-entry blueprint to strike at high-risk zones like the Red MA (short-term traders) or the Red Zone Resistance (long-term traders). It’s a wild ride—overbought conditions, consolidation, and potential trend reversals mean bears are lurking! 🐻 Stay sharp, grab your profits, and treat yourself—you’ve earned it! 🎉💪
📈 Entry: Storm the Vault!
The market’s ripe for a bullish grab! 💥 Place buy limit orders within the most recent 15 or 30-minute swing low/high levels. Set alerts on your chart to stay locked in. 🔔
🛑 Stop Loss: Guard Your Loot!
Set your Thief SL at the nearest swing low on the 4H timeframe for day/swing trades. Adjust based on your risk tolerance, lot size, and number of orders. Safety first! 🔒
🎯 Targets: Claim Your Prize!
🏴☠️ Short-Term Target: 1.14700
🏴☠️ Long-Term Target: 1.17000
👀 Scalpers, Listen Up!
Stick to long-side scalps. Got deep pockets? Jump in now! Otherwise, join swing traders for the heist. Use trailing stop-loss to lock in gains and protect your stash. 💰
🐂 Why EUR/USD is Hot!
The Fiber’s bullish surge is fueled by key fundamentals. Dive into Macro, COT Reports, Quantitative Analysis, Sentiment, Intermarket trends, and future targets via the linkss below for the full scoop. 👉🔗. Stay informed to stay ahead! 📰
⚠️ Trading Alert: News & Position Management
News releases can shake the market like a heist gone wrong! 🗞️ To protect your profits:
🚫 Avoid new trades during news events.
🛡️ Use trailing stops to secure running positions.
💥 Boost the Heist!
Hit the Boost Button to supercharge our Thief Trading Strategy! 💪 Every click strengthens our crew, making it easier to swipe profits daily. Join the squad, trade smart, and let’s make money rain! 🌧️💵

EUR/USD Bullish Setup: Key Pullback Zone & Trade Plan📊 EUR/USD Technical Analysis – Bullish Trend in Play 📊
In this latest breakdown, I dive into the EUR/USD pair, which is currently showing strong bullish momentum on the higher timeframes 🔥. Price action has been respecting a clean uptrend, forming a sequence of higher highs and higher lows — a textbook bullish market structure ✅.
In the video, I walk you through:
- The daily chart setup and what’s fueling the current move upward 🗓️
- My key interest zones for a possible pullback entry 🔁
- What I'm watching on the 4H and 30-minute timeframes for confirmation ⏱️
- Target areas, including recent swing highs and liquidity levels 🧲
Ideally, I’d like to see price pull back into equilibrium (around the 50% level of the recent range). If we get that retracement and a bullish break of structure, I’ll be looking to get long on this move 📈🟢.
⚠️ Disclaimer: This is not financial advice. Please do your own research and manage risk accordingly. 🛡️📉

Symmetrical Triangle Breakout: EUR/USD Eyes Higher Levels..!📊 EUR/USD Technical Analysis – Breakout Watch..! 💥
🕰 Timeframe: 4H | 📅 Date: May 20, 2025
By: @Kartik\_Elkunchwar
The EUR/USD pair is showing an **interesting structure** with strong breakout potential. Here's the breakdown:
🔍 Chart Pattern Observed: Symmetrical Triangle
After a strong uptrend since late March, price consolidated into a symmetrical triangle, marked by lower highs and higher lows.
This formation typically indicates indecision in the market, but it often precedes a strong breakout.
📈 Uptrend Intact
The dotted line labeled UP-TREND shows that the bullish momentum is still present, with price respecting the rising support line over time.
This trendline has acted as a reliable dynamic support, reinforcing the bullish bias.
🔔 Recent Price Action
Price recently broke out above the upper trendline of the triangle, closing around **1.1275**.
This breakout is accompanied by a surge in momentum and could signal the resumption of the bullish trend.
📌 Key Levels to Watch
Resistance Zone: 1.1300 – If price breaks and sustains above this level, we could see a rally toward **1.1400–1.1450**.
Support Zone: 1.1200 and 1.1100 – In case of a false breakout or retest, these levels may act as buying opportunities.
🧠 Conclusion
The EUR/USD pair is giving a **potential long setup** after consolidating for weeks. A confirmed breakout above the triangle indicates **buyers may be gaining control**. Watch for a **retest and bounce** for higher conviction entries.
📉 What’s your take on EUR/USD? Bullish or Bearish..?
Drop your analysis in the comments! 💬

SELL!! BUT DON'T SHORT WITHOUT REASON EURUSD FORECAST Q2 W21 Y25EURUSD SHORT FORECAST Q2 W21 Y25
SELL!!!! BUT DON'T SHORT WITHOUT REASON!
EURUSD IS READY TO TAKE YOUR ACCOUNT. THERE IS A WRAFT OF KEY LEVELS TO POTENTIALLY SHORT FROM.
I KNOW. I HAVE INDEED IDENTIFIED THEM HOWEVER ... let's not KILL out accounts !!!!! lets be sure when to pull the trigger on shorts!!!!
I'll be honest, I foresee a reaction from every point of interest BUT, dependant on YOUR entry model, depends if you can get Breakeven faster than the rest or even to take profit.
SELL IS THE PLAY BUT BE SMART...
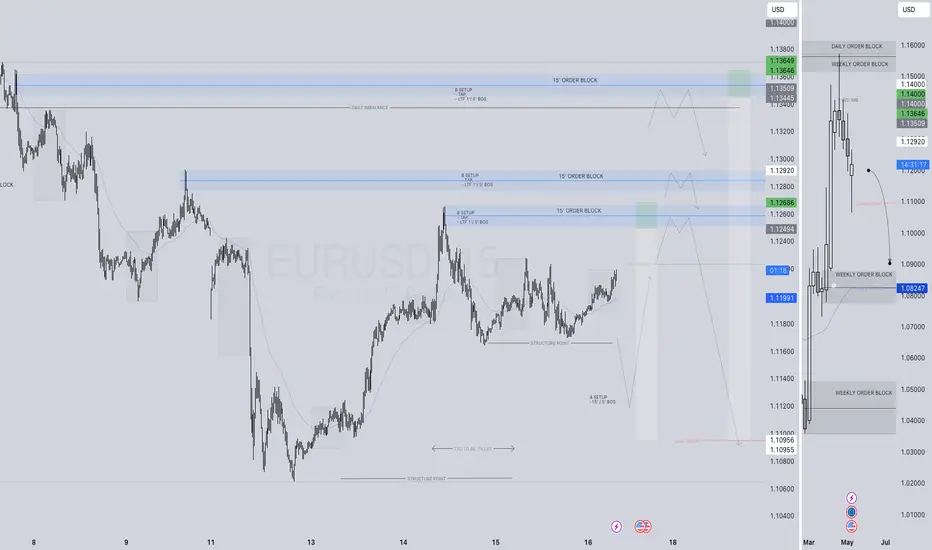
EURUSD SHORT FORECAST Q2 W20 D15 Y25
Professional Risk Managers👋
Welcome back to another FRGNT chart update📈
Diving into some Forex setups using predominantly higher time frame order blocks alongside confirmation breaks of structure.
Let’s see what price action is telling us today!
💡Here are some trade confluences📝
✅Weekly order block rejection
✅HTF Bearish price action
✅Intraday 15' order blocks
✅Tokyo ranges to be filled
🔑 Remember, to participate in trading comes always with a degree of risk, therefore as professional risk managers it remains vital that we stick to our risk management plan as well as our trading strategies.
📈The rest, we leave to the balance of probabilities.
💡Fail to plan. Plan to fail.
🏆It has always been that simple.
❤️Good luck with your trading journey, I shall see you at the very top.
🎯Trade consistent, FRGNT X

EUR/USD Set for Bullish Continuation: Key Levels to WatchEUR/USD shows strong bullish momentum across all timeframes, signaling a potential continuation rally. On the daily chart, the pair remains above key EMAs (55, 89, 200), with support near 1.1100 and resistance at 1.1228 and 1.1400. The RSI suggests consolidation, but overall structure favors the bulls.
The hourly chart confirms a fresh bullish breakout above the 200 EMA at 1.1215, supported by increased volume and a rising RSI. Price action suggests a retest of the 1.1190–1.1215 zone as a buying opportunity.
On the 15-minute chart, EUR/USD is overbought short-term, but momentum remains strong. A pullback into the 1.1190–1.1200 zone could offer low-risk scalping entries targeting 1.1225–1.1240.
The week-ahead plan favors dip-buying strategies. Initial targets are 1.1250 and 1.1300, with stops below 1.1180. A close above 1.1228 on the daily chart would confirm room for broader upside. Manage risk with staggered entries and hard stops.

EUR/USD Shorts to LongsMy outlook for EU mirrors GU: we may see a sell‑off develop. There’s a nearby 1‑hour supply zone I’m watching, but upside liquidity could invalidate it.
A clean demand zone also awaits mitigation; once touched, it could fuel the next bullish leg. I’ll wait to see which direction price chooses first to determine which POI is hit.
Confluences for EU sells are as follows:
A clean 1‑hour supply that triggered a minor change of character to the downside.
Asian session low and other liquidity pools sit below, inviting a sweep.
Price has been in a multi‑week bearish trend.
DXY structure aligns with this bearish scenario.
P.S. If price pierces the supply, sweeps the upside liquidity, and breaks structure higher, I’ll look for the new demand zone that forms and reassess for potential longs.

EURUSD SHORT FORECAST Q2 W20 D16 Y25EURUSD SHORT FORECAST Q2 W20 D16 Y25
Professional Risk Managers👋
Welcome back to another FRGNT chart update📈
Diving into some Forex setups using predominantly higher time frame order blocks alongside confirmation breaks of structure.
Let’s see what price action is telling us today!
💡Here are some trade confluences📝
✅Weekly order block rejection
✅4H 50 EMA
✅Intraday 15' order blocks
✅Tokyo ranges to be filled
🔑 Remember, to participate in trading comes always with a degree of risk, therefore as professional risk managers it remains vital that we stick to our risk management plan as well as our trading strategies.
📈The rest, we leave to the balance of probabilities.
💡Fail to plan. Plan to fail.
🏆It has always been that simple.
❤️Good luck with your trading journey, I shall see you at the very top.
🎯Trade consistent, FRGNT X
EURUSD SHORT FORECAST Q2 W20 D15 Y25EURUSD SHORT FORECAST Q2 W20 D15 Y25
Professional Risk Managers👋
Welcome back to another FRGNT chart update📈
Diving into some Forex setups using predominantly higher time frame order blocks alongside confirmation breaks of structure.
Let’s see what price action is telling us today!
💡Here are some trade confluences📝
✅Weekly order block rejection
✅Gap fill
✅Intraday 15' order blocks
✅Tokyo ranges to be filled
🔑 Remember, to participate in trading comes always with a degree of risk, therefore as professional risk managers it remains vital that we stick to our risk management plan as well as our trading strategies.
📈The rest, we leave to the balance of probabilities.
💡Fail to plan. Plan to fail.
🏆It has always been that simple.
❤️Good luck with your trading journey, I shall see you at the very top.
🎯Trade consistent, FRGNT X

EURUSD – This Week’s SetupAs shown in the previous analysis, the key levels have been broken 🔓.
We’re now waiting for a pullback to short from the marked level 🔽.
But if price goes straight to the lower level without a pullback, we’ll look for a buy opportunity there 🔼🎯.
Exact price levels shown on the chart!
Live markets need live plans! ⚔️📈
For detailed entry points, trade management, and high-probability setups, follow the channel:
ForexCSP

EURUSD SHORT FORECAST Q2 W20 D14 Y25EURUSD SHORT FORECAST Q2 W20 D14 Y25
Professional Risk Managers👋
Welcome back to another FRGNT chart update📈
Diving into some Forex setups using predominantly higher time frame order blocks alongside confirmation breaks of structure.
Let’s see what price action is telling us today!
💡Here are some trade confluences📝
✅Weekly order block rejection
✅Gap fill
✅Intraday 15' order blocks
✅Tokyo ranges to be filled
🔑 Remember, to participate in trading comes always with a degree of risk, therefore as professional risk managers it remains vital that we stick to our risk management plan as well as our trading strategies.
📈The rest, we leave to the balance of probabilities.
💡Fail to plan. Plan to fail.
🏆It has always been that simple.
❤️Good luck with your trading journey, I shall see you at the very top.
🎯Trade consistent, FRGNT X

Bearish AB=CD - Sell at Current Price!FX:EURUSD has broken its bullish support and formed a bearish AB=CD pattern. AB=CD is a bearish continuation pattern which aligns with the overall price action.
I am shorting EURUSD at current market price and expecting retracement until Point D to complete the pattern!

EUR/USD consolidates ahead of US CPICMCMARKETS:EURUSD EUR/USD holds above the 1.1110 area ahead of key US inflation data. The pair rebounded modestly after finding support near the breakout zone (1.1046-1.1100), but upward momentum is capped by minor resistance at 1.1127. A failure to break above this level may expose the 1.1046 support. Technically, the broader trend remains under pressure, as the pair trades below trendline resistance and recent breakdown levels. The upcoming US CPI release could trigger volatility and provide directional confirmation.
Resistance: 1.1127, 1.1212
Support: 1.1046, 1.0960

EURUSD SHORT FORECAST Q2 W20 D13 Y25EURUSD SHORT FORECAST Q2 W20 D13 Y25
Professional Risk Managers👋
Welcome back to another FRGNT chart update📈
Diving into some Forex setups using predominantly higher time frame order blocks alongside confirmation breaks of structure.
Let’s see what price action is telling us today!
💡Here are some trade confluences📝
✅Weekly order block rejection
✅Gap fill
✅Intraday 15' order blocks
✅Tokyo ranges to be filled
🔑 Remember, to participate in trading comes always with a degree of risk, therefore as professional risk managers it remains vital that we stick to our risk management plan as well as our trading strategies.
📈The rest, we leave to the balance of probabilities.
💡Fail to plan. Plan to fail.
🏆It has always been that simple.
❤️Good luck with your trading journey, I shall see you at the very top.
🎯Trade consistent, FRGNT X

EURUSD breakdown?Hello traders, this is a complete multiple timeframe analysis of this pair. We see could find significant trading opportunities as per analysis upon price action confirmation we may take this trade. Smash the like button if you find value in this analysis and drop a comment if you have any questions or let me know which pair to cover in my next analysis.

EUR/USD Bearish Setup: Supply Zone Rejection Toward1.0900 Target(Swing Trade Setup)
📉 Trendline + CHoCH Confirmation
🔻 Downtrend marked by a falling blue trendline.
🔄 CHoCH (Change of Character) shows a bearish market structure shift, confirmed by a lower low.
🟦 Supply Zone (Sell Zone)
💥 Strong seller reaction previously occurred between:
1.12956 – 1.13896
🔹 Wait for price to retrace into this zone.
🎯 Ideal for short entries.
🎯 Entry & Stop-Loss
🔵 Entry Point: Around 1.12956 – 1.13005
(below supply zone and EMA)
🛑 Stop Loss: 1.13896 – 1.13929
(above the last high + supply zone)
🟦 EMA 70 (Purple Line)
📈 Currently at 1.13051
Acts as dynamic resistance — strengthening the short setup.
🏁 Target Zone
🎯 Main Target: 1.09000
Marked as TARGET POINT 1.0900
🟦 Support Levels Inside Target Zone:
1.09229
1.09150
1.08814
✅ Summary of Trade Idea
📍 Short Position
⬆️ Entry: ~1.13000
🛑 Stop Loss: ~1.13900
⬇️ Take Profit: ~1.09000
⚖️ Risk-to-Reward: ~1:3+ potential

#EURUSD: At Perfect Area to Swing Sell Worth 1300+ Pips! The FX:EURUSD price is currently showing strong sell momentum, indicating a potential strong bearish trend in the coming time. We’ve already taken two swing sell positions on EURUSD. There are three targets you can set according to your own plan and strategy.
The DXY index suggests further price growth in the coming weeks. Please ensure you manage your risk while trading. This is our concept only and does not guarantee the movements we’ve shown in our analysis. Therefore, please conduct your own analysis before taking any swing entry.
Good luck and trade safely!
Wishing you good luck and safe trading!
Thank you for your support! 😊
If you’d like to contribute, here are a few ways you can help us:
- Like our ideas
- Comment on our ideas
- Share our ideas
Team Setupsfx_
❤️🚀

EUR/USD bearish outlookEUR/USD Weekly Outlook – Bearish Scenario in Play
This week’s outlook for EUR/USD is leaning towards a bearish continuation.
Price recently respected the 3H demand zone and gave a clean bullish reaction following the expected Asia low sweep. I didn’t manage to catch an entry as it happened quite late in the day. However, that same demand zone now looks to be weakening, potentially leading to another break of structure to the downside.
Alternatively, we could see price push higher from this demand zone and mitigate the 8H supply zone I’ve marked out — which is the origin of the last break of structure. It’s also a strong POI given its location away from liquidity and at an extreme structural point.
Confluences for EUR/USD Sells:
- Multiple breaks of structure to the downside (pro-trend setup)
- Failing 3H demand zone already mitigated
- Liquidity resting below current price
- Strong 8H supply zone sitting above the Asia highs
- DXY is showing short-term bullish momentum, aligning with EUR/USD bearish movement
P.S. If price doesn’t push higher into the 8H supply zone, I’ll be watching for a new supply zone to form mid-week for a more immediate short opportunity.
Will keep this updated — have a great trading week everyone!

EURUSDThe third and final trade of the day will be on EURUSD.
Following the significant depreciation of the Euro during the U.S. and Asian sessions yesterday, I expect this downward trend to continue today as well. That’s why I’m opening a sell trade on the 15-minute chart (as always, using a short-term timeframe).
🔍 Criteria:
✔️ Timeframe: 15M
✔️ Risk-to-Reward Ratio: 1:2
✔️ Trade Direction: Sell
✔️ Entry Price: 1.12932
✔️ Take Profit: 1.12743
✔️ Stop Loss: 1.13028
🔔 Disclaimer: This is not financial advice. It's a trade I’m taking based on my own system, shared purely for educational purposes.
📌 If you're also interested in systematic and data-driven trading strategies:
💡 Don’t forget to follow the page and subscribe to stay updated on future analyses.

Range-Bound EUR/USD: Sell Setup Pending Dollar StrengthI'm currently watching the EUR/USD currency pair, and it appears to be under pressure while trading within a range 📉. If you check out the chart in the video 📊, you’ll see what I mean. I’m on the lookout for a potential sell opportunity, but only if the upcoming data release signals strength for the US dollar 💵. In that case, I’d be watching for a break and retest of the current range low—(BoS). My targets would be set two levels below, aiming to close the position by the end of the New York session 🗽. Please note, this is not financial advice! 🚫
