EUR/USD Bullish Setup! 📢 EUR/USD Bullish Setup! 📢
📈 Targeting Extreme Order Block!
🔹 Looking for buys from Weekly FVG 50% Level 🎯
🔹 Waiting for confirmation before entry!
🚀 Are you ready to catch the move? 🚀
📊 Stay updated – Follow our TradingView page! 📍
Eurusdtrading

EURUSD: Channel Down topped. Huge sell ahead.EURUSD corrected the previously overbought levels on its 1D technical outlook (RSI = 60.799, MACD = 0.009, ADX = 25.183) and 1W is expected to follow suit as the price is making a double rejection at the top of the 2 year Channel Down. We anticipate a new -9.25% long term bearish wave to begin (TP = 1.01300).
## If you like our free content follow our profile to get more daily ideas. ##
## Comments and likes are greatly appreciated. ##

FXAN & Heikin Ashi Trade IdeaOANDA:EURUSD
In this video, I’ll be sharing my analysis of EURUSD, using FXAN's proprietary algo indicators with my unique Heikin Ashi strategy. I’ll walk you through the reasoning behind my trade setup and highlight key areas where I’m anticipating potential opportunities.
I’m always happy to receive any feedback.
Like, share and comment! ❤️
Thank you for watching my videos! 🙏

EURUSD: Forming long term top inside 5 days.EURUSD is bullish on its 1D technical outlook (RSI = 59.837, MACD = 0.006, ADX = 25.790) as since last Thursday it is rebounding on the 1D MA200. This is a perfect repetition of the September 2024 Double Top and right now we are on the final mini Channel Up, which inside 5 days priced that past top. Consequently we are prepared to turn bearish by halfway next week and aim for the S1 initially (TP = 1.0400).
See how our prior idea has worked out:
## If you like our free content follow our profile to get more daily ideas. ##
## Comments and likes are greatly appreciated. ##

EURUSD:The euro is facing a "battle at key resistance levels"The EURUSD exchange rate continues its rebound momentum. Although the weak inflation data in the eurozone has strengthened the market's expectation of an interest rate cut by the ECB, the US dollar has weakened due to the risk - off sentiment triggered by Trump's tariff remarks, which has become a key factor supporting the short - term upward movement of the euro.
We can focus on the initial resistance level of 1.0880 above. If this level is not breached, one can attempt to short at high levels.
Trading strategy:
Sell@1.0880
TP:1.0780
Get daily trading signals that ensure continuous profits! With an astonishing 90% accuracy rate, I'm the record - holder of an 800% monthly return. Click the link below the article to obtain accurate signals now!

EURUSD:Pay special attention to the resistance level at 1.0850In the future, two major variables will dominate the trend of the euro:
1、Details of tariff policies: If the US imposes tariffs on the EU with an intensity exceeding expectations, the euro may quickly test the support level of 1.0750. Conversely, if the measures are mild or postponed, the exchange rate may rebound above 1.0900.
2、Linkage of US economic data: If the manufacturing PMI and non-farm payroll data reinforce the "American economic exceptionalism", the US dollar may regain buying interest and suppress the euro. If the data is weak, it will solidify the expectation of an interest rate cut by the Federal Reserve in June, which is bearish for the US dollar.
We can focus on the initial resistance level of 1.0850 above. If this level is not breached, one can attempt to short at high levels.
Trading strategy:
Sell@1.0850
TP:1.0750
Get daily trading signals that ensure continuous profits! With an astonishing 90% accuracy rate, I'm the record - holder of an 800% monthly return. Click the link below the article to obtain accurate signals now!

EURUSD:Analysis of the Profit-making Strategies for Next WeekThe euro against the US dollar once retraced to around 1.0765. Subsequently, it stabilized slightly after the release of the US core Personal Consumption Expenditures (PCE) inflation data for February. Since the year-on-year growth rate of this data exceeded expectations, the market's expectation that the Federal Reserve will maintain the current interest rate range of 4.25%-4.50% for a longer time has intensified. Moreover, the United States is set to impose an additional 25% tariff on imported automobiles starting from April 2nd, which adds more uncertainties to the outlook of the euro.
We can focus on the initial resistance level of 1.0850 above. If this level is not breached, one can attempt to short at high levels.
Trading strategy:
Sell@1.0850
TP:1.0750
Get daily trading signals that ensure continuous profits! With an astonishing 90% accuracy rate, I'm the record - holder of an 800% monthly return. Click the link below the article to obtain accurate signals now!

EURUSD Weekly Candle RangeTrading is hard but it's simple.
On the 1W, EURUSD traded into a key zone and ended with a long wick, indicating a strong rejection. I'm looking to find entries in the wick area and targeting CRH for the rest of the week. Do have a lovely weekend. For me, I'd be looking at ETHUSDT 😅

EURUSD:Today's trading strategyThe EUR/USD is fluctuating and consolidating around 1.0790, having weakened for six consecutive trading days previously. US President Trump's announcement of imposing a 25% tariff on imported automobiles and their components starting from April 2nd has made the market worried that the economic and trade relations between the US and major economies are facing more uncertainties.
As can be seen from the chart, the EUR/USD has continuously declined. After hitting a low of 1.0732 at the lowest, it stabilized and rebounded. Currently, it is trading within the range of 1.0780-1.0790. If the exchange rate can break through the resistance level of 1.0830 above, it is expected to test the 1.09 mark. If it is blocked and pulls back, one should be vigilant about retesting the support area of 1.0732 again. In the short term, the EUR/USD may continue to have a wide range of fluctuations within the range of 1.0700-1.0830.
Trading strategy:
Sell@1.0830
TP:1.0730
Get daily trading signals that ensure continuous profits! With an astonishing 90% accuracy rate, I'm the record - holder of an 800% monthly return. Click the link below the article to obtain accurate signals now!

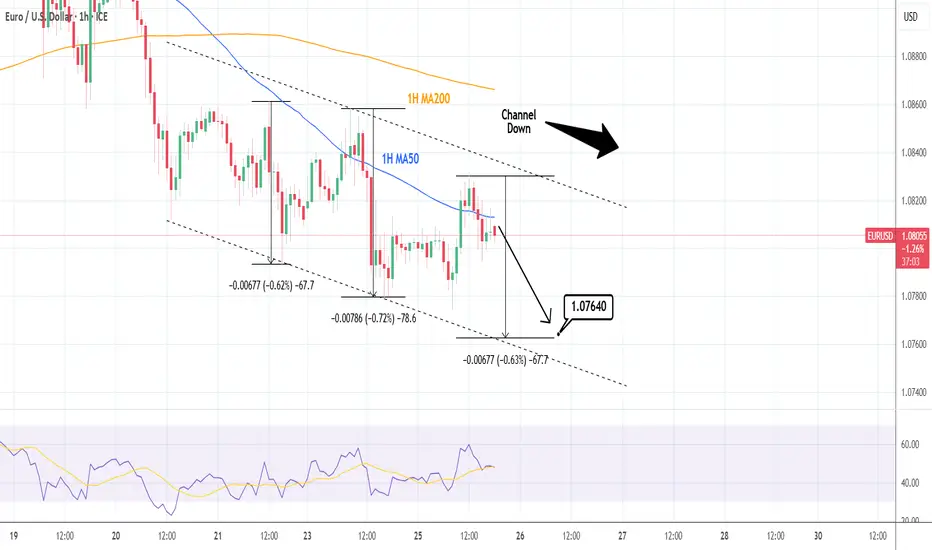
EURUSD: Channel Down on 1H targeting 1.07640EURUSD is neutral on its 1H technical outlook (RSI = 48.104, MACD = 0.000, ADX = 18.254) as it is at the top of the 5 day Channel Down and around the 1H MA50. This is the new bearish wave. Short and aim for a -0.62% decline (TP = 1.07640).
## If you like our free content follow our profile to get more daily ideas. ##
## Comments and likes are greatly appreciated. ##
The trend of the EURUSD fluctuates and declines downwardOn Monday, as expected, the EUR/USD pair generally trended downwards. The price dropped to a low of 1.0781 and climbed to a high of 1.0857 on that day, closing at 1.0800.
Looking back at Monday's market performance, the price made a short - term upward correction right after the morning opening. Then, as anticipated, it reached the resistance levels on the four - hour chart and within the daily resistance range before halting its ascent. The price came under renewed pressure and declined during the pre - US session and the US trading session, ultimately closing with a large bearish candlestick on the daily chart.
Currently, on the daily chart, special attention should be paid to the resistance area around 1.0860. As long as the price stays below this level, a downward - pressured trend can be expected for the swing trading. Meanwhile, from the perspective of the four - hour chart in the short term, the area around 1.0770 needs to be closely watched. Once it is broken below, the focus should shift to the area around 1.0720.
Trading strategy:
Sell@1.0820-1.0830
TP:1.0770-1.0720
Get daily trading signals that ensure continuous profits! With an astonishing 90% accuracy rate, I'm the record - holder of an 800% monthly return. Click the link below the article to obtain accurate signals now!

EURUSD(20250324) Today's AnalysisToday's buying and selling boundaries:
1.0824
Support and resistance levels:
1.0887
1.0863
1.0848
1.0799
1.0784
1.0760
Trading strategy:
If the price breaks through 1.0824, consider buying, the first target price is 1.0848
If the price breaks through 1.0799, consider selling, the first target price is 1.0784

Matador the EUR/USD Bull? - Bears about to jump in?After the previous 3 weeks of bullish havoc, the bears may have finally decided to pump the breaks on EUR/USD buyers.
As price continued to push higher, I held on to short positions that I began building up at 1.0851 & 1.0909 as I wanted to wait and see if the Pivot level R1 area (1.0935) was going to provide the wall to begin declining back down.
Once I saw the lack of advancement, I opened another strong short position at 1.0912 and now sitting at an overall average price of 1.0891.
I like this trade, however I am still staying cautious on that 1.0800 level. I want to see this price point clearly broken and trading below it, otherwise I will keep my stop at a close break-even point for risk protection. Overall, so far so good but we need to break through 1.0800.
From a purely technical analysis point of view, I see a small scale rising broadening pattern and this usually indicates a drop to the starting point of the pattern will take place however, If we drop aggressively, I may eye that 1.0600 level again which will lock in almost 300 pips but as I just said, these patterns usually return to their starting point so 1.0300 or below is not out of the question. I guess it depends on how the price action is looking whether I'd close or hold.
1.0600 is around the yearly pivot point so that is a good marker to shoot for IMO. Interestingly, the MACD and RSI show a rising broadening pattern as well so that gives me a little bit more conviction in this trade.
I see some other markers for this trade as well but I will share that in my next upcoming market preview video since it'd be too much to type.
As always, Good Luck & Trade Safe

EUR/USD Outlook – Potential Downtrend After Channel BreakdownOverview:
Pair: EUR/USD
Timeframe: 4-Hour (4H)
Broker: OANDA
Current Price: 1.08436
Trend: Potential Reversal
Technical Analysis:
The EUR/USD pair has been trading within a rising channel, indicating a bullish trend. However, recent price action shows a breakout to the downside, suggesting a potential bearish reversal.
The price failed to sustain above resistance and is now heading lower.
Breakdown confirmation suggests further downside movement.
Target: 1.06166, which aligns with a previous consolidation zone.
Trading Strategy:
📉 Bias: Bearish below the channel breakdown
🎯 Target: 1.06166 (Key Support)
🔍 Confirmation: Additional bearish momentum with lower highs and lower lows

EURUSD(20250320) Today's AnalysisToday's buying and selling boundaries: 1.0903
Support and resistance levels:
1.0988
1.0956
1.0935
1.0871
1.0850
1.0819
Trading strategy:
If the price breaks through 1.0935, consider going long, with the first target price at 1.0956
If the price breaks through 1.0903, consider going short, with the first target price at 1.0871

EURUSD: Big Bearish Divergence on 4H.EURUSD is bullish on its 1D technical outlook (RSI = 66.538, MACD = -0.013, ADX = 29.911) but just crossed under the 4H MA50 for the first time since the March 3rd 2025 breakout when the parabolic rally started. The strongest sell signal is nonetheless given by the 4H RSI which, while the price is on a Channel Up, it has been on a Channel Down, i.e. a Bearish Divergence. The previous time an uptrend broke below its 4H MA50 on the same RSI Bearish Divergence was on the September 30th 2024 High. The result was a strong bearish breakdown to the S1 level. Consequently, we can turn bearish here and aim a little higher than S1 (TP = 1.0400).
## If you like our free content follow our profile to get more daily ideas. ##
## Comments and likes are greatly appreciated. ##

EUR/USD Continued strength or FOMC Fallout?In this analysis I go over the EUR/USD and it's potential for further gains or a weakening bull and drop.
I expect a volatile week considering it's FOMC on Wednesday and ECB speaking on Friday.
Additionally, I share my outlook on ETF's I'm involved in. Currently in QQQE Put Option and closed my TQQQ Put for 30% gains last week.
As always, Good Luck and Trade Safe.

EUR/USD Analysis: Next Week's Downward - Swing ProspectsDuring this week, the exchange rate once dipped to 1.0820 and then rebounded. Technically speaking, 1.0880 is a key resistance level. If this level cannot be broken through, the downward risk will intensify. In the short term, the euro-dollar pair is under downward pressure and may fall below 1.0820. The options market shows that the ranges of 1.0745 - 1.0755 and 1.0900 - 1.0910 will be the focus next week. Overall, the euro-dollar pair is likely to show a downward trend with fluctuations next week.
I firmly believe realized profit and a high win - rate are the best measures of trading skill. Daily, I share highly precise trading signals. These include clear entry points, stop - loss levels for risk control, and profit - taking targets from in - depth analysis. Follow me for big financial market returns. Click my profile for a trading guide on trends, strategies, and risk management.

EUR/USD "The Fiber" Forex Market Bank Heist Plan🌟Hi! Hola! Ola! Bonjour! Hallo! Marhaba!🌟
Dear Money Makers & Robbers, 🤑💰🐱👤🐱🏍
Based on 🔥Thief Trading style technical and fundamental analysis🔥, here is our master plan to heist the EUR/USD "The Fiber" Forex market. Please adhere to the strategy I've outlined in the chart, which emphasizes long entry. Our aim is the high-risk Red Zone. Risky level, overbought market, consolidation, trend reversal, trap at the level where traders and bearish robbers are stronger. 🏆💸Book Profits Be wealthy and safe trade.💪🏆🎉
Entry 📈 : "The vault is wide open! Swipe the Bullish loot at any price - the heist is on!
however I advise to Place buy limit orders within a 15 or 30 minute timeframe most recent or swing, low or high level. I Highly recommended you to put alert in your chart.
Stop Loss 🛑:
Thief SL placed at the recent / nearest low level Using the 4H timeframe (1.04000) swing trade basis.
SL is based on your risk of the trade, lot size and how many multiple orders you have to take.
Target 🎯:
Primary Target - 1.06700 (or) Escape Before the Target
Secondary Target - 1.08000 (or) Escape Before the Target
🧲Scalpers, take note 👀 : only scalp on the Long side. If you have a lot of money, you can go straight away; if not, you can join swing traders and carry out the robbery plan. Use trailing SL to safeguard your money 💰.
📰🗞️Fundamental, Macro, COT Report, Quantitative Analysis, Intermarket Analysis, Sentimental Outlook:
EUR/USD "The Fiber" Forex Market market is currently experiencing a bullish trend,., driven by several key factors.
⭐🌟⭐Fundamental Analysis
Fundamental analysis evaluates the economic indicators of the Eurozone and the United States, which directly influence the EUR/USD pair.
🌟Eurozone Economic Indicators:
GDP growth is reported at 0.5% for Q4 2024, with recent data suggesting an expected increase to 0.8% for Q1 2025, indicating a potential recovery Euro Area Indicators.
Inflation rate is at 3.0% for February 2025, expected to decrease to 2.2% by year-end, reflecting easing price pressures Euro Area Inflation Rate.
Interest rates are at 2.5%, with the European Central Bank (ECB) likely to hold steady, given mixed inflation signals Euro Area Interest Rate.
Trade balance shows a surplus of €10 billion in January 2025, driven by exports, though not sufficient to offset economic challenges Euro Area Balance of Trade.
🌟United States Economic Indicators:
GDP growth is strong at 2.5% for Q4 2024, though recent projections suggest a slowdown to 2.0% for Q1 2025 United States Indicators.
Inflation is stable at 2.0% for February 2025, within target ranges, but recent data shows slight upward pressure United States Inflation Rate.
Interest rates are at 4.5%, with expectations of a 0.25% rate cut in September 2025, reflecting a dovish shift United States Interest Rate.
Trade balance shows a deficit of $50 billion in January 2025, a persistent challenge but manageable with strong economic growth United States Balance of Trade.
The narrowing interest rate differential, with potential Fed rate cuts and stable ECB policy, could support EUR strength, though US economic resilience remains a counterforce.
⭐🌟⭐Macroeconomics
Macroeconomics encompasses broader economic factors influencing the pair:
Global GDP growth is projected at 3.0% for 2025, according to recent forecasts, with mixed regional performances World Economic Outlook.
Commodity prices are stable, with oil at $80 per barrel, impacting EUR due to the Eurozone's energy import reliance Commodity Markets Outlook.
Stock markets show positive performance, with the S&P 500 up 5% YTD and Euro Stoxx 50 up 3% YTD, supporting risk-sensitive currencies like the EUR Global Stock Market Performance.
Bond yields are declining, with the US 10-year yield at 3.5%, down from 4.0% earlier, suggesting lower USD appeal Global Economic Outlook.
⭐🌟⭐Global Market Analysis
Global economic conditions play a significant role in currency movements:
Geopolitical events, such as potential tensions, could boost USD as a safe-haven currency, though no major events are currently noted.
Central bank policies are diverging, with the Fed expected to cut rates and the ECB holding steady, narrowing the interest rate differential Central Bank Policies.
Commodity trends, with stable oil prices, have a muted direct impact, though energy costs affect Eurozone inflation.
Stock market performance, with global indices up, suggests risk-on sentiment, potentially supporting EUR over USD Market Performance Analysis.
⭐🌟⭐COT Data and Positioning
COT data provides insights into large trader positions, with recent reports showing:
For euro futures, large speculators are net short, but recent data indicates a reduction in short positions, suggesting emerging bullish sentiment CFTC COT Report.
Positioning shows that institutional traders are cautiously optimistic, with some covering shorts as the price approaches support levels.
Key Insight: Reducing short positions in euro futures align with potential bullish momentum, supporting an upward move.
⭐🌟⭐Intermarket Analysis
Intermarket relationships influence currency valuation:
EUR/USD is positively correlated with stock markets; with global indices performing well, the EUR could benefit from risk-on sentiment Intermarket Correlations.
Gold, trading at $1900 per ounce, slightly up, suggests a weaker USD, supporting EUR strength Gold Price Trends.
Bond yields, with declining US yields, indicate lower USD appeal, potentially boosting EUR/USD Bond Market Insights.
Key Insight: Positive correlations with stocks and gold suggest EUR could strengthen, while declining US yields support this trend.
⭐🌟⭐Quantitative Analysis
Technical analysis provides insights into price trends:
At 1.05000, EUR/USD is approaching key support at 1.0450, with resistance at 1.0600, based on recent charts EUR/USD Technical Analysis.
Moving averages show the 50-day MA at 1.0550 and the 200-day MA at 1.0700, with the price below both, indicating a downtrend TradingView Analysis.
RSI (Relative Strength Index) is at 45, neutral, suggesting potential for a bounce if support holds Technical Indicators Guide.
Key Insight: The pair is at a crucial support level, with technicals suggesting a possible upward reversal.
⭐🌟⭐Market Sentimental Analysis
Market sentiment reflects trader positioning and expectations:
Recent data shows mixed sentiment, with some traders expecting USD strength to continue, while others see potential for EUR recovery due to improving fundamentals Forex Sentiment EURUSD.
Bank forecasts predict EUR/USD rising to 1.08 by year-end, citing Eurozone recovery and expected Fed rate cuts Currency Forecasts.
Key Insight: Emerging optimism about the euro supports a bullish outlook, though caution remains due to recent USD strength.
⭐🌟⭐Next Trend Move
Combining all factors, the next trend move for EUR/USD is likely upward:
The pair is at a key support level (1.0450), and if it holds, could bounce back to test resistance at 1.0800.
Potential catalysts include better-than-expected Eurozone data and Fed rate cut expectations, supporting EUR strength.
Key Insight: The next move favors an upward continuation, with risks of further downside if support breaks.
⭐🌟⭐Overall Summary Outlook
The EUR/USD pair, at 1.05000 on March 4, 2025, exhibits a cautiously bullish outlook. Key drivers include improving Eurozone fundamentals, with GDP growth expected to rise to 0.8% in Q1 2025 and declining inflation, narrowing the interest rate differential as the Fed is expected to cut rates by 0.25% in September 2025. Technical indicators suggest the pair is at a crucial support level, with potential for a bounce, supported by reducing short positions in euro futures and positive intermarket correlations with stocks and gold. Risks include persistent USD strength if US data remains robust or global risk-off sentiment boosts the USD. However, the prevailing trend points to a potential EUR appreciation in the near term.
⭐🌟⭐Future Prediction
Trend: Bullish
Details: The pair is likely to see an upward move, testing resistance at 1.0800 in the near term, driven by Eurozone recovery and expected Fed rate cuts. Risks include stronger-than-expected US data maintaining USD dominance, but current indicators suggest a reversal is imminent.
📌Keep in mind that these factors can change rapidly, and it's essential to stay up-to-date with market developments and adjust your analysis accordingly.
⚠️Trading Alert : News Releases and Position Management 📰 🗞️ 🚫🚏
As a reminder, news releases can have a significant impact on market prices and volatility. To minimize potential losses and protect your running positions,
we recommend the following:
Avoid taking new trades during news releases
Use trailing stop-loss orders to protect your running positions and lock in profits
💖Supporting our robbery plan 💥Hit the Boost Button💥 will enable us to effortlessly make and steal money 💰💵. Boost the strength of our robbery team. Every day in this market make money with ease by using the Thief Trading Style.🏆💪🤝❤️🎉🚀
I'll see you soon with another heist plan, so stay tuned 🤑🐱👤🤗🤩

EUR/USD "The Dollar Crusher" Forex Market Bullish Heist Plan🌟Hi! Hola! Ola! Bonjour! Hallo!🌟
Dear Money Makers & Thieves, 🤑 💰🐱👤
Based on 🔥Thief Trading style technical and fundamental analysis🔥, here is our master plan to heist the EUR/USD "The Dollar Crusher" Forex market. Please adhere to the strategy I've outlined in the chart, which emphasizes long entry. Our aim is the high-risk Red Zone. Risky level, overbought market, consolidation, trend reversal, trap at the level where traders and bearish robbers are stronger. 🏆💸Be wealthy and safe trade.💪🏆🎉
Entry 📈 : "The heist is on! Wait for the breakout (1.04500) then make your move - Bullish profits await!"
however I advise placing Buy Stop Orders above the breakout MA or Place Buy limit orders within a 15 or 30 minute timeframe. Entry from the most recent or closest low or high level should be in retest.
Stop Loss 🛑: Thief SL placed at 1.03500(swing Trade) Using the 2H period, the recent / nearest low level.
SL is based on your risk of the trade, lot size and how many multiple orders you have to take.
Target 🎯: 1.07000 (or) Escape Before the Target
Scalpers, take note 👀 : only scalp on the Long side. If you have a lot of money, you can go straight away; if not, you can join swing traders and carry out the robbery plan. Use trailing SL to safeguard your money 💰.
📰🗞️Fundamental, Macro, COT, Sentimental Outlook:
EUR/USD "The Dollar Crusher" Forex Market market is currently experiencing a bullish trend,., driven by several key factors.
🔴Fundamental Analysis
- The Eurozone's economic growth is expected to slow down, while the US economy is expected to grow at a moderate pace.
- The European Central Bank (ECB) is expected to keep interest rates steady, while the Federal Reserve is expected to maintain its accommodative monetary policy.
🟤Macro Analysis
- The Eurozone's inflation rate is expected to remain low, while the US inflation rate is expected to remain above the Federal Reserve's target.
- The Eurozone's trade balance is expected to remain in surplus, while the US trade balance is expected to remain in deficit.
🟠Sentimental Analysis
- Institutional investors have a bullish sentiment towards the EUR/USD pair, with 55% of investors being bullish.
- Hedge funds have increased their long positions in the EUR/USD pair, with a net long exposure of 12%.
🟣COT Analysis
- The Commitments of Traders (COT) report shows that commercial traders have increased their long positions in the EUR/USD pair, with a net long exposure of 10%.
- Non-commercial traders have also increased their long positions, with a net long exposure of 15%.
🟡Trader Sentiment
- Retail traders have a bullish sentiment towards the EUR/USD pair, with 52% of traders being bullish.
- Commercial banks have increased their EUR/USD holdings, with a growth rate of 5%.
🔵Bullish and Bearish Data:
- Bullish Sentiment: Institutional investors have a bullish sentiment towards the EUR/USD pair, with 55% being bullish. Hedge funds have increased their long positions, with a net long exposure of 12%
- Bearish Sentiment: Asset managers are trimming their long exposure, and gross shorts are trending higher for large specs and asset managers since Q4
🟢Based on this analysis, the EUR/USD pair is expected to move in a bullish trend, with a 55% chance of an uptrend and a 35% chance of a downtrend. However, please note that market predictions can be unpredictable and influenced by various factors
⚠️Trading Alert : News Releases and Position Management 📰 🗞️ 🚫🚏
As a reminder, news releases can have a significant impact on market prices and volatility. To minimize potential losses and protect your running positions,
we recommend the following:
Avoid taking new trades during news releases
Use trailing stop-loss orders to protect your running positions and lock in profits
📌Please note that this is a general analysis and not personalized investment advice. It's essential to consider your own risk tolerance and market analysis before making any investment decisions.
📌Keep in mind that these factors can change rapidly, and it's essential to stay up-to-date with market developments and adjust your analysis accordingly.
💖Supporting our robbery plan will enable us to effortlessly make and steal money 💰💵 Tell your friends, Colleagues and family to follow, like, and share. Boost the strength of our robbery team. Every day in this market make money with ease by using the Thief Trading Style.🏆💪🤝❤️🎉🚀
I'll see you soon with another heist plan, so stay tuned 🤑🐱👤🤗🤩

EURUSD: Overbought but 1H Channel Up is still intact.EURUSD is massively overbought on its 1D technical outlook (RSI = 73.384, MACD = 0.012, ADX = 38.553) but on the short term we have a Channel Up pattern that's good until broken. The 1H MA50-MA100 Zone is in firm support of this structure and every time a bearish wave like the current one bottoms inside this pattern, the price rallies by +1.15%. So as long as the 1H MA100 holds, buy (TP = 1.09800). If the 1H MA100 fails and breaks, sell and aim for the 1H MA200 (TP = 1.07500>
## If you like our free content follow our profile to get more daily ideas. ##
## Comments and likes are greatly appreciated. ##

EUR/USD at Key Resistance: Is a Major Retrace Coming? 💹📉
In this video, we dive deep into the EUR/USD currency pair and analyze the current market conditions. 📊 At the moment, the pair is overextended and trading into a critical weekly resistance level. 🚨 There's a high probability that the buy orders driving the price higher will interact with the buy stops resting at this zone, potentially triggering a significant retracement. 🔄 Join me as we break down the trend, price action, and market structure, and explore a potential trade idea based on these insights. 🧠💡 Whether you're a seasoned trader or just starting out, this analysis will give you valuable perspectives on how to approach key levels in the market. ⚠️ This is not financial advice—always trade responsibly! ⚠️
Don't forget to like, comment, and subscribe for more market insights! 👍📈✨

EUR/USD Ready to DROP? | Monthly FVG Sell Zone in Focus! 💰 Smart Money Preparing for a Bearish Move on EUR/USD!
The EUR/USD is reacting from a key Monthly Fair Value Gap (FVG) and is currently in a Monthly Corrective Phase (CRT). This signals that institutions might be positioning for a larger bearish move.
