EUR/USD Rallies on Broad Dollar WeaknessEUR/USD Rallies on Broad Dollar Weakness
EUR/USD started a fresh increase above the 1.1750 resistance.
Important Takeaways for EUR/USD Analysis Today
- The Euro started a decent increase from the 1.1600 zone against the US Dollar.
- There is a connecting bullish trend line forming with support near 1.1770 on the hourly chart of EUR/USD at FXOpen.
EUR/USD Technical Analysis
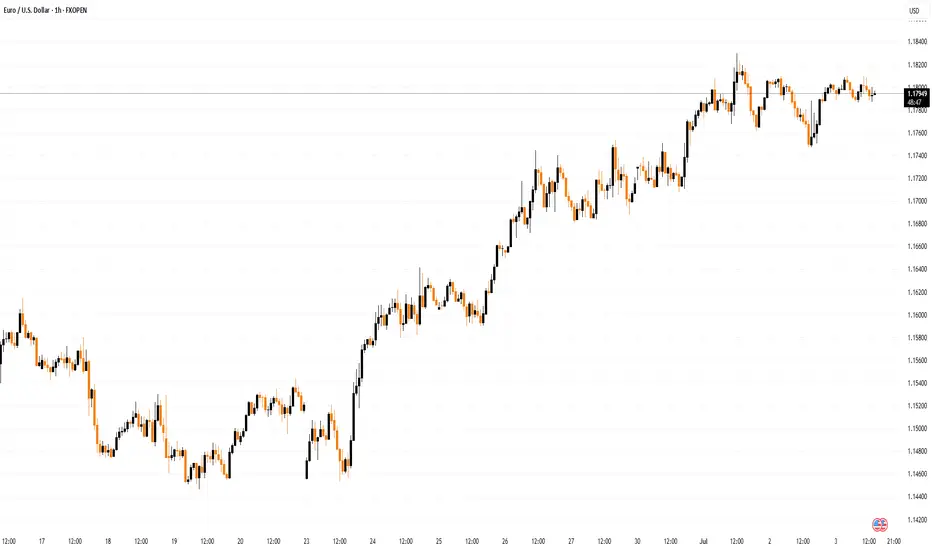
On the hourly chart of EUR/USD at FXOpen, the pair started a fresh increase from the 1.1600 zone. The Euro cleared the 1.1650 resistance to move into a bullish zone against the US Dollar.
The bulls pushed the pair above the 50-hour simple moving average and 1.1750. Finally, the pair tested the 1.1830 resistance. A high was formed near 1.1829 and the pair is now consolidating gains above the 23.6% Fib retracement level of the upward wave from the 1.1590 swing low to the 1.1830 high.
Immediate support on the downside is near a connecting bullish trend line at 1.1770. The next major support is the 1.1710 level. A downside break below the 1.1710 support could send the pair toward the 1.1680 level and the 61.8% Fib retracement level of the upward wave from the 1.1590 swing low to the 1.1830 high.
Any more losses might send the pair into a bearish zone toward 1.1645. Immediate resistance on the EUR/USD chart is near the 1.1830 zone. The first major resistance is near the 1.1850 level. An upside break above the 1.1850 level might send the pair toward the 1.1920 resistance.
The next major resistance is near the 1.1950 level. Any more gains might open the doors for a move toward the 1.2000 level.
This article represents the opinion of the Companies operating under the FXOpen brand only. It is not to be construed as an offer, solicitation, or recommendation with respect to products and services provided by the Companies operating under the FXOpen brand, nor is it to be considered financial advice.
Eurusdtrend
EUR/USD Analysis: Rally May Be Under ThreatEUR/USD Analysis: Rally May Be Under Threat
The euro has appreciated by approximately 15% against the US dollar this year, as confidence in the United States continues to wane. As ECB Chief Economist Philip Lane noted in an interview at CNBC: “There is a degree of reorientation by global investors towards the euro.”
At the same time, officials at the European Central Bank have expressed concern that the rapid strengthening of the euro could undermine efforts to stabilise inflation at 2%. They warn that a move above $1.20 may pose risks for inflation and the competitiveness of export-oriented firms — an issue raised during the ECB’s ongoing ECB Forum on Central Banking in Portugal.
Could EUR/USD Reach the $1.20 Level?
From a technical analysis perspective, EUR/USD is showing bearish signals:
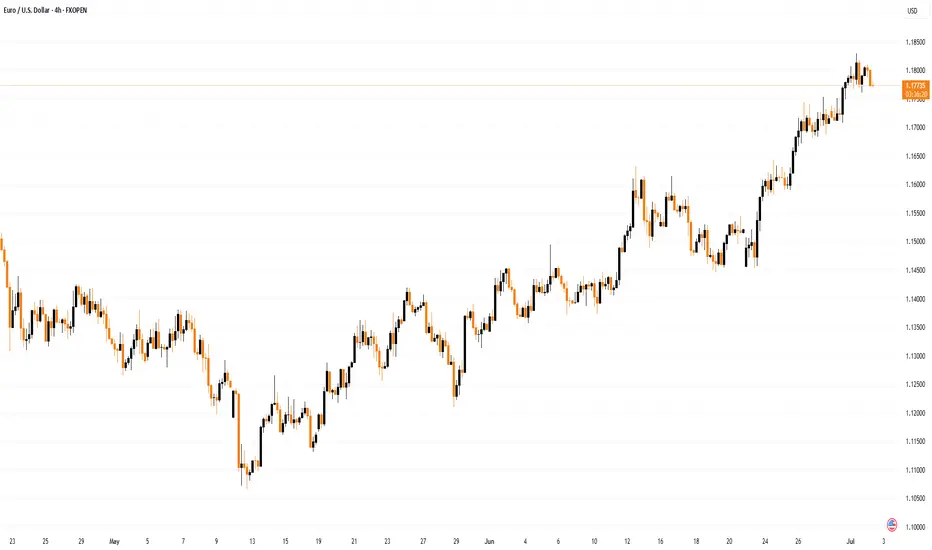
→ If the early April rally (coinciding with Trump’s announcement of new tariffs) is taken as the initial impulse wave A→B, and the May low is interpreted as the end of the B→C corrective move, then, according to Fibonacci Extensions, the pair has now risen to a key resistance zone around 1.1850 (as indicated by the arrow on the chart).
→ In addition, the RSI indicator signals strong overbought conditions, while the price is hovering near the upper boundary of the ascending channel — a level that typically acts as resistance.
Given these factors, we could assume that EUR/USD may be in a vulnerable position, potentially facing a short-term correction — possibly towards the lower boundary of the channel, reinforced by support at the 1.1620 level. However, this does not negate the longer-term bullish outlook for the euro amid prevailing fundamental conditions.
This article represents the opinion of the Companies operating under the FXOpen brand only. It is not to be construed as an offer, solicitation, or recommendation with respect to products and services provided by the Companies operating under the FXOpen brand, nor is it to be considered financial advice.
EUR/USD Weekly – Two Long Setups Hello guys!
It is my perspective on eurusd!
Before we even reach the major resistance zone around 1.2050–1.2100, I’ve highlighted two long-term opportunities that may unfold as the price continues to climb.
✔ First Long Position:
It looks like a more conservative entry. The price is already above it. You can set a pending position!
It was likely aiming to catch the momentum as the price broke above the previous structure.
TP is near the descending trendline, around 1.2050–1.2100. a smart place to exit before major resistance hits.
✔ Second Long Position:
Positioned slightly lower. probably in case of a pullback or retest into the broken zone.
This one offers better risk-reward, but requires patience and a cleaner retracement.
Both longs are short-to mid-term swing ideas, aiming to ride the bullish leg into the bigger trendline rejection zone, where I’d personally be more cautious or even look for reversal setups.

EURUSD..BUYAnalysis complete — scenarios outlined. The zone could be a decision point for . Price reaction here may define the next move.
If price breaks and pulls back to retest, a reversal setup might emerge.

#EURUSD: +770 Pips Swing Move, DXY to Plumment! EURUSD is extremely bullish and is on track to cross the 1.21 area in our long-term swing plan. Based on recent price action, we have set two targets. As DXY continues to drop, the price is likely to remain bullish in the coming days or weeks. Please use accurate risk management while trading and consider this analysis.
Good luck and trade safely!
-Like
-Comment
-Share
Team Setupsfx_

#EURUSD:Expecting A Strong Bull Move, Two Entries | Two TargetsIn our previous analysis, we clearly stated that the price would remain bullish as the DXY had to plummet, and it did exactly that, rising by 450 pips from our last entry. Currently, we have two areas from which we can see the price reversing. The first one is nearby and has a higher risk compared to our second entry, which may be safer for some traders. We need a strong confirmation before making any significant decisions.
Good luck and trade safely. We wish you the best in your trading journey.
Team Setupsfx_

EUR/USD Pair Hits Yearly HighEUR/USD Pair Hits Yearly High
Yesterday, the EUR/USD exchange rate rose above the 1.1700 level for the first time this year. The last time one euro was worth more than 1.70 US dollars was in autumn 2019.
The main driver behind the euro’s rise is the weakening dollar, largely due to decisions made by the Trump administration. This week alone, the EUR/USD pair has gained more than 2%, partly as a result of escalating tensions between the US President and the Chair of the Federal Reserve.
According to Reuters, Trump called Powell “terrible” and said he had three or four candidates in mind for the top job at the Fed. It was also reported that Trump had considered selecting and announcing a replacement for Powell by September or October (his current term officially runs until May 2026).
Technical Analysis of the EUR/USD Chart
Price movements are forming an upward channel (highlighted in blue), with the following observations:
→ Midweek, the price consolidated around the channel’s median line (as indicated by arrow 1);
→ It then broke through the 1.6300 level with strong bullish momentum (shown by arrow 2), a level that had acted as resistance earlier in the month;
→ The long upper wicks on the candles forming yesterday’s highs (circled) suggest increased selling pressure near the upper boundary of the channel.
Given this, we could assume that in the short term, the price might form a new consolidation zone around the median line above the 1.6300 level. Significant fundamental catalysts would be required to break the developing upward trend.
This article represents the opinion of the Companies operating under the FXOpen brand only. It is not to be construed as an offer, solicitation, or recommendation with respect to products and services provided by the Companies operating under the FXOpen brand, nor is it to be considered financial advice.

eurusd updateentry price 1.1329
stop loss update 1.133
take profit
1.153
1.165
1.177
1.194
result we hit first two target

Shorting Optimism: EUR/USD Rally vs RealityAfter the spike to 1.1640 driven by temporary ceasefire news and USD weakness, I’ve taken a short position on EUR/USD. The market priced in too much optimism too fast, and I see limited upside beyond this zone in the current macro landscape. I’m positioned for a controlled retracement back toward the 1.1460–1.1520 region.
The play? Fade the overextension, follow structure, and manage from strength.
Technicals:
• The pair ran into a strong supply zone near 1.1640, which aligns with a previous liquidity sweep.
• Momentum has slowed visibly on lower timeframes, with candles rejecting highs and wicks printing upper tails.
• Daily and 4H SMAs are overstretched. The 20 SMA on H4 is accelerating upward, but RSI is near overbought and flattening.
• My short entry was taken with a stop above 1.1745 and first target at 1.1540, second at 1.1500.
• A potential retest of the 1.1660 zone could offer additional entries if invalidation remains intact.
Fundamentals:
• ECB vs Fed Divergence: The Fed holds firm on rates amid sticky inflation, while the ECB is under pressure to ease further due to weak growth.
• EU Struggles: PMI data remains in contraction territory; HICP cooling to 1.7% YoY suggests little reason for tightening.
• Political Instability: Germany and France both facing internal political crises — risk premia rising.
• Ceasefire Priced In: EUR rally on Middle East headlines lacks depth — conflict paused, not resolved.
• USD Resilience: Weak recent data aside, the USD remains a safe haven. Fed’s Powell reiterated that cuts aren’t imminent.
⚠️ Bias: Bearish as long as price trades below 1.1640. Watching how the market reacts to Fed testimony and ECB rhetoric this week.
🧠 Reminder: Don’t get emotional after vertical rallies. When everyone gets excited, I look for exhaustion. That’s where trades begin.
Note: Please remember to adjust this trade idea according to your individual trading conditions, including position size, broker-specific price variations, and any relevant external factors. Every trader’s situation is unique, so it’s crucial to tailor your approach to your own risk tolerance and market environment.

EURUSD Will Keep Growing!
HI,Traders !
#EURUSD is trading in an
Uptrend along the rising
Support and the pair will
Soon retest the support
From where we will be
Expecting a bullish rebound
And a bullish continuation !
Comment and subscribe to help us grow !

Summer VibesHello everyone, we a special shart movements in this month , things doesn't look bad as always, because falls and rises are always present in our life.
and opportunities comes in the rights moment..
Please make your studies before going for a random idea on the internet and trade at your own risk:
in this one, we can see the struggle of rising and we can see an Deja vu back flash into to past, the image is well clear then the written so enjoy.
thank you for leaving a comments.

EURUSDThis levels is for reactions to support and resistace.
Price can now in Bull-trend if keep 1.145$ in sypport and breaked trendline.
⚠️Control risk management for positions.

EURUSD Trade Plan: Retracement Into Key Fibo Zone POI.I’m currently watching EURUSD closely 👀. On the daily timeframe, it’s clearly broken structure and is now in a bullish trend 📈. Dropping down to the lower timeframes 🕒, price appears overextended and is now trading into a previous resistance level 🚧.
I’m anticipating a retracement into equilibrium — specifically the 50% level of the current swing, and ideally into the 50–61.8% Fibonacci retracement zone 🔁. If price pulls back into that range, I’ll be watching for a bullish market structure shift 🔄. I don’t want to see it push below the bullish imbalance 📉—I want that zone to hold as support so price can continue north 🔼.
If this plays out, my ideal entry would be around the imbalance and the 50% Fib level, with a stop loss just below the imbalance, and targets set at the current swing high and previous swing high, as detailed in the video 🎯.
⚠️ Disclaimer
This is not financial advice. Trading involves risk and you should only trade with capital you can afford to lose. Please do your own analysis or consult a licensed financial advisor.

EURUSDEURUSD have one more down and then go back up if geopolitical situation calms down.
Disclosure: We are part of Trade Nation's Influencer program and receive a monthly fee for using their TradingView charts in our analysis.

EURUSD Breaks Structure: Bullish Continuation Opportunity💶 EUR/USD Analysis – Bullish Momentum Builds 📈
Taking a look at the EUR/USD on the daily chart, it’s clear the pair is currently in a strong bullish trend 🚀. Momentum has been building consistently, reflecting underlying euro strength and continued USD weakness.
🕓 On the 4H timeframe, we’ve now seen a clear shift in market structure to the upside, confirming bullish intent. Look for a continuation entry after a retracement back into equilibrium — ideally around the 50% level of the current price swing 🔄📐.
🎯 Trade Plan Idea:
Wait for price to pull back into equilibrium 🌀
Entry: Long from the discounted zone 🟩
Stop loss: Just below the recent swing low 🔻
Target: Previous high as a logical take-profit zone 🎯📊
⚠️ Disclaimer:
This content is for educational and informational purposes only and should not be considered financial advice. Always do your own research and consult with a qualified financial advisor before making any trading decisions. 📚💼

EURUSD(20250619) Today's AnalysisMarket news:
Fed's June interest rate meeting - kept interest rates unchanged for the fourth consecutive time. The dot plot shows two rate cuts this year, but the number of officials who expect no rate cuts this year has risen to 7, and the rate cut expectations for next year have been reduced to 1. Powell continues to call for uncertainty, and the current economic situation is suitable for waiting and watching. He also expects tariff-driven inflation to rise in the coming months.
Technical analysis:
Today's buying and selling boundaries:
1.1489
Support and resistance levels:
1.1558
1.1532
1.1516
1.1463
1.1446
1.1420
Trading strategy:
If the price breaks through 1.1489, consider buying in, with the first target price of 1.1516
If the price breaks through 1.1463, consider selling in, with the first target price of 1.1446

Market Analysis: EUR/USD Faces RejectionMarket Analysis: EUR/USD Faces Rejection
EUR/USD declined from the 1.1640 resistance and traded below 1.1550.
Important Takeaways for EUR/USD Analysis Today
- The Euro started a fresh decline after a strong surge above the 1.1600 zone.
- There is a connecting bearish trend line forming with resistance at 1.1545 on the hourly chart of EUR/USD at FXOpen.
EUR/USD Technical Analysis
On the hourly chart of EUR/USD at FXOpen, the pair rallied above the 1.1600 resistance zone before the bears appeared, as discussed in the previous analysis. The Euro started a fresh decline and traded below the 1.1550 support zone against the US Dollar.
The pair declined below 1.1520 and tested the 1.1475 zone. A low was formed near 1.1475 and the pair started a consolidation phase. There was a minor recovery wave above the 1.1495 level.
The pair tested the 23.6% Fib retracement level of the downward move from the 1.1614 swing high to the 1.1475 low. EUR/USD is now trading below 1.1550 and the 50-hour simple moving average. On the upside, the pair is now facing resistance near the 1.1505 level.
The next key resistance is at 1.1545 and the 50% Fib retracement level of the downward move from the 1.1614 swing high to the 1.1475 low. There is also a connecting bearish trend line forming with resistance at 1.1545.
The main resistance is near the 1.1580 level. A clear move above the 1.1580 level could send the pair toward the 1.1615 resistance. An upside break above 1.1615 could set the pace for another increase. In the stated case, the pair might rise toward 1.1650.
If not, the pair might resume its decline. The first major support on the EUR/USD chart is near 1.1475. The next key support is at 1.1450. If there is a downside break below 1.1450, the pair could drop toward 1.1400. The next support is near 1.1350, below which the pair could start a major decline.
This article represents the opinion of the Companies operating under the FXOpen brand only. It is not to be construed as an offer, solicitation, or recommendation with respect to products and services provided by the Companies operating under the FXOpen brand, nor is it to be considered financial advice.

EUR/USD Set to Soar or Crash? Forecast for next weekEverything is simple, if price will drop i will be looking for longs in daily FVG
if price goes up till PWH i will expect move towards daily FVG
If you like this type of content follow and like
I am trying to make my analysis short and simple)

EURUSDEURUSD needs a correction, we are expecting this correction to start in this week.
Disclosure: We are part of Trade Nation's Influencer program and receive a monthly fee for using their TradingView charts in our analysis.

EURUSD Setup | CPI Fades, Fed Focus & Gold Leads Dollar ReboundEURUSD is showing signs of exhaustion after soft US CPI failed to extend the rally beyond 1.1495. While markets initially priced in a dovish Fed response, recent commentary and gold’s rejection from its highs suggest the dollar may be gearing up for a short-term recovery. With Gold pulling back and yields stabilizing, EURUSD could now follow suit lower into key support levels—especially if the Fed maintains a patient tone at this week’s meeting.
🔹 EURUSD (4H) Analysis
📉 Bias: Bearish
💡 Context:
EURUSD stalled just below 1.1500 after the CPI miss and now sits at a high-liquidity reversal zone. With DXY stabilizing and gold already rolling over, EURUSD may lag behind but eventually follow the same path. If the Fed leans hawkish or even neutral (ignoring political pressure), it could catalyze a drop toward 1.1268 and below.
📊 Technical Levels:
Resistance Zone: 1.1495–1.1530
Target 1: 1.1268
Target 2: 1.1086
Invalidation: Daily close above 1.1530 (or strong bullish follow-through after FOMC)
🪙 Leading Asset Clue:
Gold has already rejected major resistance (3,390–3,403) and is now pulling lower. Historically, EURUSD tends to follow when metals stall—especially if driven by real yields and Fed dynamics.
⚠️ Fundamentals to Watch:
🏦 FOMC Rate Decision & Dot Plot (June 12)
📈 US PPI + Jobless Claims (June 13)
💬 Fed Chair Powell's Press Conference
📰 Any shift in ECB or Fed rate cut timelines
🧠 Risk Factors:
Fed surprise dovish shift due to CPI softness
Market overreacts to rate cut expectations
Geopolitical risk-off flows favoring EUR
✅ Summary: Bias and Watchpoints
EURUSD
Bearish
Fed holding firm vs. ECB easing bias
Fed turning dovish post-CPI (Top Risk)
FOMC Rate Decision, PPI, Powell
📌 Final Note:
Gold is leading the turn as dollar strength resurfaces. EURUSD may lag initially but the macro context favors downside from this key resistance zone. Watch the Fed for confirmation—positioning into 1.1268 and 1.1086 looks attractive if the dollar gains traction post-FOMC.

EUR/USD Rally Extends – Eyes on 1.20000 as Momentum BuildsHi Everyone,
As outlined in our analysis last week (idea linked below), EUR/USD continued to the upside and reached the 1.15240 level.
We expect price action to extend further toward the 1.16564 level, which would reinforce our long-term bullish outlook.
A confirmed break above this resistance would likely open the door for a move toward 1.18325, where we anticipate encountering dynamic resistance.
We will provide further updates on the projected path for EUR/USD should price reach this level.
The longer-term outlook remains bullish, with expectations for the rally to extend toward the 1.2000 level, provided the price holds above the key support at 1.10649.
We will continue to update you throughout the week with how we’re managing our active ideas and positions. Thanks again for all the likes/boosts, comments and follows — we appreciate the support!
All the best for a good end to the week. Trade safe.
BluetonaFX

EURUSD - TIME TO SHORT Team, last time we have successfully SHORT the EURUSD and now we are back on it again
This time we have better short position
NOTE: Last few days we have been killing the UK100/FTSE100 with such great opportunity.
Please follow the PRICE target accordingly to the CHART
Target 1 1.147200 to 1.4650
Target 2 at 1.1455-1.1450
Once it reach the 1st Target take 50% profit
Good luck and enjoy the profit

Today's EUR/USD Trend Analysis and Trading RecommendationsThe EUR/USD is trading at the upper end of its recent range, having hit an intraday high of around 1.1440 and remaining near that level. The US Dollar strengthened in the early session due to optimism about the easing of Sino-US trade tensions, but later declined as European stocks fluctuated. Technically, the daily chart shows bulls remain in control, with the 20-day SMA rising gently at 1.1330. In the short term, the pair is range-bound around the 20-day SMA, yet to confirm a bullish breakout, while the 100-day and 200-day SMAs support the overall upward trend.
EUR/USD
buy@1.14200-1.14300
tp:1.14600-1.14900
