EURUSD SHORT FORECAST Q2 W18 D2 Y25EURUSD SHORT FORECAST Q2 W18 D2 Y25
Professional Risk Managers👋
Welcome back to another FRGNT chart update📈
Diving into some Forex setups using predominantly higher time frame order blocks alongside confirmation breaks of structure.
Let’s see what price action is telling us today!
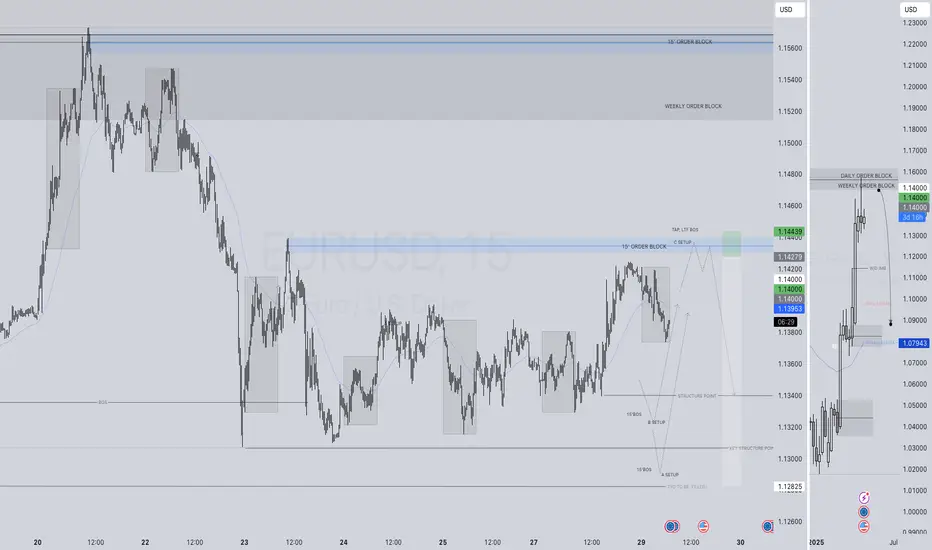
💡Here are some trade confluences📝
✅Weekly order block rejection
✅Daily order block rejection
✅Intraday 15' order blocks
✅Tokyo ranges to be filled
🔑 Remember, to participate in trading comes always with a degree of risk, therefore as professional risk managers it remains vital that we stick to our risk management plan as well as our trading strategies.
📈The rest, we leave to the balance of probabilities.
💡Fail to plan. Plan to fail.
🏆It has always been that simple.
❤️Good luck with your trading journey, I shall see you at the very top.
🎯Trade consistent, FRGNT X
Eurusdtrend

EURUSD SHORT FORECAST Q2 W18 D1 Y25EURUSD SHORT FORECAST Q2 W18 D1 Y25
Professional Risk Managers👋
Welcome back to another FRGNT chart update📈
Diving into some Forex setups using predominantly higher time frame order blocks alongside confirmation breaks of structure.
Let’s see what price action is telling us today!
💡Here are some trade confluences📝
✅Weekly order block rejection
✅Daily order block rejection
✅Intraday 15' order blocks
✅Tokyo ranges to be filled
🔑 Remember, to participate in trading comes always with a degree of risk, therefore as professional risk managers it remains vital that we stick to our risk management plan as well as our trading strategies.
📈The rest, we leave to the balance of probabilities.
💡Fail to plan. Plan to fail.
🏆It has always been that simple.
❤️Good luck with your trading journey, I shall see you at the very top.
🎯Trade consistent, FRGNT X

EURUSD m15 SellEURUSD is once again giving a sell signal. It's advisable to set the trade with a 1:1.50 Risk-Reward Ratio. You may consider closing your position at this level.
🔔 I post detailed trade ideas and daily market analysis like this every day on my TradingView profile.
👉 Follow me to get notified and read the full breakdowns.

EURUSD(20250430) Today's AnalysisMarket news:
The European Central Bank expects prices to rise 2.9% over the next 12 months, up from 2.6% in February, according to a monthly survey released on Tuesday. This is the highest level since April 2024. The three-year indicator rose slightly to 2.5%. The ECB's first five-year forecast was 2.1%.
Technical analysis:
Today's buying and selling boundaries:
1.1391
Support and resistance levels:
1.1443
1.1424
1.1411
1.1372
1.1359
1.1340
Trading strategy:
If the price breaks through 1.1391, consider buying, the first target price is 1.1411
If the price breaks through 1.1372, consider selling, the first target price is 1.1359

EURUSD SHORT FORECAST Q2 W18 D30 Y25EURUSD SHORT FORECAST Q2 W18 D30 Y25
Professional Risk Managers👋
Welcome back to another FRGNT chart update📈
Diving into some Forex setups using predominantly higher time frame order blocks alongside confirmation breaks of structure.
Let’s see what price action is telling us today!
💡Here are some trade confluences📝
✅Weekly order block rejection
✅Daily order block rejection
✅Intraday 15' order blocks
✅Tokyo ranges to be filled
🔑 Remember, to participate in trading comes always with a degree of risk, therefore as professional risk managers it remains vital that we stick to our risk management plan as well as our trading strategies.
📈The rest, we leave to the balance of probabilities.
💡Fail to plan. Plan to fail.
🏆It has always been that simple.
❤️Good luck with your trading journey, I shall see you at the very top.
🎯Trade consistent, FRGNT X

EURUSD SHORT FORECAST Q2 W18 D29 Y25
EURUSD SHORT FORECAST Q2 W18 D29 Y25
Professional Risk Managers👋
Welcome back to another FRGNT chart update📈
Diving into some Forex setups using predominantly higher time frame order blocks alongside confirmation breaks of structure.
Let’s see what price action is telling us today!
💡Here are some trade confluences📝
✅Weekly order block rejection
✅Daily order block rejection
✅Intraday 15' order block
✅Tokyo ranges to be filled
🔑 Remember, to participate in trading comes always with a degree of risk, therefore as professional risk managers it remains vital that we stick to our risk management plan as well as our trading strategies.
📈The rest, we leave to the balance of probabilities.
💡Fail to plan. Plan to fail.
🏆It has always been that simple.
❤️Good luck with your trading journey, I shall see you at the very top.
🎯Trade consistent, FRGNT X
EURUSD(20250428) Today's AnalysisMarket news:
The Fed's subsequent policy path considers two scenarios: First, there is no substantial progress in the negotiations between the United States and its trading partners. After 90 days, the US tariffs are still high. Weakened economic demand may prompt the Fed to cut interest rates starting in July, and the annual rate cut may reach 100 basis points; second, the negotiations are fruitful, tariffs are reduced, and the demand shock is small, but inflationary pressure continues. The Fed may postpone easing and only cut interest rates slightly in December. For the market, although the easing comes early in the first scenario, the "recession-style" rate cut may suppress risky assets.
Technical analysis:
Today's buying and selling boundaries:
1.1357
Support and resistance levels:
1.1434
1.1405
1.1386
1.1327
1.1308
1.1280
Trading strategy:
If the price breaks through 1.1357, consider buying, the first target price is 1.1386
If the price breaks through 1.1327, consider selling, the first target price is 1.1308

EURUSD SHORT FORECAST Q2 W18 D28 Y25EURUSD SHORT FORECAST Q2 W18 D28 Y25
Professional Risk Managers👋
Welcome back to another FRGNT chart update📈
Diving into some Forex setups using predominantly higher time frame order blocks alongside confirmation breaks of structure.
Let’s see what price action is telling us today!
💡Here are some trade confluences📝
✅Weekly order block rejection
✅Daily order block rejection
✅Intraday 15' order block
✅Tokyo ranges to be filled
🔑 Remember, to participate in trading comes always with a degree of risk, therefore as professional risk managers it remains vital that we stick to our risk management plan as well as our trading strategies.
📈The rest, we leave to the balance of probabilities.
💡Fail to plan. Plan to fail.
🏆It has always been that simple.
❤️Good luck with your trading journey, I shall see you at the very top.
🎯Trade consistent, FRGNT X

EURUSD Analysis todayHello traders, this is a complete multiple timeframe analysis of this pair. We see could find significant trading opportunities as per analysis upon price action confirmation we may take this trade. Smash the like button if you find value in this analysis and drop a comment if you have any questions or let me know which pair to cover in my next analysis.

#EURUSD: Our Last Trade Mitigated Early, Now Swing Trade Active?EURUSD, in our previous recommendation, advised everyone to sell swing trades. However, the price was mitigated by a narrow margin. The DXY index suggests further price growth in the coming weeks. Please ensure you manage your risk while trading. This is our concept only and does not guarantee the movements we’ve shown in our analysis. Therefore, please conduct your own analysis before taking any swing entry.
Good luck and trade safely.
Wishing you good luck and safe trading!
Thank you for your support! 😊
If you’d like to contribute, here are a few ways you can help us:
- Like our ideas
- Comment on our ideas
- Share our ideas
Team Setupsfx_
❤️🚀

EURUSD(20250425) Today's AnalysisMarket news:
Federal Reserve-①Hamack: If economic data is clear, the Fed may cut interest rates in June
②Waller: It will take until July to get a clearer understanding of how tariffs affect the economy. If tariffs lead to higher unemployment, interest rate cuts may be initiated. ③The Atlanta Fed GDPNow model predicts that the US GDP growth rate in the first quarter will be -2.5%. ④Kashkari: The frequent announcements from Washington have brought challenges to policymakers and everyone.
Technical analysis:
Today's buying and selling boundaries:
1.1366
Support and resistance levels:
1.1448
1.1417
1.1397
1.1335
1.1315
1.1284
Trading strategy:
If the price breaks through 1.1397, consider buying, the first target price is 1.1417
If the price breaks through 1.1366, consider selling, the first target price is 1.1335

EURUSD(20250424) Today's AnalysisMarket News:
The United States hit a 16-month low in April. The total number of new home sales in the United States in March was an annualized to a new high since September 2024.
Technical analysis:
Today's buying and selling boundaries:
1.1354
Support and resistance levels:
1.1485
1.1436
1.1404
1.1303
1.1272
1.1223
Trading strategy:
If the price breaks through 1.1354, consider buying, the first target price is 1.1404
If the price breaks through 1.1303, consider selling, the first target price is 1.1272

EUR/USD trades with sizeable gains above 1.1500, at over three-yThe Relative Strength Index (RSI) indicator on the 4-hour chart rose above 70, reflecting overbought conditions for EUR/USD. On the downside, 1.1500 (mid-point of the ascending channel) aligns as first support before 1.1450 (static level) and 1.1400 (20-period Simple Moving Average).
Looking north, first resistance could be spotted at 1.1600 (static level, round level) ahead of 1.1670 (upper limit of the ascending channel).

EURUSD: BUY trend continuesEURUSD is taking a breather, but bulls are still in charge. The 2-hour chart shows price well above key moving averages, keeping the uptrend alive. Momentum has cooled slightly, yet indicators stay near highs—no real signs of weakness. Dips toward 1.1500 are likely to draw buyers back in.

EUR/USD "The Fiber" Forex Bank Heist Plan (Swing/Day)🌟Hi! Hola! Ola! Bonjour! Hallo! Marhaba!🌟
Dear Money Makers & Robbers, 🤑 💰💸✈️
Based on 🔥Thief Trading style technical and fundamental analysis🔥, here is our master plan to heist the EUR/USD "The Fiber" Forex Market. Please adhere to the strategy I've outlined in the chart, which emphasizes long entry. Our aim is the high-risk Red Zone. Risky level, overbought market, consolidation, trend reversal, trap at the level where traders and bearish robbers are stronger. 🏆💸"Take profit and treat yourself, traders. You deserve it!💪🏆🎉
Entry 📈 : "The vault is wide open! Swipe the Bullish loot at any price - the heist is on!
however I advise to Place buy limit orders within a 15 or 30 minute timeframe most recent or swing, low or high level. I Highly recommended you to put alert in your chart.
Stop Loss 🛑:
Thief SL placed at the Nearest / Swing low level Using the 4H timeframe (1.08500) Day/Swing trade basis.
SL is based on your risk of the trade, lot size and how many multiple orders you have to take.
🏴☠️Target 🎯: 1.13000 (or) Escape Before the Target
🧲Scalpers, take note 👀 : only scalp on the Long side. If you have a lot of money, you can go straight away; if not, you can join swing traders and carry out the robbery plan. Use trailing SL to safeguard your money 💰.
EUR/USD "The Fiber" Forex Market Heist Plan (Swing / Day Trade) is currently experiencing a bullishness,., driven by several key factors.👇👇👇
📰🗞️Get & Read the Fundamental, Macro, COT Report, Quantitative Analysis, Sentimental Outlook, Intermarket Analysis, Future trend targets..., go ahead to check 👉👉👉🔗
Detailed Explanation 📝✨
Point 1: Fundamentals = tug-of-war ⚔️; U.S. strength 💪 offset by tariffs 🌧️, Eurozone weakness 🇪🇺 mitigated by ECB stability 🌟.
Point 2: Macro shows U.S. resilience cracking 😟, euro holding ground ⚖️.
Point 3: Global markets mixed 🌐, no clear winner, EUR/USD in range 🔄.
Point 4: COT cautious 📑, speculators less bullish 😐, hedgers bearish 📉.
Point 5: Intermarket neutral ⚖️; dollar-yield link key 📈, equity dips cap extremes 📉.
Point 6: 1.0950 pivot 🎯, breakout or breakdown ahead 🚀📉.
Point 7: Sentiment balanced 😊, retail buys 📈 vs. institutional caution 😐.
Point 8: Trends hinge on 1.0950 🔮; bullish needs breakout 📈, bearish risks below support 📉.
Point 9: Neutral outlook ⚖️, breakout potential either way 🌟📉.
Accurate as of April 7, 2025 ⏰, based on trends & projections. Watch U.S. CPI & Eurozone news 👀!
⚠️Trading Alert : News Releases and Position Management 📰 🗞️ 🚫🚏
As a reminder, news releases can have a significant impact on market prices and volatility. To minimize potential losses and protect your running positions,
we recommend the following:
Avoid taking new trades during news releases
Use trailing stop-loss orders to protect your running positions and lock in profits
💖Supporting our robbery plan 💥Hit the Boost Button💥 will enable us to effortlessly make and steal money 💰💵. Boost the strength of our robbery team. Every day in this market make money with ease by using the Thief Trading Style.🏆💪🤝❤️🎉🚀
I'll see you soon with another heist plan, so stay tuned 🤑🐱👤🤗🤩

EURUSDEURUSD needs more correction before going up further to take the top.
Disclosure: We are part of Trade Nation's Influencer program and receive a monthly fee for using their TradingView charts in our analysis.

#EURUSD: 1545+ PIPS Swing Sell Idea Concept! Comment Your Views!Hey there everyone! 👋
I’ve got some insights into the EURUSD currency pair. It’s been on a wild ride lately, with the USD taking a nosedive. But guess what? The EURUSD is on a bullish streak and it’s not stopping anytime soon, and it is very likely it will reach our entry point.
Now, I know what you’re thinking. “Is this a good time to jump in?” Well, let me tell you, it’s all about your risk tolerance. We’ve identified three potential entry points for the EURUSD pair, so you can decide if it’s time to make a move. 📈
Remember, trading involves risks, so it’s important to be cautious and stick to your risk management plan. 🛡️
Good luck with your trading journey 😊
Much Love❤️
Team Setupsfx_

EURUSD(20250418) Today's AnalysisMarket news:
The European Central Bank cut interest rates by 25 basis points as expected, the seventh rate cut in the past year, and this decision was unanimous.
Technical analysis:
Today's buying and selling boundaries:
1.1367
Support and resistance levels:
1.1440
1.1413
1.1395
1.1339
1.1321
1.1294
Trading strategy:
If it rises and breaks through 1.1395, consider buying, the first target price is 1.1413
If it falls and breaks through 1.1367, consider selling, the first target price is 1.1339

EURUSD SHORT FORECAST Q2 W16 D18 Y25EURUSD SHORT FORECAST Q2 W16 D18 Y25
Fun Coupon Friday.
Summary
- STILL with HTF Order block (weekly)
- All long positions invalid until weekly close above weekly order block
- Short positions charted
- The more breaks of 15' structure the more confluence for bearish pressure
- Lower time frame turn around in price action REQUIRED in all short positions.
FRGNT X

GBPUSD SHORT FORECAST Q2W W16 D17 Y25GBPUSD SHORT FORECAST Q2W W16 D17 Y25
GM GM!
- Potential 15' OB Short
- Potential 5' OB Short, lower time frame Break of structure via level
- Potential
SUMMARY
- Weekly order block rejection is the setup
- Required 15' Breaks of structure
FRGNT X

EURUSD SHORT FORECAST CONTINUED Q2 W16 D16 Y25 EURUSD SHORT FORECAST CONTINUED Q2 W16 D16 Y25
Gm Gm !
Summary
+ 5' order block short via weekly order block
+15' intraday breaks of structure
FRGNT X

The Euro Bull sharpening it's horns against the USD?After further analysis on the weekly and monthly chart, I have identified what looks like a much larger broadening bottom pattern which signals the possibility of much further U.S. Dollar weakness.
Based on my previous video analysis, my original target for the EUR/USD was 1.2000 however 1.2500 – 1.3000 is not out of the question now. We haven’t traded in that price range since 2014.
In the immediate term, we could see a bullish acceleration if we begin trading cleanly above 1.1500.
I will expand on this analysis in my next upcoming weekly video.
Good Luck & Trade Safe.

EURUSD TA: Fibonacci, Bull Flags, and Data-Driven Entry StrategyTechnical Analysis: EURUSD (Euro/US Dollar)
📈 The EURUSD pair is demonstrating strong bullish momentum on the 4-hour timeframe, with price action currently trading at 1.13638, well above the key 50% Fibonacci retracement level drawn from the previous range low to high.
🔍 The chart reveals a series of bull flags forming during the recent uptrend, suggesting continued buying pressure despite the pair trading at premium levels. This pattern typically indicates brief consolidation before further upside movement.
💹 From a Fibonacci perspective, the current price position above the 50% retracement level indicates strength in the Euro against the Dollar. However, this elevated position also creates potential for a healthy pullback to retest support before continuing higher.
⏱️ Today's upcoming US Retail Sales data release represents a significant market catalyst. Interestingly, this high-impact event could trigger a pullback regardless of the outcome:
If actual figures come in below forecast: Dollar weakness could prompt profit-taking after the recent rally
If actual figures exceed forecast: Dollar strength could naturally push EURUSD lower
🎯 Trade Idea: Monitor for a potential retracement toward the 50% Fibonacci level, followed by a bullish break of market structure on the 30-minute timeframe. This would provide a higher-probability entry point for long positions with a more favorable risk-to-reward ratio.
🔄 The presence of multiple bull flags suggests that any pullback may be temporary, potentially offering an excellent opportunity to enter with the prevailing trend at a better price point.
⚠️ DISCLAIMER: This analysis is provided solely for informational purposes and should not be construed as financial advice.
