EUR/USD Pair Hits Yearly HighEUR/USD Pair Hits Yearly High
Yesterday, the EUR/USD exchange rate rose above the 1.1700 level for the first time this year. The last time one euro was worth more than 1.70 US dollars was in autumn 2019.
The main driver behind the euro’s rise is the weakening dollar, largely due to decisions made by the Trump administration. This week alone, the EUR/USD pair has gained more than 2%, partly as a result of escalating tensions between the US President and the Chair of the Federal Reserve.
According to Reuters, Trump called Powell “terrible” and said he had three or four candidates in mind for the top job at the Fed. It was also reported that Trump had considered selecting and announcing a replacement for Powell by September or October (his current term officially runs until May 2026).
Technical Analysis of the EUR/USD Chart
Price movements are forming an upward channel (highlighted in blue), with the following observations:
→ Midweek, the price consolidated around the channel’s median line (as indicated by arrow 1);
→ It then broke through the 1.6300 level with strong bullish momentum (shown by arrow 2), a level that had acted as resistance earlier in the month;
→ The long upper wicks on the candles forming yesterday’s highs (circled) suggest increased selling pressure near the upper boundary of the channel.
Given this, we could assume that in the short term, the price might form a new consolidation zone around the median line above the 1.6300 level. Significant fundamental catalysts would be required to break the developing upward trend.
This article represents the opinion of the Companies operating under the FXOpen brand only. It is not to be construed as an offer, solicitation, or recommendation with respect to products and services provided by the Companies operating under the FXOpen brand, nor is it to be considered financial advice.
Eurusdtrendanalysis

Overextended Rally into Resistance ZoneEUR/USD has pushed into the upper boundary of the Keltner Channel on the 4H timeframe, indicating a potential exhaustion of bullish momentum. Price is showing signs of overextension with Heikin Ashi candles losing strength near a key resistance zone.
📉 Short Position Setup:
Entry: 1.17220 (near upper Keltner resistance)
SL: 1.17581 (above recent highs and volatility buffer)
TP: 1.15220 (targeting mid-channel and previous structure support)
🔻 Bearish Confluence:
Price rejecting upper Keltner band
Potential for mean reversion after strong rally
Weakening bullish momentum in candle structure
Confirmation with further bearish price action or divergence signals would strengthen the case for downside continuation.

Can the EUR/USD break out of its range-bound trading?The EUR/USD has advanced for the third consecutive trading day, rebounding above the key 1.1500 level and trading around 1.1530 during the European session. US President Trump's statement that it would take two weeks to decide whether to intervene in the Middle East conflict effectively alleviated market concerns over conflict escalation, providing support for the euro. Analysts believe that the exchange rate is likely to remain range-bound between 1.1400 and 1.1600 over the next 1-2 weeks. Any new developments in geopolitical tensions could significantly impact the exchange rate. If positive progress is made in the Iran nuclear talks, the exchange rate is expected to challenge the upper boundary of the range; conversely, if the Middle East situation deteriorates further, the exchange rate may retest the 1.14 support level.
you are currently struggling with losses,or are unsure which of the numerous trading strategies to follow,You have the option to join our VIP program. I will assist you and provide you with accurate trading signals, enabling you to navigate the financial markets with greater confidence and potentially achieve optimal trading results.
Trading Strategy:
buy@1.4500-1.4700
TP:1.5300-1.5500

EUR/USD 1-Hour Chart Analysis1-hour candlestick chart for the Euro/US Dollar (EUR/USD) currency pair, sourced from OANDA. The chart highlights a recent price movement with a current value of 1.15510, reflecting a 0.29% decrease (-0.00340). Key price levels are marked, including resistance at 1.16142 and support at 1.14418, with shaded areas indicating potential trading zones. The chart includes a bullish logo and branding from "ALEEGOLDTRADER," suggesting a trading analysis perspective.

EUR/USD - Upside Bias Continues Amid Market EventsHi Everyone,
As outlined in our analysis last week, we continue to expect EUR/USD to advance further to the upside. A successful retest of the 1.15240 level provides support for the move.
This promises to be an eventful week as markets navigate geopolitical tensions and upcoming central bank decisions. As long as price holds above 1.14483, we anticipate a continuation higher toward the 1.16564 level, which would further reinforce our long-term bullish outlook.
A confirmed break above this resistance would likely open the door for a move toward 1.18325, where we anticipate encountering dynamic resistance.
We will provide further updates on the projected path for EUR/USD should price reach this level.
The longer-term outlook remains bullish, with expectations for the rally to extend toward the 1.2000 level, provided the price holds above the key support at 1.10649.
We will continue to update you throughout the week with how we’re managing our active ideas and positions. Thanks again for all the likes/boosts, comments and follows — we appreciate the support!
All the best for a good end to the week. Trade safe.
BluetonaFX

EUR/USD Breakout Retest StrategyEUR/USD Breakout Retest Strategy 🟢📈
📊 Technical Analysis Summary:
The chart illustrates a bullish breakout from a consolidation range with a well-defined support near 1.12500 and resistance between 1.16500–1.17000.
🔍 Key Observations:
🔸 Triple Rejection Zone:
Price faced rejection 3 times (highlighted with orange circles) near the same level before the breakout — classic liquidity sweep above resistance.
🔸 Strong Support Bounce:
Each time price reached the green support zone, it showed strong bullish reaction (green arrows) signaling solid buying interest.
🔸 Break and Retest Formation:
Price broke the previous highs and now seems to be retesting the breakout zone (around 1.15250–1.15300). A successful retest could confirm bullish continuation.
🔸 Projected Bullish Move:
If the retest holds, we may see price pushing up toward the 1.17000 resistance zone as marked.
📌 Trading Plan:
✅ Bullish Bias above 1.15250
✅ Look for bullish candlestick confirmation or breakout structure
🚫 Avoid trades if price drops below 1.15000 with momentum
📈 Target Zone: 1.16500 – 1.17000
🛑 Stop Loss suggestion: Below 1.14750
🧠 Keep patience during the retest — smart money often tests emotions before real moves! 💰📉📈

USD Weakness Persists: Can EUR/USD Target 1.18?
The EUR/USD exchange rate has continued to strengthen, breaking through the psychological barrier of 1.1600 during the intraday session, marking the first time it has reached this level since November 2021. The pair surged to an intraday high of 1.1630, driven by the confluence of a persistently weakening US dollar and enhanced economic resilience in the Eurozone.
Technically, the EUR/USD currently exhibits a robust bullish pattern. If it can sustain above the 1.1600 threshold, it is poised to test the 1.1800 resistance zone. Conversely, a false breakout followed by a retracement below 1.1500 would warrant caution, as it may signal a attenuation of bullish momentum and potential reversal risks.
Humans need to breathe, and perfect trading is like breathing—maintaining flexibility without needing to trade every market swing. The secret to profitable trading lies in implementing simple rules: repeating simple tasks consistently and enforcing them strictly over the long term.

Can EUR/USD Break Through the Range Constraint?The EUR/USD exchange rate continues to maintain a range-bound consolidation trend, currently trading around 1.1400. The dovish statements from European Central Bank (ECB) policymakers are offset by the positive economic signals in the Eurozone, leading to a wait-and-see sentiment in the market. In the short term, the EUR/USD exchange rate is expected to remain in a narrow range consolidation pattern. Technically, the exchange rate needs to break through the recent high to sustain the upward momentum; otherwise, it may return to the broader range of 1.12-1.15.
Humans need to breathe, and perfect trading is like breathing—maintaining flexibility without needing to trade every market swing. The secret to profitable trading lies in implementing simple rules: repeating simple tasks consistently and enforcing them strictly over the long term.

The euro is in high - level oscillation.The euro has rebounded slightly against the US dollar, trading around 1.143 during the European session, recovering some of the losses from last week's decline from around 1.1500. Fundamentally, the US dollar weakened after taking profits from the strong non - farm payrolls data last Friday, while the hawkish remarks by European Central Bank Governing Council member Kazimir provided support for the euro. From the perspective of market structure, the short - term market sentiment is slightly bullish. The key resistance levels are concentrated in the 1.1494 - 1.1500 area. If this platform is broken through and held, it may form a new bullish breakout point.
Humans need to breathe, and perfect trading is like breathing—maintaining flexibility without needing to trade every market swing. The secret to profitable trading lies in implementing simple rules: repeating simple tasks consistently and enforcing them strictly over the long term.

Economic data in the eurozone was mixed.The EUR/USD trended higher in a volatile fashion this week, gaining 0.41% on a weekly basis. It briefly reached a six-week high of 1.1495 on Thursday but retreated to 1.1395 on Friday due to a stronger US dollar. Nevertheless, the euro showed overall robust performance during the week. Analysts were not surprised by the European Central Bank's (ECB) rate cut, but they remained cautious about the impact of Trump's tariff policies on the global economy. Although the ECB believes trade tensions have eased, analysts argue that the eurozone has not fully escaped risks. If future economic data continues to be weak, the euro may face downward pressure.
Humans need to breathe, and perfect trading is like breathing—maintaining flexibility without needing to trade every market swing. The secret to profitable trading lies in implementing simple rules: repeating simple tasks consistently and enforcing them strictly over the long term.

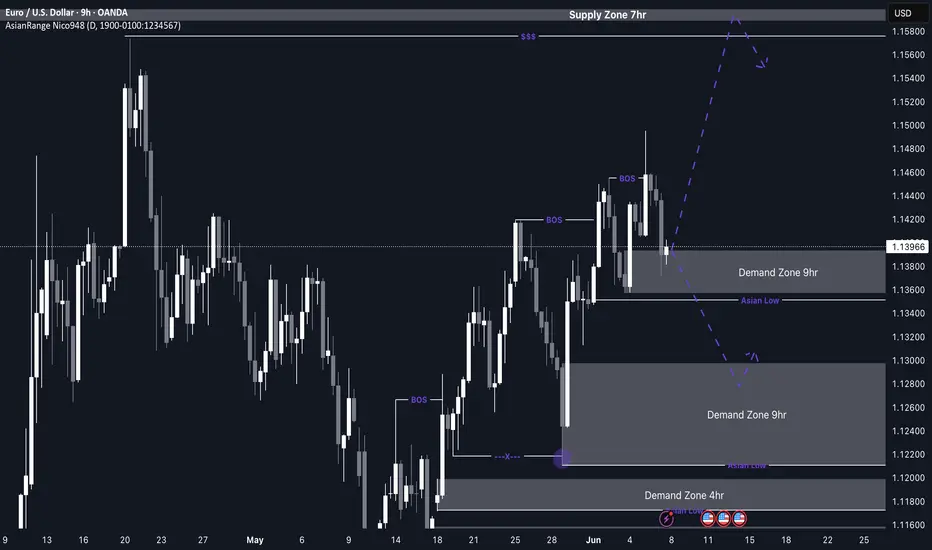
EUR/USD Potential buys from current zone or 1.12800My outlook for EU this week closely aligns with GU — both pairs are showing similar structure and direction. Price continues to form higher highs and higher lows, maintaining its bullish momentum.
Following the most recent break of structure to the upside, EU has now entered a 9H demand zone, where I’ll be watching for signs of accumulation and potential entry as the market opens on Monday.
If this current zone fails to hold, there’s a more discounted 9H demand zone just below, which could offer a cleaner long opportunity. Either way, both scenarios follow the pro trend, which adds conviction to the buy idea.
Confluences for EU Buys:
Price has broken structure to the upside and entered a clean 9H demand zone
There’s another refined 9H demand zone just below for additional confirmation
Plenty of upside liquidity remains untouched
Structure remains bullish on the higher timeframes, making this a pro trend setup
P.S. If price reacts well and continues pushing higher, I’ll be keeping an eye on the 7H supply zone above for any possible short-term bearish reaction.
Wishing everyone a successful and disciplined trading week ahead!
EURUSD - Look for Short (SWING) 1:2.5!Price has formed an ascending channel on the higher time frame, currently consolidating before potentially entering a distribution phase. A breakout could occur in either direction, but if the chart pattern plays out as expected, we may see a break below the key support level. Let’s aim for at least TP1.
Disclaimer:
This is simply my personal technical analysis, and you're free to consider it as a reference or disregard it. No obligation! Emphasizing the importance of proper risk management—it can make a significant difference. Wishing you a successful and happy trading experience!

ECB Cuts Rates. EUR/USD Spikes to 1.5-Month HighECB Cuts Rates. EUR/USD Spikes to 1.5-Month High
Yesterday, as widely expected, the European Central Bank (ECB) cut interest rates for the eighth time since May 2024. According to ForexFactory, the main refinancing rate was lowered from 2.40% to 2.15% (having stood at 4.50% in May 2024).
According to Reuters:
→ ECB President Christine Lagarde stated that interest rates are now at a “good level”, despite the extremely high uncertainty caused by tariff threats from President Donald Trump.
→ Following the press conference, markets interpreted the message as a sign that the ECB is unlikely to cut rates again at its next meeting in July.
In response to the ECB's decision, the EUR/USD rate jumped to its highest level in a month and a half, but later retreated (as indicated by the arrow) back to previous levels.
Technical Analysis of the EUR/USD Chart
Four days ago, while analysing the EUR/USD chart, we:
→ drew an ascending channel;
→ suggested that bullish momentum could push the EUR/USD rate up to the psychological level of 1.1500 during the current week.
In fact, at yesterday’s peak, the rate came very close to 1.1500. However, a candlestick with a long upper shadow had formed on the EUR/USD chart, by the end of the day. Additionally, this morning, the 1.1450 level has acted as a resistance zone.
This suggests bearish activity, which could pull the rate down towards the lower boundary of the local channel (outlined in black), and possibly even attempt a breakout below it.
This article represents the opinion of the Companies operating under the FXOpen brand only. It is not to be construed as an offer, solicitation, or recommendation with respect to products and services provided by the Companies operating under the FXOpen brand, nor is it to be considered financial advice.

Can it stabilize above 1.14?The euro against the US dollar traded in a narrow range during the North American session, with the current exchange rate consolidating near the 1.14 level as the market awaits the European Central Bank's (ECB) interest rate decision this Thursday.
In the US, the ADP employment data far missed expectations, with private sector employment increasing by only 37,000 in May—significantly below the market forecast of 115,000. This weak data triggered a decline in the US dollar, pushing the EUR/USD exchange rate to rebound to the 1.1400 zone. While the exchange rate is expected to continue its rebound momentum, its upside potential remains limited. If the key resistance level of 1.1418 is effectively broken, it could open the door for further upward movement to the 1.1450-1.1480 range.
Humans need to breathe, and perfect trading is like breathing—maintaining flexibility without needing to trade every market swing. The secret to profitable trading lies in implementing simple rules: repeating simple tasks consistently and enforcing them strictly over the long term.

Market Analysis: EUR/USD Trims GainsMarket Analysis: EUR/USD Trims Gains
EUR/USD started a downside correction from the 1.1450 resistance.
Important Takeaways for EUR/USD Analysis Today
- The Euro struggled to clear the 1.1450 resistance and declined against the US Dollar.
- There was a break below a key bullish trend line with support at 1.1395 on the hourly chart of EUR/USD at FXOpen.
EUR/USD Technical Analysis
On the hourly chart of EUR/USD at FXOpen, the pair gained pace for a move above the 1.1300 zone, as mentioned in the previous analysis. The Euro tested the 1.1450 resistance and recently corrected gains against the US Dollar.
The pair dipped below 1.1400. There was a break below a key bullish trend line with support at 1.1395. It even traded below the 23.6% Fib retracement level of the upward move from the 1.1209 swing low to the 1.1454 high.
The pair is showing some bearish signs, and upside potential might remain limited. Immediate resistance is near the 50-hour simple moving average at 1.1395.
The next major resistance is near the 1.1450 zone. An upside break above the 1.1450 level might send the pair toward the 1.1500 resistance. Any more gains might open the doors for a move toward the 1.1550 level.
On the downside, immediate support on the EUR/USD chart is seen near the 50% Fib retracement level of the upward move from the 1.1209 swing low to the 1.1454 high at 1.1330. The next major support is near the 1.1300 level. A downside break below the 1.1300 support could send the pair toward the 1.1210 level.
This article represents the opinion of the Companies operating under the FXOpen brand only. It is not to be construed as an offer, solicitation, or recommendation with respect to products and services provided by the Companies operating under the FXOpen brand, nor is it to be considered financial advice.

Elliott Wave Insight Into EUR/USD’s Recent MovesThe EUR/USD chart has delivered a clean Elliott Wave sequence, which helps us forecast what may come next.
Wave Count Overview
The structure leading up to the high shows a clear five-wave impulsive rally, ending at Wave 3 in yellow.
This was followed by a corrective A-B-C zigzag, with:
A sharp Wave A down
A shallow Wave B bounce
A clean Wave C drop, matching Wave A in length, bottoming at the 100% Fibonacci projection around 1.10711.
Why This Matters
Elliott Wave theory tells us that a completed zigzag correction—especially when followed by a consolidation like a triangle—often leads to a continuation in the direction of the larger trend. If this consolidation is indeed a Wave 4 triangle, Wave 5 may soon emerge with strength.
What to Watch For:
Breakout from the current flag/triangle pattern.
Confirmation via price closing above the Wave B high.
Strong bullish momentum and rising volume as signs Wave 5 is kicking off.
Conclusion
EUR/USD may be gearing up for a Wave 5 breakout, following a classic zigzag correction and potential triangle consolidation. If this pattern breaks to the upside, it could offer a great trend continuation trade opportunity.

Has EUR/USD entered a medium-term correction?The EUR/USD has experienced a corrective pullback in a range-bound manner, touching the 1.14 level during the European session, approaching the Bollinger Band Midline support at 1.129. Earlier, the exchange rate retreated after encountering resistance near the 1.1450 key resistance level. Influenced by Euro-U.S. economic data divergences, the broader European market weakened, exerting downward pressure on the euro. Ahead of this week's ECB monetary policy meeting, the pair is likely to remain range-bound between the 1.1350 support and 1.1500 resistance levels.
If the ECB signals further monetary easing, the exchange rate may decline to test the 1.1350 support zone, with a potential extension of the downward move targeting the Bollinger Band Midline at 1.1292. Conversely, if the market deems the rate-cut expectations to be fully priced in and the ECB delivers a neutral policy stance, this could prompt the EUR/USD to retest the 1.1500 resistance level.
Humans need to breathe, and perfect trading is like breathing—maintaining flexibility without needing to trade every market swing. The secret to profitable trading lies in implementing simple rules: repeating simple tasks consistently and enforcing them strictly over the long term.
Trading Strategy:
buy@1.13500-1.13600
TP:1.13800-1.13900

EURUSD - OPPORTUNITY HAS ARRIVEDTeam,
I hardly trade EURUSD but the last time, we went long EURUSD when it was 1.03-1.04 - properly 2 months ago.
Now we decide to short, please follow the strategy given out in the chart.
Today, we have successfully hit target on SHORTING GOLD, you can check it yourself yesterday post. We do LIVE trading SHORT UK hit both target, Yesterday we went LONG USDCHF- you can check my post, target hit today as well.
and 15 minutes ago, we do LIVE trading and our soft target for EURUSD hit again.\
Now, we are reshort the EURUSD, please make sure follow the chart accordingly.
Once it hits the 1st target, bring stop loss to BE.
REMEMBER always care about how much you are taking the risk on each of your trade.

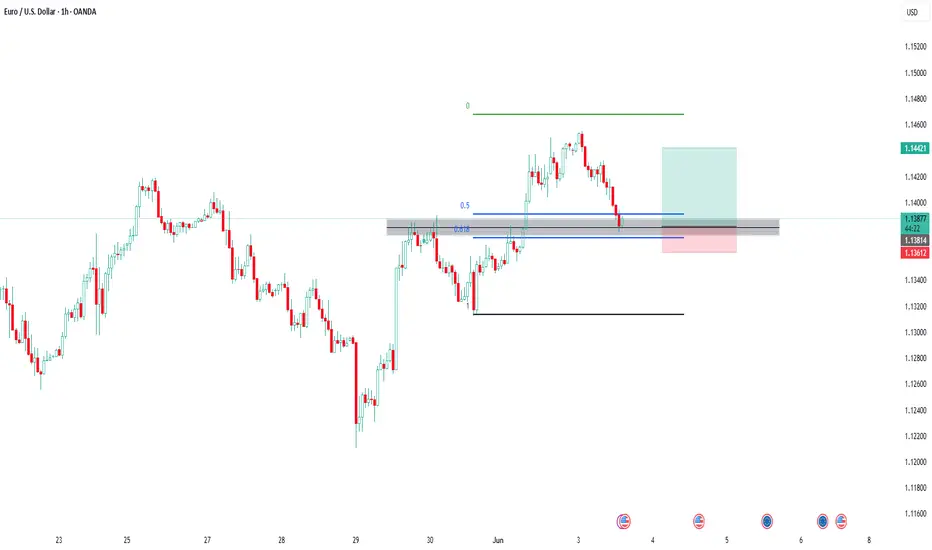
EUR USD Trade Setup 1 hour timeframe EUR USD Trade Setup 1 hour timeframe
EUR USD has formed a Bullish Break and Retest pattern on the 1 hour timeframe and the price is currently at the retest level.
EURUSD on 3rd May 2025By looking at EURUSD in 4h timeframe, it is trading on very strong zone as it became support now due to yesterday breakout. Also there is uptrend trendline which is acting as strong support, if it breaks our next target will be down to 1.12490 and 1.12930. if this support holds then price may surge in upward direction. Need to wait till breakout in downward.
Key point.
Support - 1.14190, 1.13600, 1.13152
Resistance - 1.14906, 1.15440
If you like it do follow and share.
Any Query Reach Us or comment down.
Follow for more updates.
Rudra Vasaikar Wishes You A Great And Very Amazing Trading Life. Trade Safe, Trade Right.
RISK WARNING 🔴 🔴 🔴
There is high risk of loss in Trading Forex, Crypto, Indices, CFDs, Features and Stocks. Choose your trade wisely and confidently, please see if such trading is appropriate for you or not. Past performance is not indicative of future results. Highly recommended - Information provided by Pro Trading Point are for Educational purpose only. Do your investment according to your own risk. Any type of loss is not our responsibility.
HAPPY TRADING.

EUR/USD Eyes More Upside PotentialDuring the European session, the price showed a trend of first fluctuating and then rising sharply. Currently, the price is at 1.1433, higher than the intraday moving average of 1.1380, indicating that the bulls are in the dominant position. According to ING (International Netherlands Group), the EUR/USD has some intraday resistance at 1.1425, and above this level, it is expected to rise to 1.1500 in the short term. The euro has formed a bottom above 1.1200 and started a new round of upward movement against the US dollar. The EUR/USD has broken through the resistance level of 1.1280, with a bullish trend. The first major resistance level is at 1.1450. If the closing price is above the 1.1450 level, it may lay the foundation for another wave of upward movement. In this case, the currency pair may even break through the resistance level of 1.1500. The next major target for the bulls may be near the resistance level of 1.1580.
Humans need to breathe, and perfect trading is like breathing—maintaining flexibility without needing to trade every market swing. The secret to profitable trading lies in implementing simple rules: repeating simple tasks consistently and enforcing them strictly over the long term.
Trading Strategy:
buy@1.1300-1.1350
TP:1.1450-1.1500

EUR/USD Rises to 4-Week HighEUR/USD Rises to 4-Week High
As shown on the EUR/USD chart today, the euro rose to a 4-week high against the US dollar this morning.
The euro's strength relative to the US dollar is supported by traders’ expectations ahead of the ECB's interest rate decision, scheduled for Thursday at 15:15 GMT+3.
This upcoming event is notable not only because the ECB is expected to cut rates from 2.40% to 2.15% (for the seventh consecutive time), but also due to the broader context shaped by ECB President Christine Lagarde’s recent remarks on the euro’s status as a reserve currency.
At the same time, the US dollar is weakening amid growing trade concerns—on Friday, the US President Donald Trump announced plans to double tariffs on steel and aluminum to 50%. He also accused China of breaching the recent trade truce.
Technical Analysis of the EUR/USD Chart
Seven days ago, when analysing the EUR/USD chart, we:
→ observed bullish sentiment;
→ highlighted the importance of the 1.1400 resistance level;
→ suggested that bears might attempt to strike back.
Since then, the price has pulled back from the mentioned level (as indicated by the arrow), but found support at the lower boundary of the ascending channel. The current bullish momentum could push EUR/USD towards the psychological level of 1.1500 during the week ahead.
This article represents the opinion of the Companies operating under the FXOpen brand only. It is not to be construed as an offer, solicitation, or recommendation with respect to products and services provided by the Companies operating under the FXOpen brand, nor is it to be considered financial advice.

The range of 1.12-1.14 becomes an "arena"!The EUR/USD exhibited a narrow trading range on the last trading day of this week, with market focus in the evening centered on the upcoming release of the U.S. April core Personal Consumption Expenditures (PCE) price index data, one of the Federal Reserve's most closely watched inflation indicators. Recently, the U.S. dollar has remained strong amid the Fed's hawkish stance and risk aversion triggered by tariff rhetoric, while the euro has shown some resilience but lacks a clear direction amid a mix of fundamental and technical factors.
Looking ahead, the trajectory of EUR/USD will largely depend on the upcoming U.S. core PCE data and market repricing of Fed policy. If the PCE data meets expectations (month-on-month 0.1%, year-on-year 2.5%), the euro is likely to continue oscillating within the range of 1.1270 to 1.1435, with limited short-term potential to break above the upper Bollinger Band at 1.1435. If the data surprises on the upside, the U.S. dollar could strengthen further, and the euro may test support levels at 1.1200 or even 1.1108. Conversely, if the data is weak, market expectations for a July rate cut by the Fed may intensify, and the euro could challenge resistance at 1.1400 and higher levels.
Humans need to breathe, and perfect trading is like breathing—maintaining flexibility without needing to trade every market swing. The secret to profitable trading lies in implementing simple rules: repeating simple tasks consistently and enforcing them strictly over the long term.
