Cup & HANDLE + Mini Double Bottom: $TSLA to $610 ScenarioI maintain a bullish stance on Tesla ( NASDAQ:TSLA ), supported by a compelling combination of technical patterns and strong fundamental drivers. The current chart setup reveals a Cup and Handle formation complemented by a Mini Double Bottom, both of which are classic bullish continuation patterns. These suggest a potential breakout scenario that could drive NASDAQ:TSLA to $610 by year-end.
Technical Roadmap:
Gap Fill to $408: Anticipated earnings momentum, particularly from the Robotaxi segment, is likely to propel the stock to fill the previous gap at $408.
Consolidation at $450: Following the gap fill, I expect a consolidation phase forming a “box” around the $450 level.
Breakout to $610: A decisive breakout above $450 could trigger a strong rally toward the $610 target.
***Current Key Catalysts Supporting the Bullish Thesis:
Robotaxi Expansion: Tesla’s autonomous driving initiative is gaining traction, with Robotaxi developments expected to significantly boost revenue and margins.
India Market Entry: Tesla’s upcoming launch in India opens access to one of the world’s largest and fastest-growing EV markets.
In-House Chip Development & Dojo 2 Expansion: Continued investment in AI infrastructure and custom silicon enhances Tesla’s competitive edge in autonomy and robotics.
Tesla Diner Launch: The near-completion of Tesla’s themed diner adds to brand visibility and customer engagement.
Global EV Adoption: Tesla continues to benefit from rising EV demand across multiple international markets.
Optimus Robot Hype: Growing interest in Tesla’s humanoid robot project could unlock new revenue streams and investor enthusiasm.
Favorable Macro Trends: A declining interest rate environment supports higher valuations for growth stocks like Tesla.
Institutional Accumulation: Recent trading activity suggests that institutional investors are accumulating shares within the current range.
Grok AI Integration: The integration of Grok AI into Tesla vehicles could enhance user experience and differentiate Tesla’s infotainment ecosystem.
Investment Strategy:
I recommend initiating or increasing exposure to NASDAQ:TSLL (leveraged Tesla ETF) ahead of the upcoming earnings report. This could offer amplified returns if the bullish scenario plays out. Consider accumulating further on any dips, particularly during the consolidation phase around $450.
BUY NOW NASDAQ:TSLA NASDAQ:TSLL
EV

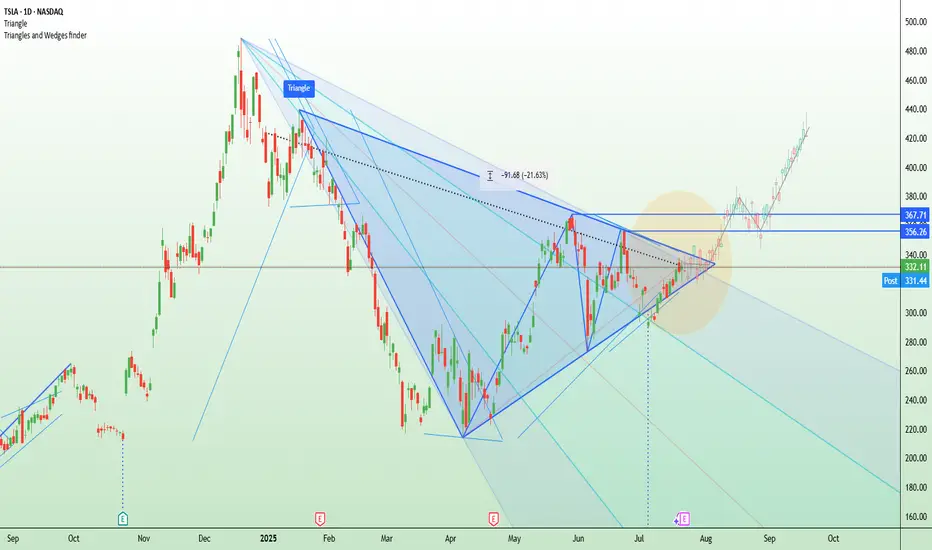
TSLA squeezes into resistance ahead of earnings Tesla is set to report Q2 earnings after the closing bell on Wednesday, covering the quarter ending June 2025.
The stock has been highly volatile this year, amid concerns about tariffs, Elon Musk’s politics (and nazi salutes), and his public clashes with President Donald Trump.
Tesla bulls Wedbush think, “We are at a 'positive crossroads' in the Tesla story,” suggesting that investors will look past the current numbers and focus on Tesla’s long-term AI potential.
Technically, Tesla is now testing a major descending trendline that’s capped every rally since December. The current price action resembles an ascending triangle pattern — a bullish structure — with resistance around $356 and a series of higher lows from May through July. This tightening formation suggests building pressure ahead of the earnings release.
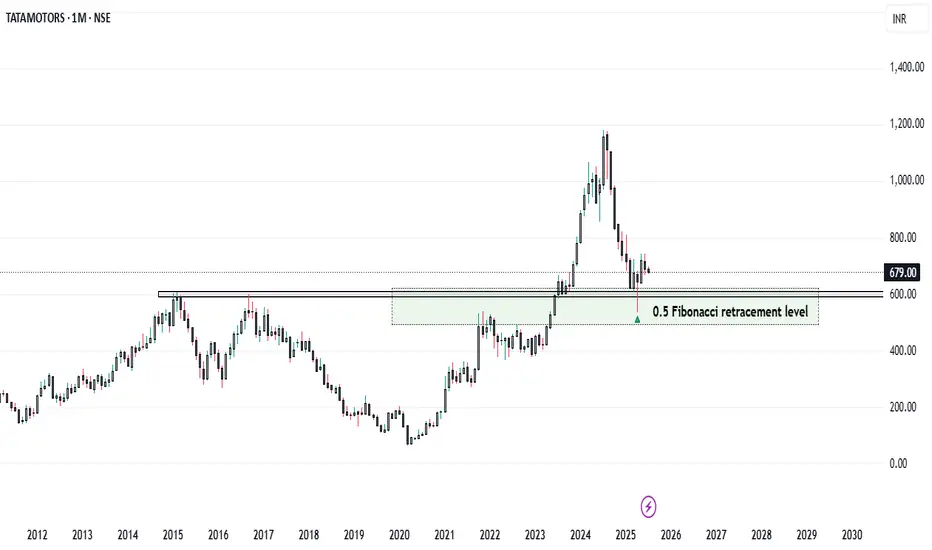
Tata Motors: From Profit Pressure to Growth Potential... Company Overview
* Name: Tata Motors Ltd.
* Industry: Automotive
* Key Segments: Passenger Vehicles (PV), Commercial Vehicles (CV), Electric Vehicles (EV), Jaguar Land Rover (JLR)
* FY25 Milestone: The Automotive business became debt-free
Q4 FY25 Performance Overview
* Net Profit: ₹8,556 crore (Down 51% YoY)
* Reason for Decline:
* High base due to deferred tax benefit in Q4 FY24
* Lower domestic volumes in PV and CV segments
* Reduced operating leverage amid falling demand
* Revenue: Marginal YoY increase (Consolidated revenue at record level for FY25)
* Positive Developments Despite Profit Decline :
* JLR Profitability Improvement
* Profit rose despite slightly lower revenue
* Supported by higher volumes and reduced depreciation
* Debt-Free Automotive Division:
* Major financial milestone for FY25 :
* Record Annual Revenue:
* Highest consolidated revenue in Tata Motors' history
* Future-Focused Investments:
* Capital allocation towards EVs, new product development, and manufacturing capacity
Strategic Growth Drivers – Reasons for Optimism
1. Electric Vehicle (EV) Leadership
* Tata Motors holds a dominant position in India’s EV market
* Plans to launch 10 EV models by 2026
* Battery Gigafactory is expected to begin production in 2026
* Strong alignment with India’s clean mobility goals
2. Expanding Product Portfolio
* Focused on SUV and ₹10–20 lakh price segments
* Upcoming launches:
* Curvv EV
* Harrier EV
* Sierra EV
* Strategy to cater to diverse customer preferences
3. Improving Financial Health
* Targeting 10% EBITDA across PV and EV divisions
* Demerger of CV and PV businesses to streamline operations and unlock value
4. Strong Base in Commercial Vehicles
* Market leader with 37.83% share in EV segment
* CV recovery is expected with infrastructure and rural demand growth
5. Supportive Macroeconomic and Policy Environment
* Government incentives: FAME II, PLI scheme
* EV-friendly policies encouraging domestic manufacturing
* Economic tailwinds: rising disposable income, urbanization, rural penetration
Risks and Challenges Ahead
* Intensifying Competition:
* Pressure from Maruti Suzuki, Hyundai, and new players
* Global Geopolitical and Trade Risks:
* US tariffs, material shortages (e.g., rare earths for EVs)
* Domestic Demand Slowdown:
* Inflation and high interest rates are affecting affordability
* Jaguar Land Rover’s Transition Challenges:
* EV transformation complexity
* Global demand volatility
* Production ramp-up hurdles
Conclusion
Tata Motors is at a pivotal juncture. While short-term profitability has taken a hit due to exceptional prior-year gains and cyclical volume pressures, the company’s fundamentals remain strong. Its leadership in EVs, ambitious expansion plans, and a now debt-free automotive business position it for long-term success.
However, realizing this potential depends on:
* Execution of its EV roadmap
* Sustained domestic demand
* Managing global uncertainties
* Staying competitive in an evolving auto landscape
Strategic Verdict:
Short-term caution, long-term confidence.
Tata Motors appears well-poised for a resilient comeback, driven by structural transformation and market-aligned growth strategies.
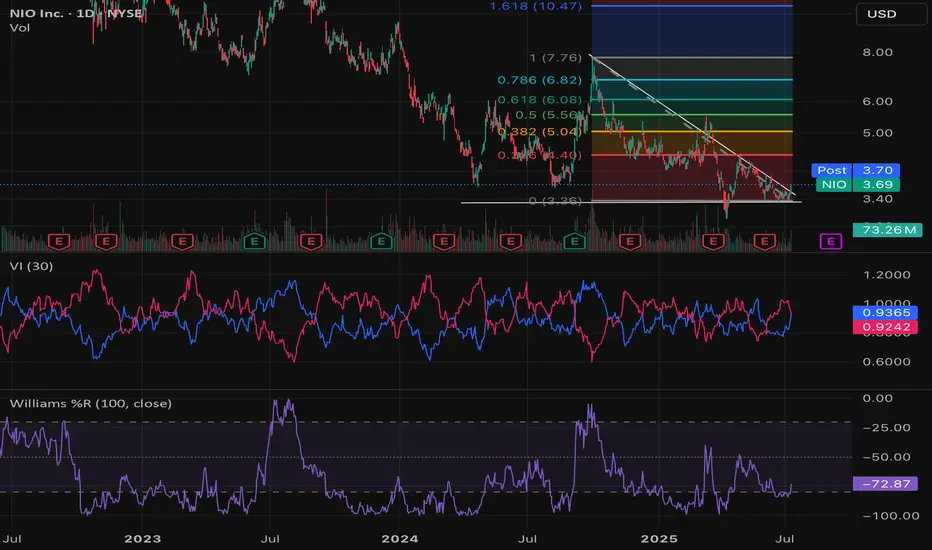
$NIO Breakout play- NYSE:NIO breakout play.
- I have marked the potential levels.
- NYSE:NIO moon time!
Tesla (TSLA) Market UpdateTesla NASDAQ:TSLA shares dropped nearly 7% after Elon Musk dismissed analyst Dan Ives' suggestion to scale back his political activities. Musk also proposed a new pay package, raising concerns among investors about potential distractions from Tesla’s core business.
📊 Upcoming Catalyst:
Tesla is set to report its Q2 earnings on July 23, with investors eagerly awaiting updates on the company’s financial performance and the newly launched robo-taxi service in Austin, Texas.
⚠️ Sentiment:
Recent bearish headlines include:
Concerns over potential Robotaxi issues
The ongoing Trump/Elon Musk political drama
📈 Trading Opportunity (Long Setup):
Despite the negative sentiment, this dip could offer a solid long entry opportunity:
Entry Zone: $275–$270
Take Profit Targets:
TP1: $315
TP2: $335
Stop Loss: Close below $265

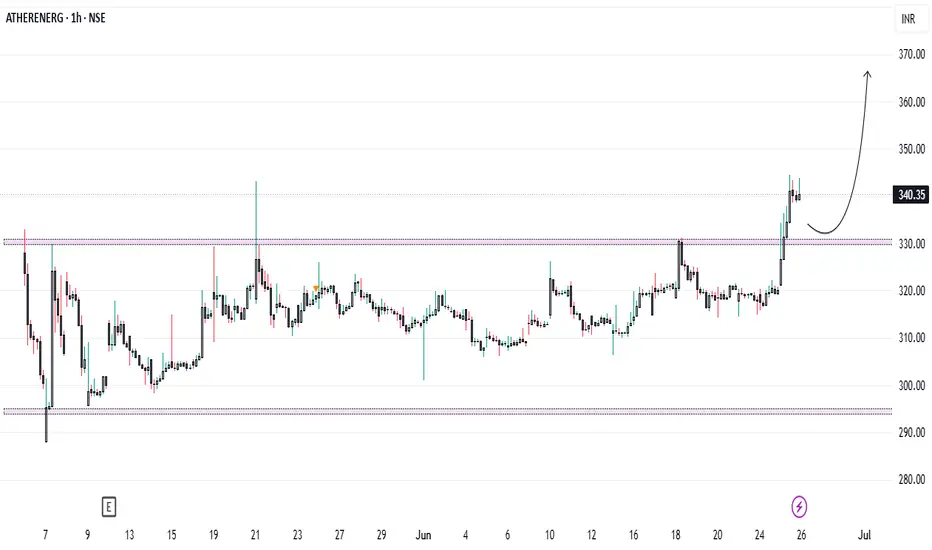
Ather’s Affordable EV Announcement Triggers Market Rally...Technical Analysis:
Ather Energy has successfully broken above the key resistance level of ₹330 and is currently trading around ₹340. This breakout is supported by a noticeable surge in volume, confirming bullish momentum. The ₹330 level, which previously acted as a strong resistance, may now serve as a potential support in the event of a retest. Traders and investors can look for buying opportunities on dips near ₹330, while those already holding the stock are advised to continue holding for further upside.
Fundamental Analysis:
From a fundamental standpoint, Ather’s maiden quarterly results have been encouraging. The company reported a one-third increase in revenue, while its EBITDA loss narrowed to ₹172 crore, down from ₹239 crore in the same quarter last year. This marks a significant step towards operational efficiency and profitability.
Adding to the positive sentiment, Ather recently announced that it will unveil its new EL EV platform and upcoming concept models in August 2025. The highlight of this announcement is that the new scooter will be Ather’s most affordable offering, signaling a strategic push to expand market penetration and compete in the mass segment of the EV market.
Conclusion:
The breakout at ₹330, supported by improving financial performance and strong product pipeline news, suggests a bullish outlook for Ather Energy in the near term. Investors should monitor the ₹330 level for price retest and accumulation opportunities. Holding is recommended for existing investors, while fresh entries can be considered on technical confirmation around support zones.
Note: Due to ongoing global uncertainties, market conditions may remain volatile. Investors are advised to exercise caution and manage risk accordingly.
Rivian Kicking Off Potential UptrendHey, all. I'll get down to it. Obviously NASDAQ:RIVN has been an incredibly tough stock to own. Fake out after fake out. It has been brutal - unless you have been nimble enough to buy the dips and sell the rips.
I would like to posit, however, that NASDAQ:RIVN is going to start marching back higher here over time. In the signal system I have been taught via the T@M strategy, Rivian is putting in a range expansion to the upside on the weekly time frame. If you take the range of the past monthly consolidation period, attach it to the "mode" (or central zone of the consolidation range), it gives you a target of $25 over the next few months. Now, whether this is another fake out just to reverse on us... again... remains to be seen of course. It is early in the idea. But potentially offers a decent risk/reward position here.
I just do not see Rivian really going away at all and, if they can keep refining their business, they could see some success going forward. Anyway, hope you enjoy this idea! As always, position carefully as the market is risky business.
Including the Daily Chart below for your reference as well.

CATL’s HK Debut IGNITES EV Revolution Tesla’s Secret Weapon?🔥 CATL’s HK Debut IGNITES EV Revolution Tesla’s Secret Weapon?
BOOM! Chinese battery king CATL ($CATL.HK) just skyrocketed in its Hong Kong debut, defying Pentagon blacklists. Powering Tesla, VW, and Mercedes, it’s the EV supply chain’s 800-lb gorilla. Funds are pouring in for global domination miss this, and you’re sidelined!
⚡️ Pro Tip: EV stocks are heating up, but US-China tensions could crash the party. Watch NYSE:NIO , NASDAQ:LI too!
🚀 Share this if you’re bullish on EVs! What’s your top EV pick?

Tesla (TSLA) – From EV Giant to Tech & Energy Ecosystem Titan Update Summary:
Tesla NASDAQ:TSLA continues its transformation beyond vehicles, building a vertically integrated platform across mobility, energy, AI, and infrastructure. We maintain a bullish stance above $270.00–$275.00, with an upside target of $470.00–$480.00 based on multi-revenue stream expansion and high-margin software/service potential.
🧩 Key Growth Catalysts:
🔌 Supercharger Network Monetization
Now open to non-Tesla EVs, creating a recurring infrastructure revenue stream
Margins likely higher than vehicle hardware—similar to SaaS economics at scale
Reinforces Tesla’s ecosystem lock-in and increases brand leverage
🤖 Robo-Taxi & FSD Platform
Robo-taxi launch expected in late 2025/2026 could redefine Tesla as a Mobility-as-a-Service (MaaS) provider
Software-like margins from Full Self-Driving (FSD) subscriptions and usage fees
Establishes a powerful network effects moat
🔋 Energy + AI Synergies
Growth in Powerwall, Megapack, and solar deployments
Custom AI chips powering FSD could open new B2B licensing opportunities
AI + energy + hardware = long-term defensibility and scalability
🌍 Macro Support:
Global EV penetration projected to exceed 45% by 2030
U.S. and EU incentive tailwinds + rising fuel costs accelerate EV demand
Rising demand for grid-scale energy storage bolsters Tesla Energy segment
📈 Trade Setup & Price Targets:
✅ Entry Zone: $270.00–$275.00
🎯 Target Range: $470.00–$480.00
⏳ Time Horizon: 6–12 months (event-driven upside with robo-taxi and earnings catalysts)
🧠 Investment Thesis Summary:
Tesla is no longer just an automaker. It’s an ecosystem-first, AI-powered energy and tech company building infrastructure, platforms, and software at scale. The convergence of hardware, energy storage, and autonomy makes TSLA a rare multi-vector growth story with a durable long-term edge.
#Tesla #TSLA #EV #FSD #MobilityAsAService #EnergyStorage #TechEcosystem #BullishBreakout

Tesla Grabbing Liquidity Market Context 🚩
1-Month Move: +7.3% (from $261.30)
1-Year Move: +45.6% (from $192.50)
Technicals
RSI: ~68.4 (nearing overbought )
Moving Averages: Above 20-day, 50-day, and 200-day MAs (uptrend, but showing signs of exhaustion )
MACD: Bearish crossover forming (momentum fading, potential pullback )
Trade Setup
Instrument: TSLA ❌
Direction: PUT
Entry Price: $280.21
Take Profit 1 (TP1): $270.00 (~3.6% gain ) 🟢
Take Profit 2 (TP2): $260.00 (~7.2% gain ) 🟢
Expected Move: ~8–10% downward
Best AI Signals on the market.

REJECTION OF $292Tesla's stock ( NASDAQ:TSLA ) has faced multiple rejections at key resistance levels. To establish a strong upward trend, it may require forming a triple bottom pattern. This would indicate a solid foundation for potential growth. It is anticipated that the stock will retest the $270 and $250 levels before making a decisive move.

HOLY MOLY! ARE WE IN A RECESSION? $TSLA $120 BEAR FLAG PATTERNA bear flag trading pattern is a technical analysis formation that features a downward-sloping flagpole, followed by a consolidation phase forming a parallel channel. This pattern suggests a potential sharp decline or continuation of the downward trend
I also notice a head and shoulders pattern, as well as an inverse cup and handle.
Everything points to $120.
Sell/Short NASDAQ:TSLA right now with fact check:
+brand reputation risk, high competition, loss of EV market leadership, cyber truck/ product recalls, declining sales with lower margin, stock volatility concern, insider selling, investors buy it based on expected future earnings rather than its current profitability.
+ potential stagflation, tariff war, slow economic growth, inflation, rising public debt, geopolitical tensions, ai bubble, and more

TSLA ! You like money? You like money ?We're here to make money! I don't care about politics or idealists. If TSLA makes +20% in the next few weeks, I'll be very happy! End of story. I only do technical analysis. No emotions here.
hedge funds, YOUR pension funds and market makers have to pay themselves! They're buying the dip, while you're watching the stock collapse! Wake the hell up!
Some troll here haha

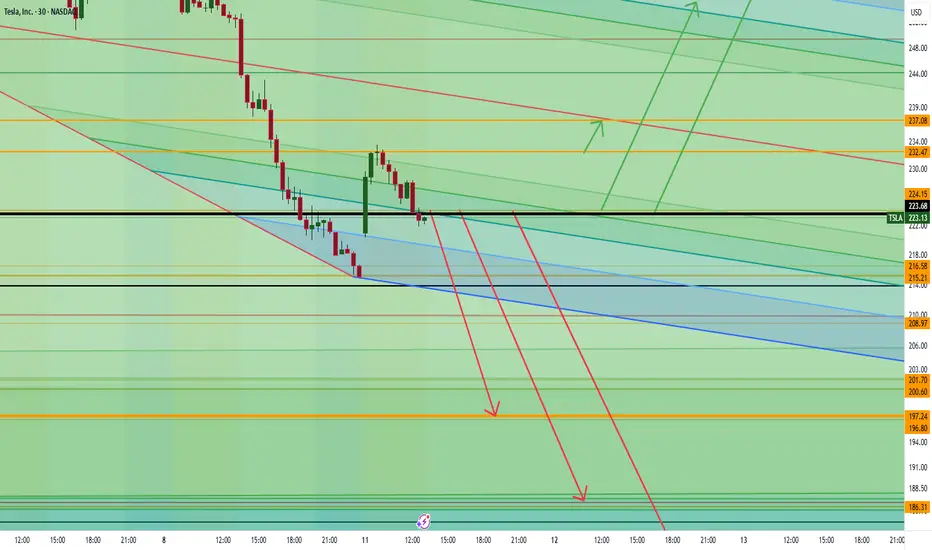
Tesla is About to Collapse… or Skyrocket—Are You In?Tesla is all over the news with boycotts, drama, and market chaos, but the real action is on the charts. If we break below 222, things could get ugly fast with a drop toward 197, 186, and even 176. But if we hold above 223, momentum could send us flying past 232, 237, and potentially 256 or even 264.
Big money is watching, and the next move could be massive. The question is—are you trading this or just watching from the sidelines?
Kris/ Mindbloome Exchange
Trade Smarter Live Better
NIO | China will Lead the EV BattleNIO, Inc. is a holding company which engages in the design, manufacture, and sale of electric vehicles. Its products include the EP9 supercar and ES8 7-seater SUV. It provides users with home charging, power express valet services, and other power solutions including access to public charging, access to power mobile charging trucks, and battery swapping. It also offers other value-added services such as service package, battery payment arrangement, and vehicle financing and license plate registration. The company was founded by Bin Li and Li Hong Qin on November 28, 2014 and is headquartered in Jiading, China.

BYD - What next post-earnings and the BoC's stimulus?HKEX:1211 has had a strong year in growth prospects, reporting solid earnings growth thanks to its robust EV sales and expanding footprint in international markets. The recent earnings beat highlighted an impressive increase in revenue, driven by the demand for both their electric and hybrid vehicles. But what we can notice is that the stock has only reflected this as a c.16% rise in price YTD. However, the question now is: where does BYD go from here?
- More recently, the BoC's latest stimulus measures, including rate cuts and support for the real estate sector, could indirectly benefit BYD. With increased liquidity and consumer confidence, domestic demand for EV's could rise, especially if coupled with additional green energy incentives.
- As for the earnings release, the markets reacted well, and with this new-found optimism in the markets, with both the SEE Composite Index SSE:000001 and the Hang Seng Index TVC:HSI up 5.78% and 9.28% in the past 5 days, is this the turn-around for China as a whole?

TSLA: Down 44% – Is This the Bottom?Tesla has been absolutely crushed since hitting its all-time high at $485. A 44% drop isn’t shocking after such a huge rally, but it’s still a brutal move. Now, we’re back into support, sitting near the level of Wave 1 – so far, nothing completely out of the ordinary.
Maybe to counter some of the selling pressure, Elon Musk tweeted yesterday that he sees a 1000% price increase in the next five years – if the work is put in. Take it however you want. The tweet probably gave TSLA a short-term boost, since Musk’s words always spark some level of hope. But we’ve seen this game before – big claims, and sometimes, reality doesn’t follow through.
Technically speaking:
As long as Tesla holds the order block between $240 and $260, or at least the current support, things don’t look too bad. But if that level breaks, things could get ugly – and $150 might not be far off.
For now, this remains one to watch.

$LIT: EV's Lithium-Powered ETF – Charging Up or Running on EmptyAMEX:LIT : EV's Lithium-Powered ETF – Charging Up or Running on Empty?
EV demand is up 35% in 2023, and lithium prices are up 8% in 2025 so far. But AMEX:LIT is at $40.82, down from last year. Is it time to buy, hold, or sell? Let's dive in.
(1/9)
Good morning, everyone! ☀️EV demand is up 35% in 2023, and lithium prices are up 8% in 2025 so far. But AMEX:LIT is at $40.82, down from last year. Is it time to buy, hold, or sell? Let's dive in. 🔍
(2/9) – PRICE PERFORMANCE 📊
• Current Price: $ 40.82 💰
• Sector Trend: EV sales globally strong (35% growth in 2023, IEA) 🌟
It’s volatile, with EV growth as a tailwind! ⚙️
(3/9) – MARKET POSITION 📈
• Market Cap: Approximately $ 1.37B (based on $ 40.82 price and 33.5M shares, per Apr 30, 2024, data) 🏆
• Holdings: 40 stocks, top include Albemarle, Tesla (per Global X ETFs) ⏰
• Trend: Lithium demand tied to EV penetration, per IEA data 🎯
Firm, riding the battery wave! 🚀
(4/9) – KEY DEVELOPMENTS 🔑
• EV Demand: Continued rise in 2025, per general expectation and IEA trends 🔄
• Lithium Prices: Mixed, with spot prices varying; ETF at $ 40.82 reflects market conditions 🌍
• Market Reaction: Reflects current market dynamics, no specific Mar 3 data 📋
Adapting, EV surge drives interest! 💡
(5/9) – RISKS IN FOCUS ⚡
• Oversupply: Fears may cap lithium gains, per industry reports 🔍
• Competition: New battery tech could shift demand, per industry reports 📉
• Volatility: Lithium prices historically swing, per Reuters 2023 data ❄️
Tough, but risks loom! 🛑
(6/9) – SWOT: STRENGTHS 💪
• EV Growth: Demand for lithium batteries rising, per IEA 2023 data (35% global sales increase) 🥇
• Diversification: 40 holdings across mining, battery tech, per Global X ETF 📊
• Sector Leader: Exposure to Albemarle, Tesla, per Global X ETF 🔧
Got fuel in the tank! 🏦
(7/9) – SWOT: WEAKNESSES & OPPORTUNITIES ⚖️
• Weaknesses: Price volatility, current price down from last known, oversupply fears 📉
• Opportunities: EV sales growth, potential lithium price recovery based on demand, per IEA trends 📈
Can it capitalize on demand? 🤔
(8/9) – 📢 AMEX:LIT ’s at $ 40.82, EV demand climbing, your take? 🗳️
• Bullish: Price to rise with EV surge 🐂
• Neutral: Steady, risks balance ⚖️
• Bearish: Oversupply or other factors cap gains 🐻
Chime in below! 👇
(9/9) – FINAL TAKEAWAY 🎯
AMEX:LIT ’s EV demand drives potential 📈, but current price at $ 40.82 reflects market caution. Volatility bites, yet dips are our DCA gold 💰. We grab ‘em low, climb like pros! Gem or bust?

Nicest setup I’ve seen in a while-Not complicated; why make it?Tesla with perfect technically sound pattern
Five or six things coming together, including a perfect tag of the breakout line, a perfect tag of the long-term uptrend line a Bollinger band crash perfect tag of the Fibonacci .62
It’s like a perfect set up
Not very complicated; why make it complicated?

$NIO Will a similar OBV and Volume pattern lead to a rally?Pay attention to the recent OBV structure (blue). Declining and forming a flat bottom.
The volume in pink displays the same characteristics during each stage of the Inverse H&S pattern: forming an initial peak during the left shoulder, a higher one during the formation of the head (although the head of the current pattern is accompanied by lower volume, but I have an explanation for it), and then peaking during the formation of the second touch of the base, at the start of the right shoulder. Finally, the volume dives along with the last peak of the structure before leaving the pattern altogether.
Additionally, notice how the Weinstein 30-week indicator is finding a bottom here.
During the 'head' or second dip, NIO's price declined on lower volume than in 2019. I can see it as a change of character. It looks like NIO didn't take this dip seriously this time.

$NIO Triple dives, a repeat of 2020-2021. Bears in hibernation.During the first dive, volume is at its lowest. It dips slightly during the formation of the second dive in the middle, then gradually rises as the final shake-off takes shape, eventually reaching a high point.
Observe what's happening, a divergence between price and the On Balance Volume.
2020 // While the stock formed lower lows, the OBV stayed near the same level. During the first dive (part of a triple dive pattern), NIO’s On-Balance Volume kept declining until the second dive formed, after which it began to rise.
2025 // The OBV forms higher highs with each dive. While the price is making lower lows against a descending resistance line, the OBV is trending higher. Why is the price dropping when the OBV has reached the same level? I’m sensing a reversal is on the horizon.
The OBV is acting up.
What do you think? I'm very bullish.

TESLA ($TSLA) – PRICE CUTS, NEW MODELS & SHRINKING MARGINSTESLA ( NASDAQ:TSLA ) – PRICE CUTS, NEW MODELS & SHRINKING MARGINS
(1/8)
Tesla’s Q4 2024 revenue came in at $25.17B (+1% YoY), missing estimates of $25.87B. Full-year revenue hit $97.69B, only slightly above 2023. Let’s break down the numbers! 🚗⚡️
(2/8) – EARNINGS SNAPSHOT
• Q4 non-GAAP EPS: $0.71 (vs. $0.74 est.)
• Net income slipped from $2.51B (Q1 ‘23) to $1.13B (Q1 ‘24) → margin pressures
• Full-year EPS: $2.04. Investors are edgy over slowing profit growth 😬
(3/8) – NEW AFFORDABLE EV
• Tesla plans to launch a lower-priced EV mid-2025—could spark future growth 🚀
• However, concerns linger about declining margins due to recent price cuts & softening EV demand 🔻
(4/8) – SECTOR SNAPSHOT
• P/E trailing: 177.26, forward P/E: 124.35 → major premium vs. Toyota (~8.5) & GM (~8.7) 🔎
• EV/EBITDA: 87.53—again, quite high
• Analyst avg. PT: $307.62 vs. current ~$355 → Some see overvaluation 📈
(5/8) – PERFORMANCE & COMPETITION
• Tesla’s revenue growth lags behind EV rivals like BYD (especially in China) 🇨🇳
• High valuation is tough to justify if margins keep slipping & demand cools
• Others note the potential for a “market correction” if Tesla doesn’t re-accelerate growth 🔻
(6/8) – RISK FACTORS
• EV Demand Slowdown: Price cuts & fierce competition in China
• Production Delays: Cybertruck & new affordable EV might take time to ramp
• Regulatory: Shifts in incentives or rules could slow sales 📉
• Economic Pressure: High interest rates = less consumer cash for big-ticket items
• Elon Musk: Diverted focus (X, SpaceX) + polarizing behavior 🌀
(7/8) – SWOT HIGHLIGHTS
Strengths:
Leading EV brand & loyal customer base 🔥
Diversified streams (storage, solar) → less auto reliance
Massive market cap at $1.16T shows confidence
Weaknesses:
Shrinking margins (~17.86% in 2024)
Production hiccups → scaling issues
Sky-high valuations vulnerable to correction
Opportunities:
2025 mass-market EV could open huge demand 🚗💨
AI & autonomy (FSD, robotaxis) for new revenue
Energy storage growth offsetting auto slowdowns 🔋
Threats:
Competition from BYD, GM, etc.
Lawsuits & regulatory scrutiny (discrimination, product defects)
Global economic uncertainty → lower vehicle sales
(8/8) – With Tesla trading around $355 & a P/E near 177, is it still worth the premium?
1️⃣ Bullish—Musk’s vision & new EV model = unstoppable 🚀
2️⃣ Neutral—Waiting to see if margins recover 🤔
3️⃣ Bearish—Overvalued, competition is heating up 🐻
Vote below! 🗳️👇

LAZR consolidation complete! Strong buy setup!Solid base built over last several weeks.
Consolidation now complete. Ready to run to 12.8$ target likely into March timeframe given today’s breakout above 6.20
Will likely consolidate a bit more after 12.8 is reached, before continuation to 20-22$ buy-side targets later in 2025.
Great longer term swing trade from here!
