BITCOIN is below support level, Sell tradePrice is below support if price gives any bearish signal look for sell trade
Excavo

BITCOIN | Price is near SELL zone,Very High Probability Trade!..BITCOIN Update..
The price is approaching a very strong support/resistance level and previously,market has reacted strongly to this level and started a bearish impulse move,wait for the price to reach the level and If price gives any bearish signal,look for sell Opportunity...
Push LIKE & SUPPORT the Idea...
For Entry:
Wait for the formation of Beaish Candlestick Pattern to close on 4hr timeframe for confirmation to Sell..
Trade it with proper Sl..
*The content on this analysis is subject to change at any time without notice, and is provided for the sole purpose of assisting traders to make independent investment decisions.

5.2.2020 - Bitcoin (BTC / USD)Hi Traders!
Today, we look again at bitcoin, but in a shorter time frame. We see an essential zone that can decide on further developments.
On 17.12.19 we witnessed another "LOW".
We're currently in the channel and have completed waves A and B. At this point we're already in wave C and there's no doubt that bitcoin has started a new cycle. Each new cycle has at least 3 waves and therefore our conservative target is in the range of $ 10,853 - $ 11,486. At this level, there is resistance in the form of the trendline and 1:1 extension. This is where we would sell most of the position and wait for what happens next.
A bullish scenario would be a situation in which the zone is broken upwards for the first time. In such a case, a retracement purchase would be appropriate.
The bearish scenario is such that we cannot break through the zone and drop subsequently.
Basically, it's just how strong bitcoin is before halving. Before or at about the halving time, there's a high probability of decline as speculators will most likely sell. So this zone is a reasonable target where we would wait for the next steps.
May the crypto be with you!

BITCOIN - What Would Happen If The Moon DisappearedWhat Would Happen If The Moon Disappeared?
Imagine all this hype about the next Halving in 148 days, fail.
Imagine!?
I told you about these pumps and dumps for months, just take a look in my profile..
Note: Bitcoin gonna explode like a MOAB in the long run, but for now, I dont think so..

BITCOIN | Price in a Channel and close to Resistance level,SELL!BITCOIN Update..
Price is following a downtrend channel and is close to support/resistance level,If theprice stays below the resistance,price could continue it's down move till the next support levels,and If the price gives any bearish signal,look for Sell opportunity...
Push LIKE & SUPPORT the Idea...
For Entry:
Wait for the formation of Bearish Candlestick Pattern to close on 1hr timeframe for confirmation to Sell..
trade it with proper SL..
Be carefull from false breakouts..
*The content on this analysis is subject to change at any time without notice, and is provided for the sole purpose of assisting traders to make independent investment decisions.

ETHEREUM | Price broke below Support,Wait for pullback to SELL!.ETHEREUM Update..
Price made a strong Bearish move and broke below the support/resistance level,price is in strong momentum it could continue to move down,we can't enter in an Impulse move,wait for the price to make a pullback or a small correction,If the price gives any bearish signal,look for Sell opportunity...
Push LIKE & SUPPORT the Idea...
For Entry:
Wait for the formation of Bearish Candlestick Pattern to close on 1hr timeframe for confirmation to Sell..
trade it with proper SL..
*The content on this analysis is subject to change at any time without notice, and is provided for the sole purpose of assisting traders to make independent investment decisions.

BITCOIN|Price made strong Bearish move,Wait for pullback to SELLBITCOIN Update..
Price made a strong Bearish move and broke below the support/resistance level,wait for the price to make a pullback or a small correction,If the price gives any bearish signal,look for Sell opportunity...
Push LIKE & SUPPORT the Idea...
For Entry:
Wait for the formation of Bearish Candlestick Pattern to close on 1hr timeframe for confirmation to Sell..
trade it with proper SL..
*The content on this analysis is subject to change at any time without notice, and is provided for the sole purpose of assisting traders to make independent investment decisions.

Bitcoin gotcha! Target hitHello guys and gerlz
I am proud to announce that my idea buying #BTC from early 7K has successfully played out reaching it's target at 9keks!
It is now time to reconsider charts.
I am definitely expecting some pullback from here which will establish the range for new consolidation or #BTC may as well continue bleeding as it has been doing from 20keks.
Please please please!!! DO NOT forget to comment and like my analysis, agree or disagree, regard to disregard! Action is better than no action! Appreciate it!
Love you all! Trade safely!

BITCOIN |Bearish divergence on RSI,When to SELL with Tp- $8,570!BITCOIN Update..
the price is approaching a psychological level of $ 9,000,also price & RSI are giving bearish divergence,If the price gives any bearish signal,look for Sell opportunity...
Push LIKE & SUPPORT the Idea...
For Entry:
Wait for the formation of Bearish Candlestick Pattern to close on 1hr timeframe for confirmation to Sell..
trade it with proper SL..
*The content on this analysis is subject to change at any time without notice, and is provided for the sole purpose of assisting traders to make independent investment decisions.

GOLD | price in a Downtrend Channel & in the SELL zone,SELL!....GOLD Update..
The price is in a downtrend channel & the price is below Support/Resistance level, If price gives any Bearish Signal, Look for Sell Opportunity...
Push LIKE & SUPPORT the Idea...
For Entry:
Wait for the formation of Bearish Candlestick Pattern to close on 1hr timeframe for confirmation to Sell..
Gold is following fundamental news,So trade it with proper SL..
*The content on this analysis is subject to change at any time without notice, and is provided for the sole purpose of assisting traders to make independent investment decisions.

CADJPY | Price near Reversal zone,when to SELL!..CADJPY Update..
the price is near key support/resistance level, If price gives any Bearish Signal, Look for Sell Opportunity...
Push LIKE & SUPPORT the Idea...
For Entry:
Wait for the formation of Bearish Candlestick Pattern to close on 4hr timeframe for confirmation to Sell..
Trade it with proper Sl..
*The content on this analysis is subject to change at any time without notice, and is provided for the sole purpose of assisting traders to make independent investment decisions.

Trend reversal or bull trapIf we talk about technical analysis
I see inverted head shoulders, the same as it was in 2018.
Also we are near MA200, now the situation is identical, we reach this moving and after that we go down
61.8 fibonacci level also works
The media is very bullish
Bloomberg every day there are articles from January, articles for beginners, about "that everything is fine, after 4 months halving and you will see the price twice as much.
There is no bottom when the media say that everything is fine. The bottom is when the media say that this is an apocalypse, collapse, only bad information.
Let's look at the situation regular traders bought at a price of 7-8k dollars
Who is buying 8-9k now? big players?)) I don’t think so, retail traders who jump into the outgoing train
you remember the end of 2018 when the media said that at the end of the year we will see 20-15k and after that you remember that we go to 3k.
What we can see now is the inverted head shoulders, and create the illusion of a return. All those who are now gaining a position are the very people who will be the first to sell, and stop loss in the area of 6800-6400 and after we achieve this, the position closes in the market and we go even lower.
January 25th, we have a Chinese New Year, in the coming week, I think many will go at these prices and after that we will go lower
This is my opinion we are still in the downtrend after a break and consolidation above 10400, for me there will be a final change of trend
Best regards EXCAVO

DAX-30The DAX (Deutscher Aktienindex (German stock index)) is a blue chip stock market index consisting of the 30 major German companies trading on the Frankfurt Stock Exchange. Germany is the strongest economy in Europe. But in Europe is not very good there are more indebted debtors Greece, Italy, Spain ..., England has already fled the sinking ship. And the situation in the European Union will deteriorate. On technical analysis, showed the wave theory of the Elliott. We paint the fifth wave and after down the ABC correction. At the top showed a yellow line of resistance that with a black support line makes an rising wedge - a reversal pattern.


USDZAR idealook close to the chart you can see that the first downtrend have started it will retest and pump up again , so we will notice a serious downtrend


XAUUSD Breakout we have seen a breakout on XAUUSD and we will be expecting more uptrend on GOLD. next week.

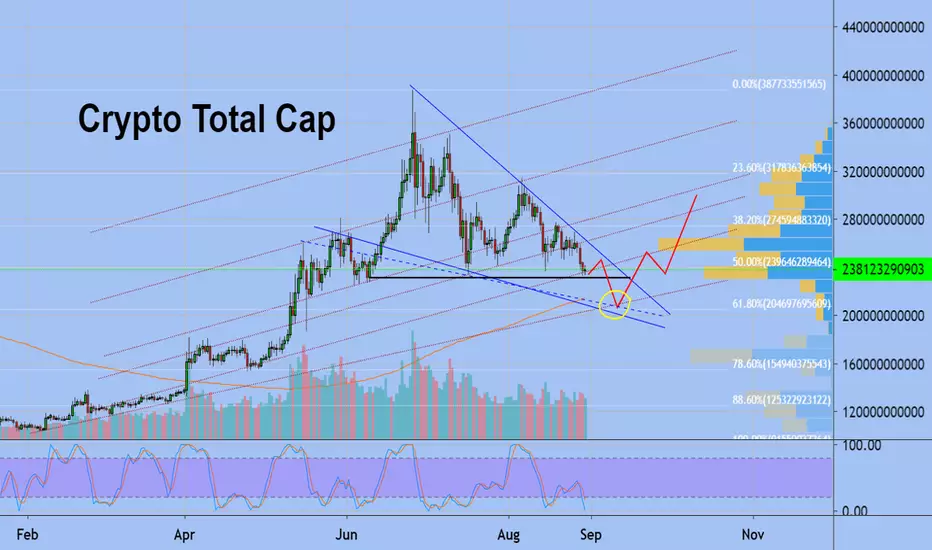
Crypto Total Market CapWe moving in up trend channel with support level at 200 bln
We are near the level of support that we are likely to break down. And again, the exchanges will earn on the
liquidation of large orders, which will cause a snowball. liquidation by a market order - and touch other orders are liquidated. And the panic sale will return to the market. Usually after such sales and large liquidations, the market turns around. I think this is the scenario that will be implemented
But what will we be in 2 months?
A new big telegram player with the TON project, its founder Pavel Durov, and a huge telegram community will come to the market.
I think that this coin will be in the top 5 by capitalization in a year.
And this announcement will be a new impetus for the entire crypto community.
In addition, I see that two exchanges are starting from bitcoin.com and blockchain.com
Draw conclusions
Best regards
Your EXCAVator;)
NEOBTC Increased DemandHello friends !
Considering the increased demand for this coin, I dare to suggest that something will soon be on this coin.
Therefore, it is worth looking
NEOBTC
buy zone 0.000975 - 0.001050
stop 0.000965
1st targets 0.001200 ( 15 % )
2nd targets 0.001300 ( 25 % )


BitcoinWe move in a symmetrical triangle.
Several times we touched the support line and with good volumes go up. Touched the dashed line of resistance and now we are determined we will continue to move towards the resistance line of a large triangle or not.
But we are still moving down trend channel and now near midle line of this channel
I look at D1 chart and I see we touched MA100
How its works in the past
You can see false break down and after we go up.
BTC % domination we touched MA200
Longs and shorts
longs will go up
shorts - flat

ERD - Al Qaeda called me today, this shit gonna explode soonLet's see if Al Qaeda are talking seriously
IF The candle close above the green line.
1TP @40 Sats
2TP @50 Sats
3TP @60 Sats
4TP @70 Sats
See u soon baby, let's see again!
My Instagram @uncodedmind

Bitcoin - EXCAVO Wait me on the Top 1!When the "Magic" happen..
Guys, that's not magic...just technical analysis, we can't predict 100% all the movements but we have the probability in our favor.
Excavo my friend, hold the top 1, cause Im arriving soon.
