CardanoI want you to pay attention to this coin. because it is a great project with its blockchain, an excellent team and great growth potential before the big news in the company in the first quarter of 2019. Go to proof of stake.
www.investinblockchain.com
The whole of 2018 ADABTC has fallen. formed a falling wedge, after another wedge but with a smaller angle of inclination. And now we are moving up the channel.
Daily RSI - oversold
We are above MA50 and MA100 but still under MA200
Excavo

AeternityAEBTC since the beginning of 2019 in the accumulation zone, we can see this in volumes. now formed a triangle with a break up.

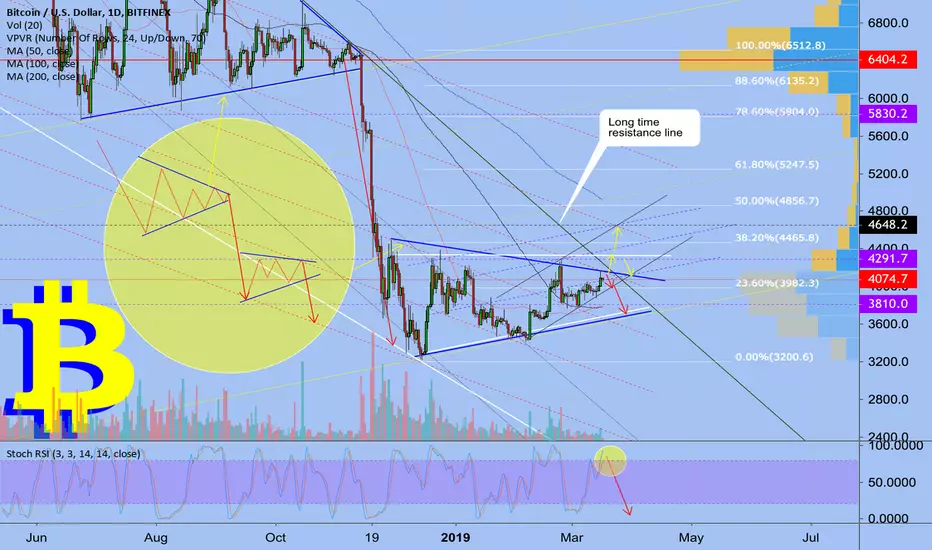
BitcoinBTCUSD formed symmetric triangle after we touched resistance line of the triangle we go down. Also BTCUSD formed falling wedge -reversal pattern.
I think next week we will see Bitcoin correction

LTC/USD - *Chart Pattern Identified* Ascending TriangleTime to short. we retested the pattern line and we can probably go up to 161.5 at the most. anything about 162 I think would be short term bullish again.
Short her is an amazing R:R I think. But be careful, you never wanna short the strongest and long the weakest. I may fund something else to short like EOS, ET or something else. BCH and LTC scare me right now. even if they go down IDK if they will fall at the same rate at the other coins will.
But this chart looks beautiful to me.

InsolarINSBTC moving in uptrend channel after break out falling wedge. And probably we go to the 61.8% level fibonacci (850sat) first
Just a few days ago Insolar managed to ramp up the max network transaction speed to 19,000 per second explorer.insolar.io that makes Insolar the fastest blockchain for business as of now
On March 4, Insolar will launch its Testnet 1.1 in which external nodes will participate
My recommendation to buy INS before Testnet

BITCOIN : Daily Chart AnalysisBTCUSD
Global the bearish formation, triangle. Have key levels by Bitfinex.
The similar pattern with Fibonacci lvl on chart + BTC near resistance line. By RSI near uptrend support.

TezosXTZBTC after we found the bottom, the Tezos began to grow, now it looks very bullish.
I believe in this project
Swing trading

EURUSDEURUSD formed global falling wedge -reversal pattern nut question we will go to test support line of the wedge or no. Also we moving in down trend channel and I think we will touch resistance line of this channel. The movement depends on whether we break the line of resistance and consolidate above or not. Nobody canceled false breakup. If we do not break then we fall lower.
This is not trading idea this is just a view
Always glad to your discussions in the comments under the chart

ZCashZECBTC
Moving in falling wedge - reversal pattern. Yu can see biggest trading volume since January
ZCASH moves not like the whole crypto-market. If you look at chart ZECUSD you can see squeeze I think this is position liquidation. In my experience, after such a squeeze, an increase occurs.

ZILLIQAJust yesterday, the coinmarketcap published a new rating of projects. The results are set on a scale from 0 to 1000 points and have the corresponding letter grade.
With the help of the rating it is impossible to fully evaluate projects and compare them. When analyzing a project, you should definitely conduct your own research.
Their rating will allow you to simplify the market navigation, assess the performance and achievements of the project.
Bitcoin, by the way, scored 887 points in this rating and received an A grade.
Zilliqa is also not lagging behind, the project got 787 points
For the past two weeks, the project team has focused on technical settings, as they approach the full-scale deployment of the Zilliqa Core Network.
We are waiting for the announcement of the move tokens ZIL from the team, it should appear very soon
technical analysis
We in bottom. ZILBTC formed up trend channel and now we near support line of this channel this is the best position for swing trading - position trading.

OntologyONTBTC look very bullish. Formed bullish triangle with big potential break out resistance line
blog.blockfolio.com


SilverThe graph shows the classic economic cycle of a financial instrument. It consists of four parts (expansion - boom - recession - depression)
Silver broke through its strong trend line, as well as the MA 200 crossed this called Death Cross - this means a trend reversal and we are in the Depression zone.
We touched the support line in the $ 13.9-14 zone and didnt break through and go to the resistance line and now we are moving towards the resistance line of the blue triangle and there is also a black resistance line. Most likely we will test it and continue to move down.

Bitcoin
After we broke through a large triangle and broke the 6000 level, we found support around 3000 and formed a triangle and we entered this triangle from above and it can talk about continuing downward movement. But there are things that contradict this and these are the volumes that are now on the market.
The crypto rally of the Altcoins pleased many traders with their rocketts, and I think now is the calm before the storm. Now we are near a long time line of resistance. And if we break out then for many traders this will be a sign for opening long positions. Since the triangle is broken up the support line is broken, yes it is truly inspiring. and maybe finally we will go up.
But I would not start to rejoice because we are still in a bear market. we are still under MA 200. D1 and W1 RSI is overbought. And we do not fly on the rocket up. I also showed a grid with all the lines of resistance and support that traders must take into account when making investment decisions and building trading strategies.
But the most terrible indicator for me that shows the imminent fall is the Crypto Fear & Greed Index and now we are at around 58 this is an indicator of great greed in the market and with such indicators the market is falling.
alternative.me
I do not think horribly and do not want someone to think that I do not want go to the moon :) I just share my vision and my observations on the market
Thank you for you like and comment
LTC/USD *Chart Pattern Identified* Ascending TriangleHey guys, I have been calling this for a while now. but this is looking very good from a chart pattern perspective.can go up more...and probably will. But, I would suggest to watch out.
I will look to short this pretty soon.
I am semi bullish and bearish lol.
But please remember we are still in a bear market unless proven otherwise. so far things look good. but be careful


ZCASHZECUSD
The falling wedge, 1D divergence by RSI.
ZCASH moves not like the whole crypto-market sometimes and charts with BTCUSD kind different.

EnigmaEnigma great project. ENGBTC moving in triangle with potential break out resistance line. Now we are in accumulation zone, I see some big volume in this zone. Also I want to note that the last time before the pump, there was a squeeze. My recommendation look at this coin, and gain a position, the growth potential is huge

XRP rippleXRPUSD Daily Analysis
Positive news last time(fundamental), TA on the chart with resistances lines, supports lines, zones.

LiteCoinWe can see how LTCBTC moving in uptrend. We touch top 3 time - this is patter called triple top - reversal patter. Also we can interpreted like head and shoulders - reversal pattern. But we in bull trend and this formation we also can interpreted like a impulse - correction(in triangle or horizontal channel) - impulse . But I think first we will go the trend black line at 38.2% level Fibonacci. So this good position for short.

EOS/BTC Chart speculation - Descending Trianglehey everyone, just thought I would post this... kinda too early to tell but its possible and I like it lol.
we have to touches so we MAY be able to get something going... of course theres no trade for a long rn but if this gets another 1-2 hits inside the triangle I will be very excited!
Thanks for joining us!

Eos/BTC *Chart Pattern Identified* Symmetrical Trianglenot much to say. LTC call was made JUST IN TIME. sorry guys. I was gunna post this before it broke down lol. got ready for bed... cause im 8 years old and I came back to it bleeding out already!
Im aiming for the .618 fib for wave C which should be able to go down in a 5 wave move.
good luck to everyone!

Litecoin LTC/BTC *Chart Pattern Identified* top H&Slooks good to me. only other option is a symmetrical triangle in my eyes. either way a short here would be slick I think.
SL above last high maybe.
Invalid if we pass high at top of Head.
looking to short this and I would suggest doing your own research.
