Macroeconomics for Crypto.Why bitcoin does not go with the S&P?This is research is to figure out where and when to look for the bottom of bitcoin. More importantly when to get out of it if we have a bull run. This may be something new to you, but macroeconomics is crucial here. And this I will try to explain it.
The main hypothesis is that the cryptocurrency market has become highly institutionalized, the guys from Wall Street came here. They don't know how to trade from the level, unfortunately, but they know how to do macro sentiment - and Bitcoin became part of their portfolios and now trades the same way as the stock market. Bitcoin has all but lost its independence when Wall Street the weekend trading volumes and volatility is very low almost nothing happens.
In 2018 guys like Fidelity came into cryptocurrencies. In 2020 they invited their rich clients and it was a turning point, since then all major banks and funds have been sending their clients compilations with analytics on cryptocurrencies
This is an example from UBS bank
It's not what we're used to seeing in Tradinvgview or on Twitter, but it's nothing complicated
My opinion is that, the connection between cryptocurrency and stock market will only increase, so I urge all traders and investors to pay attention to the way Wall Street analyses work. Their job is to constantly monitor the analysis of the two economic cycles: business cycle and stock market cycles
This is a schematic representation, the cycles are unsynchronized. The stock market is a reflection and result of the expectations of traders as to what is happening or will happen in the business cycle
Business cycle scheme
Everything starts with a reduction in interest rates by the central banks or with an increase in government spending, loans and mortgages become cheaper, the housing sector grows first - houses are built, more resources and materials are spent, the economy comes to life. People buy homes, make repairs, buy appliances, furniture, buy cars, have children, pets. They multiply their consumption, buy a second TV in the living room, subscribe to netflix, go to barbershops and beauty salons - the manufacturing and service sectors grow, unemployment falls, household incomes and corporations grow, and prices rise with them. Consumption peaks - inflation becomes dangerous - the Central Bank raises interest rates - credit and mortgages become more expensive - the housing sector collapses followed by the manufacturing and service sectors, unemployment rises, household and corporate incomes fall, consumption slows, inflation slows down.
Sometimes there is a recession, the central bank lowers interest rates - the cycle is closed 😀
This year, almost all central banks in developed emerging markets are raising interest rates.
Fact - 50% of all macro analysis will come down to assessing the likelihood of interest rate increases or decreases.
Obviously there is money, there is growth and vice versa there is no money, no growth.
We're about here in the middle of the cycle, a global recession is likely ahead
All this is necessary and important to understand in order to assess the prospects and dynamics of stock prices on the stock market. We are used to the fact that there are many companies whose shares are traded on the stock exchange, and the companies themselves are divided into sectors and industries for classification. The first to react to the expectation of economic recovery are the sectors of financial housing and transport and so on. The logic was described above - mortgage, Home, Car, Kids, TV, netflix subscription and barbershop, etc.
Wall Street looks at the stock market a little differently, through factors, that is, properties of certain groups of stocks, for example: industry sectors are commonly divided into cyclical - these are goods services secondary necessities that are highly dependent on the business cycle and non-cyclical - that is, these are goods services primary necessities that are not so highly dependent on it.
The first - will respond cyclical, the factors are hundreds, but I will tell you with the most important and understandable. Imagine we take all the stocks and sort them by properties, by volatility, by beta, by dividend yield, by business margins, by multiples and so on so by these factors the stocks are sorted into a whole group.
The first factor I consider is the volatility factor aka beta imagine an index of unprofitable junk companies like Virgin Galactic and other meme stocks this will be the extreme manifestation of the beta factor and the riskiness of the idea in Ark innovation by Cathie Wood - it consists of just that.
The Quality factor is dividends, blue chips, s&p 500 index, Dow Jones is about them.
The Value factor is the value of perpetually undervalued companies with low multipliers, the core of the real economy, they also have their own index, Russell 2000
Growth factor - Growth stocks are companies with prospects of perpetual revenue growth Apple Tesla uber is them And the nasdaq 100 is their index
The Size factor is about capitalization small, medium, large, huge
The institutional manager's view on the composition of the portfolio is approximately as follows: there are two modes of money and no money.
When all is well, money is worthless, cash is trash. The manager buys into his portfolio everything that has high risk and high profitability, high-risk assets: IPO, SMall Cap, venture capital, cryptocurrencies, etc.
When the regime is like now, when money is expensive and everybody needs it, the riskiest part is sold first, and further down the chain the portfolio increases the share of cash and bonds from the shares.
Here's how these factors look within the stock market cycle. High-risk cyclical small-cap stocks are the first to respond to rate cuts and economic recovery. Next come value stocks, then quality stocks, then growth stocks. Eventually the party ends for everyone and everything goes down, risk OFF mode kicks in.
Finally, Bitcoin's connection to the stock market
Next you will see the result of a manual correlation search with thousands of stocks of different factors and other asset classes.
I will show just a few : the orange line is what we are comparing to, the blue line is the bitcoin scale logarithmic.
correlation coefficient on the right - peak correlation and current correlation
look only at the visual picture
First s&p 500 index is a quality factor peak correlation 88 current 68. Large Cap, Quality, Low Beta
For example Coca Cola - Correlation is negative.
Nasdaq 100 factor Grow stock growth peaks correlation 86 current 72 is little
is the Russell 2000 Value Factor Index And in it most of the small and mid-cap companies from the real economy cyclical sectors in the Peak correlation 93 now 79
The transport industry index in Peak is 95 current 82
Bank index 94 peaks 30 now
If Bitcoin were a stock
it would be an asset: Value, Cyclical, Small Cap, High Beta, High Risk asset.
Stock - value, cyclical sector, small capitalization, high beta and high risk
Its place in the cycle starts from where all cyclical industries like transportation, small capitalization companies with the value factor before the recession
Here's what the dynamics of the various stocks look like depending on the macro regime actually this is the main chart look at top Bitcoin next comes the SP500 below the Russell 2000 index and the nasdaq 100
From the covid bottom After the rate cuts, everything went up - it's understandable high risk and loss assets rose the most. But of the indices, it was the Russell 2000 that showed the most growth
February 2021 marked the vertical lines , inflation expectations hinted that things would be very bad and the entire high-risk segment of the portfolios began to close. the highbets and High Risk were the first to go under the knife.
The Russell 2000 stayed basically the same as Bitcoin for a whole year, but it moved stronger.
And the Nasdaq 100 and s&p 500 continued their movement.
This January's response is the second vertical line turned risk OFF for all assets and the party is over. Bottom line Bitcoin doesn't go for the nasdaq it doesn't go for the s&p 500 goes with the Rassell 2000 index and high-risk assets as part of someone else's portfolios.
So we have already seen a new bull run early and it will quickly start and quickly end we should try to be ready for it and not wait for miracles.
I really want to remind you that bitcoin's bottom and peak is not a price or a date - it doesn't work that way. It is a period of macro regime change from risk on to risk off and back
I have a plan for How to watch and how to act. Thank you very much for your attention. I wish you success in trading and learning the macro, I am sure you will find it very useful .
I would also like to thank Anton Klevtsov for the information
Best regards EXCAVO
Excavo

RWA narrative
Real-world assets, is heating up more and more. BlackRock CEO says RWAs will be a major usecase for crypto
If you want to start exploring this niche, this sampling will help you a lot.
Here you will find links to the Twitter accounts of the RWA projects highlighted in the panorama.
Messari PRO recently released an interesting mini-report outlining how RWAs are invading the classic financial sector.
Over the past few months, traditional funds and asset issuers have launched alternative asset tokenization programs via public crypto-networks. Recent asset releases have revived interest in real-world asset portability (RWA) onchain and opened up new revenue opportunities within decentralized finance (DeFi).
Private equity firm Hamilton Lane has partnered with Securitize, a digital asset release platform, to tokenize part of its $2.1 billion flagship equity fund on the Polygon network. The fund requires a minimum investment of HKEX:20 ,000, well below the typical minimum buy-in (fund entry) of HKEX:5 million for private investors.
Hamilton Lane is one of the largest private wealth managers, investing more than HKEX:37 billion in private markets in 2021. It manages SWB:824 billion in assets.
Similarly, the Monetary Authority of Singapore (MAS) announced Project Guardian, a pilot program to tokenize bonds and deposits that can be used in various DeFi strategies.
A bank participating in the program will be able to tokenize bonds and deposits that can be used in permitted liquidity pools. This capital can be lent in DeFi applications such as Aave and Compound to earn interest or as collateral to access credit. The pilot has attracted JPMorgan, DBS Bank and Marketnode as initial partners.
Broader Context
Since the first DeFi protocols began gaining momentum in 2020, they have been a driving force in attracting users and traders into the crypto space. DeFi experiments have enabled innovative financial applications such as decentralized automated market makers, stackablecoins, credit, insurance, swaps, synthetic assets, and derivatives.
Total locked-in value (TVL) in DeFi applications, conventionally translated as the amount of capital under management, has skyrocketed to a peak of HKEX:248 billion in December 2021 as asset prices rise and new users are attracted. TVL is supported by liquidity mining programs in which protocols drive growth by temporarily increasing returns by offering users rewards in the form of native protocol tokens, such as Compound rewards lenders with COMP tokens.
These returns have been volatile as token prices have fallen and overall interest in crypto has declined during the 2022 bear market. Historic USDC Stablecoin credit rates peaked in December 2020 at 18% for Aave and 8% for Compound. Those yields fell to 0.75% and 1.62% today, respectively.
As the yield on one-year U.S. Treasuries is around 5%, investors have rushed into safe government securities. Treasury bond yields rose sharply as the Federal Reserve abandoned its zero interest rate policy, with the one-year bond up from the 0.3% yield in December 2021.
As the risk-free interest rate in traditional finance has risen and DeFi yields have declined, investor participation in the latter has declined significantly in recent months, with TVL down more than 75% from its December 2021 high to HKEX:52 billion today.
To attract new capital, DeFi protocols are beginning to use RWAs as a source of collateral or new investment opportunities, providing more stable returns for investors.
Tokenization of real assets, such as real estate, commodities, private equity and credit, bonds and art, is a concept that has been quietly seeping in since 2018. RWAs take advantage of blockchain technology for the on-chain introduction of traditional assets.
Key quote:
"RWA tokenization offers tangible benefits, including lower minimum investment and increased access through shared ownership, increased trading of previously illiquid assets, increased transparency and security as blockchain records an unchanging record of transaction history, and automated ownership management and compliance."
Key statistics:
When the seven largest private credit blockchain-RWA protocols are combined, the historical loan value is $4.2 billion and active loans are HKEX:456 million. These protocols use DeFi to provide private loans to businesses and include Maple, Centrifuge, Goldfinch, Credix, TrueFi, Clearpool and Ribbon Lend. They offer an average APR of 12.63%.
Outlook and Implications
DeFi must offer higher returns than traditional investments to remain competitive and attract capital. DeFi applications such as Maple Finance, Goldfinch and Centrifuge pool cryptocurrency holders' funds and lend them to generate income through different strategies.
Maple Finance is a platform for institutional borrowers to leverage the DeFi ecosystem for loans with insufficient collateral. Pool Delegates are loan officers who create and manage pools on the platform and find institutional borrowers by structuring terms for each loan pool. Lenders can then contribute crypto funds to the pools they want to support by lending their assets in exchange for income. To date, Maple has made cumulative loans of nearly $1.8 billion.
Goldfinch is in the business of making loans to real businesses in emerging markets. Borrowers must be audited to determine their loan eligibility. Once approved, they can create pools and determine loan terms such as interest rate, loan amount, term and late fees. Lenders can grant capital to individual pools at their discretion and be the first to bear capital losses on impaired loans, thereby earning higher profits. Alternatively, liquidity providers can provide capital that is distributed to all pools of borrowers, earning lower returns with less risk of capital loss.
While Maple and Goldfinch focus on private lending, Centrifuge allows more forms of real assets, such as real estate loans and freight accounts, to enter the DeFi ecosystem. On a Centrifuge trading platform called Tinlake, the creator converts a real asset into a non-transferable token (NFT) and includes the appropriate legal documentation. Asset pools are created using NFTs as collateral representing RWAs. Investors can then provide capital to pools that match their risk preferences.
Real asset tokenization allows DeFi to enter some of the largest financial markets. Global real estate was valued at HKEX:327 trillion in 2020 and non-financial corporate debt at more than HKEX:87 trillion in 2022. These are colossal markets to which tokenization could bring increased liquidity and new investors.
Decision Points
When evaluating income opportunities, investors should examine the track record of existing DeFi-applications that use real assets. Have they defaulted? What is the underwriting and due diligence process and how do they manage risk? Underwriters that require borrowers to over-collateralize, have access to insurance, or have support mechanisms in place in the event of default may perform better over time.
Notably, Maple Finance had a HKEX:36 million loan default in December 2022 in one of its loan pools. The borrower, Orthogonal Trading, suffered a loss because of the FTX collapse. In response, Maple launched version 2.0, which introduced a faster default and liquidation process for loans that failed. This points to the need for better risk parameters and sector diversification among borrowers for credit DeFi platforms with insufficient collateral, such as Maple.
Instead of lending capital directly, investors can also bet on the success of DeFi-oriented RWAs by buying their own tokens. The prices of these tokens will correlate with the rest of the crypto market, but may show greater value for winning platforms.
What's causing this boom? Many protocols that previously offered volatile yields have now reduced yields, and as the government offers more attractive yields through bonds, there is a shortage of new capital. By offering RWAs as a source of collateral, DeFi is opening its doors to the broader financial market of non-cryptocurrency natives. Having assets backed in part by RWAs also reduces risk for cryptocurrency lenders.
We can expect more and more institutions to adopt tokenized RWAs ), as seen by JPMorgan executing its first real-time trade using tokenized yen and the Singapore dollar at Polygon in November. Hong Kong Central Bank is now offering tokenized green bonds, and other investment banks such as Credit Agricole CIB and SEB are collaborating to develop a platform for digital bonds.
If you have read this far you are wondering what will happen to bitcoin, we are close to the dates I said in November 2022. I was talking about April-May correction. it is really going to happen, just like a rock we are unlikely to fall before we have to liquidate most of the short positions. so i expect a slight correction upwards 29200-30050 area
Best regards EXCAVO

XRPIn our EXCAVO Family Chat recently, I was asked what I thought about XRP. I've been asked this question for years. It is clear to many crypto people that XRP has little to do with blockchain, smells like a scam, ex-CEO who sold the token in huge amounts, a lot of conspiracy science, the Settlement with the SEC.
But also with that, the company has a lot of partnerships almost every week. You can go in and look at their Twitter feed.
And also we can't forget about ISO 20022, which is an international standard developed by the International Organization for Standardization (ISO) that defines the format and content of messages used to exchange financial information between participants in the financial markets. It was designed to replace older message formats, such as SWIFT MT and Fedwire, and provide for more efficient and accurate exchange of financial information.
I'm not a big fan of this project, but it's always on my radar. 'Cause I've already made good money on it a few times
Best regards EXCAVO

DogeChain - ready for a doge raceWhat is DogeChain?
DogeChain branded as Layer 2 for DogeCoin aims to supercharge $Doge by bringing crypto applications such as NFTs, games, and DeFi to the $Doge Community. This provides $Dogechain holders with more utility than simply holding their coins and waiting for them to increase in value.
Even though it is described as a Layer 2 network, it isn’t truly the case as DogeCoin is built in a separate network on Polygon Edge, one of the most popular Ethereum layer 2.
Rank #501
Marcetcap 32 Million
I add to my public portfolio
Best regards EXCAVO

CASPER CSPR CASPER super hype project that showed at ATH 341.29x is now trading at such a price from the public round:
$ 0.03 ROI -1.34x (+34.2%)
$ 0.02 ROI -2.01x (+101.3%)
$ 0.015 ROI -2.68x (+168.5%)
For the public round, all the coins are already on the market. and so we see this rally
I want to catch some movement over the next few weeks while we have a good drive in the market
Best regards EXCAVO

Hashflow HFTTokenomics similar with Aptos - working scheme for price manipulation.
We can see a beautiful exit from the soldering wedge and movement to the $1+ zone
I'm not getting my hopes up, but I've added to my portfolio
Best regards EXCAVO

SP-500 - Banking crisisYou might have wondered about the past ~400 days in the financial market, especially in the US and Europe. Numerous commentaries and opinions have been shared across business-related media regarding interest rates, inflation, oil prices, war, etc. Trust me; you are not alone! Even the most distinguished economic Nobel prize winners have yet to learn why the economic indicators are still stable with so many factors in place. You might have heard of the recent banking failure in the US and Switzerland and that the banking system is so strong that nothing similar to 2008 would happen. But you have yet to hear that this time is expected to be worse!!
Milad opinion:
In the next 40 days, till the first week of May, we will see multiple failures in the financial system and corporates with weak management, and we will see the tight unemployment rate finally cracking up. But this will be just the beginning of many failures to come.
To explain this more clearly, in the past 15 years, we have seen a secular bull market that has pomped the asset prices to a level never seen before, leading to an everything bubble. As a result, we have seen the tech sector and related assets grow to an unsustainable level, and housing prices soar. But this fast growth has come to an end, and in the next 40 days, we will see a downfall of significant indexes to at least 30% to begin with, resulting in a tough landing.
The bases are as follows:
The banking crisis of 1907 and 2008 indicate a massive downfall of 30% or more, starting shortly after banks' failures.
As the Fed Chairman touched on in today's Q&A, the credit market is falling, starting from Credit Swiss, and will be tightened further. This could threaten the housing market, which is already unstable.
The 1974, 2002, and 2008 crashes indicate that the final drop should occur here. The downfall for SP500 shows 30% to 41% drop in the next 40 days.
A historical unemployment rate study indicates a sudden jump in the following two readings.
The bond market inversion (10s-2s) and (10s-3months) indicate that the recession is very close.
Analyst Sentiment Measure of earnings among US companies indicates an extreme reading is coming, which means a significant drop in earning expectations.
Leading Economic Indicator (LEI) alarms for immediate recession.
ISM New orders Leading also indicates an immediate recession.
What's next?
You can see in recent weeks, the SEC has been questioning different comaniyas, cryptocurrency companies, and people.
The regulation of the cryptocurrency market has begun, next is the takeover or liquidation of private banks in favor of the central bank. Then CBDC - FEDnow Starts in June-July.
P.S if this prediction comes true, there will be a storm in cryptocurrency, and a drop below 16 is possible, I just keep it in mind.
And it will look something like this
Write your comments, send them to your friends, I really want to know your thoughts.
Thank you MIlad
Best regards EXCAVO

BIT DAOIt can be interpreted as an inverted head and shoulders pattern, also we see a potential trend break. I have two entries, one at 0.543 and a limit order below 0.46
Best regards EXCAVO

Hashflow ( HFT )Hashflow ( HFT ) is a decentralized exchange (DeFi) that supports interconnectivity.
It can connect users with professional market makers and is designed to provide:
-zero slippage,
- no intermittent losses,
- inter-network exchange without bridges.
- low GAS commission,
- a MEV-proof trading experience.
MEV is a way for validators to make additional profits by changing the order of transactions before approving a new block in the network. See link for details.
Hashflow currently supports public networks such as Ethereum , Avalanche, Polygon, Arbitrum, Optimism and BNB.
What's unique about Hashflow?
Most DEXs rely on automated market makers (AMMs) to provide buy and sell assets, and while they are important, they are far from perfect. AMMs are inefficient from a capital perspective, are usually subject to risks such as sandwich attacks and non-permanent losses, and cannot price non-spot assets.
Using a Request for Quotes (RFQ) model that allows professional market makers to manage liquidity pools, Hashflow solves these problems.
What it means for market makers
Hashflow allows market makers to obtain liquidity and value assets using off-network pricing functions backed by cryptographic signatures.
By moving pricing offline, market makers can use more sophisticated pricing strategies that take into account offline data, such as historical asset prices, volatility , and other real-world information that allows them to effectively price assets.
What this means for traders
By moving pricing functions off-network, traders gain the following benefits:
Better pricing.
Off-network pricing results in tighter quotes, which gives traders a greater return on their money spent.
Zero slippage.
All Hashflow quotes are executed at the displayed price.
MEV resistance
Cryptographic signatures make outperformance impossible. Traders can keep what they earn.
Cross-network exchanges without bridges
Traders can seamlessly exchange assets between blockchains within minutes without the need for external bridges, while taking advantage of all the benefits described above.
How Hashflow works
The user connects their wallet to Hashflow, enters the amount they would like to exchange, and then a quote is displayed to them.
If the user agrees, the order is sent and that transaction is verified and added to the Hashflow network.
On the other hand, there are market makers who are in the business of issuing quotes that the user has already accepted.
The market maker then signs the transaction and it is executed without slippage. Unlike other DEXs, which typically have an AMM (Automated Market Maker) that handles market making and asset pricing on the blockchain using deferred liquidity provisioning, Hashflow works the same way as an order book mechanism.
Pricing is done outside the blockchain, but trading is done inside the blockchain.
Total invested: $28,200,000
Tokenomics
HFT's total offering will be 1,000,000,000,000 (one billion tokens).
Allocations:
19.32% (193,200,000,000 HFT ) to the Core Team
25% (250,000,000 HFT ) to Early Investors
2.5% (2,500,000 HFT ) for Future Hires
53.18% (531,800,000 HFT ) for Ecosystem Development as follows:
18.54% to Ecosystem Partners
13.08% to Community Rewards (NFTs + Rake the Rewards + Exchange Distribution)
9.54% for Future Community Rewards
7.50% to Designated Market Maker Loans
2.52% to Vendors and Early Service Providers
1.00% to the Community Treasury
1.00% for Hashverse Rewards
Tokenomics link
Allocation and Distribution
Investment and pricing for funds
The project raised $28.2 million in three rounds, with 25% of the tokens sold at:
1. $0.02 per HFT (160 million tokens),
2. $0.10 per HFT (27.5 million tokens),
3. $0. 40 per HFT (62.5 million tokens).
dropstab.com
Token distribution and what investors will earn
Investors
A page with a token distribution chart, see the link.
Investors have the following token distribution schedule:
25% cliff for 12 months. From the 13th month they will get 25% tokens at once
75% monthly distribution in equal shares for 36 months.
The overall schedule is scheduled for 4 years.
It turns out that investors will not receive anything for a year.
Let's look for where else investors, in a big way, can earn.
About 9.5% HFT , will be distributed:
1. trading rewards
2. Rewards for market makers.
3. Rewards for liquidity providers. Approximately 20% APY annual return (i.e. including reinvestment). These are very approximate values, see current pools and their returns.
HFT distributions to traders, LPs and market makers, will eventually be subject to DAO approval once they are launched.
How many tokens will investors receive as liquidity providers?
Let's make the assumption that locked tokens will be available for investors to add to liquidity pools.
The approximate return for liquidity providers is 20% APY, which is about 18.4% APR
$0.02 per HFT (160 million tokens),
A year will get 29.4 million tokens, a month 2.45 million tokens
$0.10 per HFT (27.5 million tokens),
In a year, they will get 5.06 million tokens, in a month 0.42 million tokens
$0. 40 per HFT (62.5 million tokens).
They will get 11.5 million tokens per year, 0.96 million tokens per month
Best regards EXCAVO

For all those who want to short bitcoinAs I said in the previous post, this is what happened and I expect the same scenario.
I think the year will be very volatile, first half a year up then down.
Now many people didn’t get on yesterday’s pump, they will start entering and there will probably be a correction on altcoins for the next few days
For all those who want to short bitcoin . you will not take big moves, stop losses and liquidations will be fuel for growth. So until April don't even think about your genius and great short. Save your nerves, your hair and your deposit
Best regrads EXCAVO

GALAUSDTP LONG0.053 is the major support
target is 0.062
when a mechanical engineer become a trader ..

10 Potential Trends 2023 by EXCAVOPotential trends and my thoughts on the future
- 1. Increased Crypto Regulation
2. I'll start by explaining what L0, L1, L2, and L3 are:
L1 - Transactions
L2 - Closing problems of L1
L3 - Applications/Infrastructure for Applications
L0 - Cross-chain infrastructure
*L1 solution cannot be fast, scalable, and decentralized at the same time.
Protocols L1:
Ethereum (ETH)
Toncoin (TON)
Solana (SOL)
Near (NEAR)
New L1 Solutions :
Aptos
Sui
Canto
Fuel
Shardeum
Quai
Linera
Sei
Disadvantages of the New L1
ETH dominance
Past failures of "new" L1
Interest in LAYER L2 solutions
LAYER 2 - a protocol deployed on top of the main blockchain (Layer 1) is needed to increase the scalability of L2 - solutions are used for popular blockchain platforms with low bandwidth, such as Ethereum and Bitcoin
Pay attention to:
Arbitrum
Optimism
Polygon
zkSync
Fuel Labs
Advantages:
Ethereum is the most popular ecosystem
Developed infrastructure
Request for scaling
Disadvantages:
Risk of vulnerabilities
The problem of mass adoption
Key challenges:
Attraction of liquidity
Competition
Layer 0
Cosmos, Polkadot, Avalanche, Cardano
3 . Exchange tokens also remain interesting for market participants; some exchanges leave while others remain and they see opportunities for customer growth and platform development. I would like to highlight several exchanges that are now actively working to become top exchanges:
Okex
Bitget
Wootrade
If I missed any exchange, please write in the comments
4. For potential trends, pay attention to the simplification of financial interactions, new types of fundraising, DeFi of the second and third generations, WEB3 is not yet used in a large part of the cryptocurrency market. Remember something that was very hyped in the past but has not yet been transferred to a decentralized plane, such as with ICO/IDO like IPO, as as well as NFTs like Bearbrick and KAWS. Look for a super idea or potential fierce hype.
5. DeFi will continue to develop, and from the future leaders, I think there will be projects such as:
dYDX
Lido
Uniswap
Maker
Curve
Advantages:
Request for decentralization
Ecosystem support
High profitability in terms of business
Disadvantages:
Regulatory risks from the US
Higher entry threshold than CEX
Hacking attacks
Key challenges:
Stimulation systems
Competition
6. At the end of last year, I began to look very closely at the Chat GPT platform, of course, it made me look at what is happening and the future of the world in a different way. And a few days ago, a list of crypto projects related to AI (AI) was published:
coinmarketcap.com
dropstab.com
Many began to write about the potential trend in this direction at the next Bull Run. And this is certainly the case. Any trend starts like this. But I want to note that there are already plenty of projects working with Big Data - DYOR
7. Proof of Physical Work consensus
I wrote in a previous post
8. Wallets
Due to the mass distrust of centralized exchanges, wallets will gain popularity in this cycle, this hype will be facilitated by the release of the metamask token.
As for me, I use several cold wallets and I really like mobile phone wallets such as C98, Safepal, and Trustwallet.
9. Social media
Decentralized social networks are a potential new boom:
DeSo, Nation, Farcaster, Lens Protocol, Braintrust , and so on are some examples to look out for.
Centralized social networks
Potentially, each social network (Twitter, Facebook, Instagram, Telegram) will have a direct sending of cryptocurrencies. It looks like this, stablecoin issuers are already working on implementation. This will be the next trigger and stage of adoption, which will mark the new BullRun of the cryptocurrency market, after which we will see a global restructuring of the TOP 50
The main IT giants are Apple and Google - they have been preparing to enter the cryptocurrency market for 2 years. They will be able to take the cryptocurrency industry to the next level, but I think it will not be in this cycle
10. AAA Blockchain Games
....will continue to be developed
I communicate very well with the project team, see for yourself how cool it is
www.youtube.com
I will say more, I have already played the beta version
It is also important to note that all investments come with some level of risk and even the most promising projects and trends can have unforeseeable challenges and obstacles. It is always important to conduct a thorough analysis of any investment opportunity and understand the level of risk involved before making a decision. Never invest more than you can afford to lose and always be mindful of the long-term potential of any investment.
As a final note, it is also important to keep in mind the importance of regulations and compliance in the financial markets. The crypto and blockchain space is still largely unregulated and many projects and trends may fall foul of legal and regulatory requirements. It is important to stay up-to-date with any changes in laws and regulations in the countries you are operating or investing in.
I hope this information has been helpful in providing some context and guidance when it comes to trends and developments in the financial markets, and a deeper understanding of the crypto and blockchain space. Remember, it is essential to conduct your own research and make your own decisions based on your financial goals and risk tolerance.
If I missed any trend write it in the comments
Best regards EXCAVO

Proof of Physical Work consensusA new concept of Proof of Physical Work consensus
Proof of Physical Work protocol encapsulates real-world use cases.
The blockchain protocol rewards users for performing verifiable physical work like deploying a 5G hotspot etc.
As examples of similar projects
Wireless Network:
Hellium
Pollen mobile
Provide token rewards to participants (hotspot operators) to provide network coverage for IoT and 5G.
Mobility
Hivemapper
Dimo
This is a decentralized map built by participants using dashcams, while DIMO Network users can earn rewards for connecting a hardware device to their car and contributing that data to the network
Environmental:
PlanetWatch -is striving to build a global air quality monitoring network to identify pollution hotspots and the community members can earn rewards for their efforts.)
Weather
Compute & Storage
Filecoin
arweave
livepeer
RNDR
Filecoin boasts of a decentralized storage network. It provides a powerful source of low-cost distributed cloud storage, where contributors provide storage space on their machines and get rewarded in return. Arweave is similar to Filecoin in decentralized storage functionality, except that the former is focused on the problem of long-term data storage.
I think that a full-fledged category of this Proof of Physical work will appear soon, this is what is really needed for Web3.0, this is a real connection with the physical world. And the IoT (Internet of things) will move into this category - Proof of Physical work

Mimblewimble, Litecoin's newest network Mimblewimble, Litecoin's newest network upgrade activates on the 19th of May 2022
We look at the logarithmic chart
LTCBTC is trading near the lower support line of the descending channel, against the backdrop of good news, I expect a rebound to the middle line of the channel, and possibly even to the channel resistance line.
Current LTC price 70$
Best regards EXCAVO

Bitcoin 2018 and 2022Hello friends!
Looking at Bitcoin, I remember the end of 2018. When the daily volatility was + -1%. I found a lot of similar patterns by analyzing the chart. I am sure that the movement will not be identical, with a high degree of probability, we can see a short squeeze in the next 2 weeks, and after - a dive below 18 is possible. 13-14k - strong support zone.
Best regards,
EXCAVO

Bitcoin capitulationWhat we need to start an uptrend: breaking through the resistance line = trend reversal and the end of the bearish trend, which lasts more than 50 weeks, as I said in the previous global chart.
Judging from the logarithmic chart, we are breaking through the global support zone and there will be a panic in the market, perhaps not only in the crypto market. We are approaching the support line of a large ascending channel.
It will be accompanied by cascading, avalanche-forced liquidations of the long positions, the bankruptcy of funds, and so on.
We are coming close to the zone of our positions.
There is a possibility that the manipulator (exchanges) will make a short squeeze with a fake breakout of the resistance line before falling. They will collect liquidity from both sides, as it was in 2018 before the fall from 6 to 3.
The scenario fits the Wyckoff and Elliott concept.
Best regards, EXCAVO

Bitcoin Monthly chartWe see a lot of supports in the area of 11-14K. Also, there are large volumes around 9K that the price can touch by some long squeeze. We need just a reason to panic.
The way to make money is to buy when blood is running in the streets
Best regards EXCAVO

Wyckoffian logicWhen you understand the Wyckoffian phases of the market, you can determine when to be in or out of the market. You begin to understand how the large accounts determining market the trend, change of trend and price action.
Wyckoff Phases of Accumulation
Phase A: In phase A, supply has been dominant and it appears that finally the exhaustion of supply is becoming evident. The approaching exhaustion of supply or selling is evidenced in preliminary support (PS) and the selling climax (SC) where a widening spread often climaxed and where heavy volume or panicky selling by the public is being absorbed by larger professional interests. Once these intense selling pressures have been expressed, and automatic rally (AR) follows the selling climax. A successful secondary test on the downside shows less selling that on the SC and with a narrowing of spread and decreased volume. A successful secondary test (ST) should stop around the same price level as the selling climax. The lows of the SC and the ST and the high of the AR set the boundaries of the trading range (TR). Horizontal lines may be drawn to help focus attention on market behavior.
It is possible that phase A will not include a dramatic expansion in spread and volume. However, it is better if it does, because the more dramatic selling will clear out more of the sellers and pave the way for a more pronounced and sustained markup.
Where a TR represents a reaccumulation (a TR within a continuing up-move), you will not have evidence of PS, SC, and ST. Instead, phase A will look more like phase A of the basic Wyckoff distribution schematic. Nonetheless, phase A still represents the area where the stopping of the previous trend occurs. Trading range phases B through E generally unfold in the same manner as within an initial base area of accumulation.
Phase B: The function of phase B is to build a cause in preparation for the next effect. In phase B, supply and demand are for the most part in equilibrium and there is no decisive trend. Although clues to the future course of the market are usually more mixed and elusive, some useful generalizations can be made.
In the early stages of phase B, the price swings tend to be rather wide, and volume is usually greater and more erratic. As the TR unfolds, supply becomes weaker and demand stronger as professionals are absorbing supply. The closer you get to the end or to leaving the TR, the more volume tends to diminish. Support and resistance lines usually contain the price action in phase B and will help define the testing process that is to come in phase C. The penetrations or lack of penetrations of the TR enable us to judge the quantity and quality of supply and demand.
Phase C:In phase C, the stock goes through testing. It is during this testing phase that the smart money operators ascertain whether the stock is ready to enter the markup phase. The stock may begin to come out of the TR on the upside with higher tops and bottoms or it may go through a downside spring or shakeout by first breaking previous supports before the upward climb begins. This latter test is preferred by traders because it does a better job of cleaning out the remaining supply of weak holders and creates a false impression as to the direction of the ultimate move.
A spring is a price move below the support level of a trading range that quickly reverses and moves back into the range. It is an example of a bear trap because the drop below support appears to signal resumption of the downtrend. In reality, though, the drop marks the end of the downtrend, thus trapping the late sellers, or bears. The extent of supply, or the strength of the sellers, can be judged by the depth of the price move to new lows and the relative level of volume in that penetration.
Until this testing process, you cannot be sure the TR is accumulation and hence you must wait to take a position until there is sufficient evidence that markup is about to begin. If we have waited and followed the unfolding TR closely, we have arrived at the point where we can be quite confident of the probable upward move. With supply apparently exhausted and our danger point pinpointed, our likelihood of success is good and our reward/risk ratio favorable.
Phase D:If we are correct in our analysis and our timing, what should follow now is the consistent dominance of demand over supply as evidenced by a pattern of advances (SOSs) on widening price spreads and increasing volume, and reactions (LPSs) on smaller spreads and diminishing volumes. If this pattern does not occur, then we are advised not to add to our position but to look to close out our original position and remain on the sidelines until we have more conclusive evidence that the markup is beginning. If the markup of your stock progresses as described to this point, then you’ll have additional opportunities to add to your position.
Your aim here must be to initiate a position or add to your position as the stock or commodity is about to leave the TR. At this point, the force of accumulation has built a good potential as measured by the Wyckoff point-and-figure method.
In phase D, the markup phase blossoms as professionals begin to move into the stock. It is here that our best opportunities to add to our position exist, just as the stock leaves the TR.
Phase E: Depicts the unfolding of the uptrend; the stock or commodity leaves the trading range and demand is in control. Sell offs are usually feeble.
Wyckoff Accumulation Events
PS: Preliminary support, where substantial buying begins to provide pronounced support after a prolonged down-move. Volume increases and price spread widens, signaling that the down-move may be approaching its end.
SC: Selling climax, the point at which widening spread and selling pressure usually climaxes, as heavy or panicky selling by the public is being absorbed by larger professional interests at or near a bottom. Often price will close well off the low in a SC, reflecting the buying by these large interests.
AR: Automatic rally, which occurs because intense selling pressure has greatly diminished. A wave of buying easily pushes prices up; this is further fueled by short covering. The high of this rally will help define the upper boundary of an accumulation TR.
ST: Secondary test, in which price revisits the area of the SC to test the supply/demand balance at these levels. If a bottom is to be confirmed, volume and price spread should be significantly diminished as the market approaches support in the area of the SC. It is common to have multiple STs after a SC.
Shakeouts: (and or Springs) usually occur late within a TR and allow the stock’s dominant players to make a definitive test of available supply before a markup campaign unfolds. A “spring” takes price below the low of the TR and then reverses to close within the TR; this action allows large interests to mislead the public about the future trend direction and to acquire additional shares at bargain prices. A terminal shakeout at the end of an accumulation TR is like a spring on steroids. Shakeouts may also occur once a price advance has started, with rapid downward movement intended to induce retail traders and investors in long positions to sell their shares to large operators. However, springs and terminal shakeouts are not required elements..
Test: Large operators always test the market for supply throughout a TR (e.g., STs and springs) and at key points during a price advance. If considerable supply emerges on a test, the market is often not ready to be marked up. A spring is often followed by one or more tests; a successful test (indicating that further price increases will follow) typically makes a higher low on diminished volume.
SOS: Sign of strength, a price advance on increasing spread and relatively higher volume. Often a SOS takes place after a spring, validating the analyst’s interpretation of the prior price action.
LPS: Last point of support, the low point of a reaction or pullback after a SOS. Backing up to an LPS means a pullback to support that was formerly resistance, on diminished spread and volume. On some charts, there may be more than one LPS, despite the ostensibly singular precision of this term.
BU: Back-up. This term is short-hand for a colorful metaphor coined by Robert Evans, one of the leading teachers of the Wyckoff method from the 1930s to the 1960s. Evans analogized the SOS to a “jump across the creek” of price resistance, and the “back up to the creek” represented both short-term profit-taking and a test for additional supply around the area of resistance. A back-up is a common structural element preceding a more substantial price mark-up, and can take on a variety of forms, including a simple pullback or a new TR at a higher level.
Wyckoff Phases of Distribution
Phase A: In Phase A, demand has been dominant and the first significant evidence of demand becoming exhausted comes at preliminary supply (PSY) and at the buying climax (BC). It often occurs in wide price spread and at climactic volume. This is usually followed by an automatic reaction (AR) and then a secondary test (ST) of the BC, usually upon diminished volume. This is essentially the inverse of phase A in accumulation.
As with accumulation, phase A in distribution price may also end without climactic action; the only evidence of exhaustion of demand is diminishing spread and volume.
Where redistribution is concerned (a trading range within a larger continuing down-move), you will see the stopping of a down-move with or without climactic action in phase A. However, in the remainder of the trading range (TR) for redistribution, the guiding principles and analysis within phases B through E will be the same as within a TR of a distribution market top.
Phase B: The building of the cause takes place during phase B. The points to be made here about phase B are the same as those made for phase B within accumulation, except clues may begin to surface here of the supply/demand balance moving toward supply instead of demand.
Phase C: One of the ways phase C reveals itself after the standoff in phase B is by the sign of weakness (SOW). The SOW is usually accompanied by significantly increased spread and volume to the downside that seem to break the standoff in phase B the SOW may or may not “fall through the ice,” but the subsequent rally back to a “last point of supply” (LPSY), is usually unconvincing for the bullish case and likely to be accompanied by less spread and/or volume.
Last point of supply gives you your last opportunity to exit any remaining longs and your first inviting opportunity to exit any remaining longs and your first inviting opportunity to take a short position. An even better place would be on the rally that tests LPSY, because it may give more evidence (diminished spread and volume) and/or a more tightly defined danger point.
An upthrust is the opposite of a spring. It is a price move above the resistance level of a trading range that quickly reverses itself and moves back into the trading range. An upthrust is a bull trap — it appears to signal a start of an uptrend but in reality marks the end of the up-move. The magnitude of the upthrust can be determined by the extent of the price move to new highs and the relative level of volume in that movement.
Phase C may also reveal itself by a pronounced move upward, breaking through the highs of the trading range. This is shown as an upthrust after distribution (UTAD). Like the terminal shakeout in the accumulation schematic, this gives a false impression of the direction of the market and allows further distribution at high prices to new buyers. It also results in weak holders of short positions surrendering their positions to stronger players just before the down-move begins. Should the move to new high ground be on increasing volume and relative narrowing spread, and price returns to the average level of closes of the TR, this would indicate lack of solid demand and confirm that the breakout to the upside did not indicate a TR of accumulation, but rather a formation of distribution.
Successful understanding and analysis of a trading range enables traders to identify special trading opportunities with potentially very favorable reward/risk parameters. When analyzing a trading range, we are first seeking to uncover what the law of supply and demand is revealing to us. However, when individual movements, rallies, or reactions are not revealing with respect to supply and demand, it is important to remember the law of effort versus result. By comparing rallies and reactions within the trading range to each other in terms of price spread, volume, and time, additional clues may be discovered as to the stock’s strength, position, and probable future course.
It will also be useful to employ the law of cause and effect. Within the dynamics of a trading range, the force of accumulation or distribution gives us the cause and the potential opportunity for substantial trading profits. The trading range will also give us the ability, with the use of point-and-figure charts, to project the extent of the eventual move out of the trading range and will help us determine if those trading opportunities favorably meet or exceed our reward/risk parameters.
Phase D: Phase D arrives and reveals itself after the tests in phase C show us the last gasps or the last hurrah of demand. In phase D, the evidence of supply becoming dominant increases either with a break through the ice or with a further SOW into the trading range after an upthrust.
In phase D, you are also given more evidence of the probable direction of the market and the opportunity to take your first or additional short positions. Your best opportunities are at rallies representing LPSYs before a markdown cycle begins. Your legging in of the set of positions taken within phases C and D represents a calculated approach to protect capital and maximize profit. It is important that additional short positions be added or pyramided only if your initial positions are in profit.
Phase E: Depicts the unfolding of the downtrend; the stock or commodity leaves the trading range and supply is in control. Rallies are usually feeble.
Wyckoff Distribution Events
PSY: Preliminary supply, where large interests begin to unload shares in quantity after a pronounced up-move. Volume expands and price spread widens, signaling that a change in trend may be approaching.
BC: Buying climax, during which there are often marked increases in volume and price spread. The force of buying reaches a climax, and heavy or urgent buying by the public is being filled by professional interests at prices near a top. A BC often occurs coincident with a great earnings report or other good news, since the large operators require huge demand from the public to sell their shares without depressing the stock price.
AR: Automatic reaction. With demand substantially diminished after the BC and heavy supply continuing, an AR takes place. The low of this selloff helps define the lower boundary of a distribution TR.
ST: Secondary test, in which price revisits the area of the BC to test the demand/supply balance at these price levels. If a top is to be confirmed, supply will outweigh demand, and volume and spread should decrease as price approaches the resistance area of the BC. A ST may take the form of an upthrust (UT), in which price moves above the resistance represented by the BC and possibly other STs, then quickly reverses to close below resistance. After a UT, price often tests the lower boundary of the TR.
SOW: Sign of weakness, observable as a down-move to (or slightly past) the lower boundary of the TR, usually occurring on increased spread and volume. The AR and the initial SOW(s) indicate a change of character in the price action of the stock: supply is now dominant.
LPSY: Last point of supply. After testing support on a SOW, a feeble rally on narrow spread shows that the market is having difficulty advancing. This inability to rally may be due to weak demand, substantial supply or both. LPSYs represent exhaustion of demand and the last waves of large operators’ distribution before markdown begins in earnest.
UTAD: Upthrust after distribution. A UTAD is the distributional counterpart to the spring and terminal shakeout in the accumulation TR. It occurs in the latter stages of the TR and provides a definitive test of new demand after a breakout above TR resistance. Analogous to springs and shakeouts, a UTAD is not a required structural element: the TR in Distribution.
AR - Automatic rally or reaction
BC - Buying Climax
BOI - Backing upto ice
BTI - Breaking the ice
BUEC - Backup to edge of creek
CREEK - Critical support
FTI - First time over ice
ICE - Critical resistance
JAC - Jumping across the creek (or JOC)
LPS - Last point of Support (Demand)
LPSY - Last point of Supply
MD - Mark down
MU - Mark up
PS - Preliminary support (Demand)
PSY - Preliminary supply
SOS - Sign of strength
SOW - sign of weakness
ST - Secondary test
TSO - Terminal shake out (Spring)
TUT - Terminal thrust
UTAD - Up thrust after distribution
SC - Selling Climax
TR - Trading Range
UT - Up thrust
Best regards
EXCAVO

Wyckoff Method #2 Distribution Schematic
What is the Wyckoff Method? #2 Distribution Schematic
👇👇👇
I am waiting for this pattern to complete in November, before that anything can happen, the bear market is usually long and exhausting
I follow my analysis
1)
2)
I am waiting for this pattern to complete in November, before that anything can happen, the bear market is usually long and exhausting
I started posting less, quality is better than quantity.
If you have questions for me or ideas that you want to share, I'm waiting for you in the comments.
Best regards EXCAVO

Bitcoin HashrateI paid attention to the Bitcoin Network Hashrate.
It seems that the fall has not even passed into the active phase.
Industrial private miners are still hoping for price recovery and do not turn off their equipment.
People bought many ASIC miners for tons of credit money.
BTC Hashrate = -27% after the shutdown of miners in Texas.
Best regards EXCAVO

Bitcoin - large falling wedgeThe price on the daily timeframe is moving in a falling wedge. The lower timeframes show downward price compression and liquidity in the $29300-29200 zone. Important next levels and zones: $28850-28650, $28050-28000, $26700. There are many stop-losses of the different caliber of traders behind these levels. There is a high probability that we will harvest it all. It is the road to $20,000. The horizontal volume levels are on the verge of the abyss. Support around $30000 is significant, but if the price breaks through the nearest liquidity zones - the path to $20000 will be almost inevitable, or even lower with some squeeze. After testing $20,000, I expect the price to return to the zone of maximum vertical volume - about $40,000 before the end of 2022.
Best regards,
EXCAVO

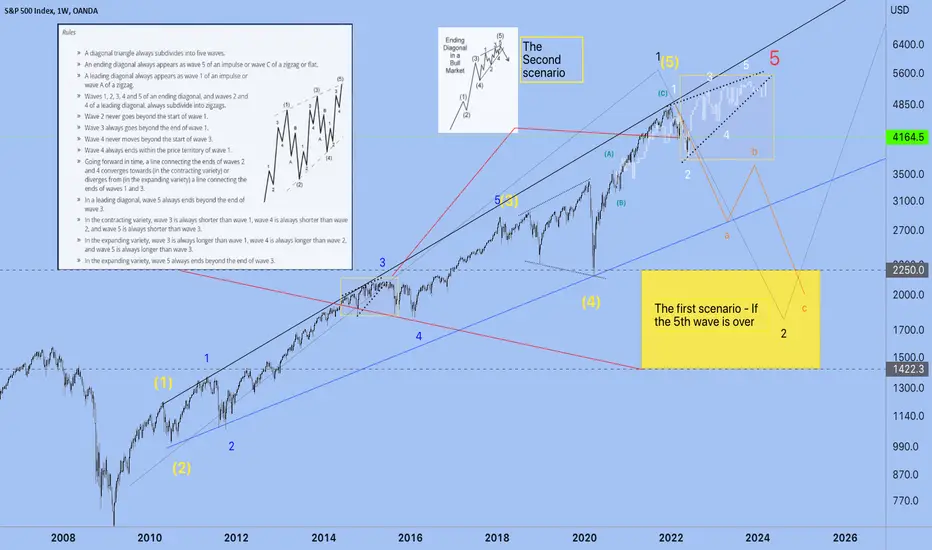
Two scenarios for the S&P500 index for 2022-2023
More theory
A diagonal triangle is always subdivided into five waves.
An ending diagonal always appears as wave 5 of an impulse or wave C of a zigzag or flat.
A leading diagonal always appears as wave 1 of an impulse or wave A of a zigzag.
Waves 1, 2, 3, 4, and 5 of an ending diagonal, and waves 2 and 4 of a leading diagonal, always subdivide into zigzags.
Wave 2 never goes beyond the start of wave 1.
Wave 3 always goes beyond the end of wave 1.
Wave 4 never moves beyond the start of wave 3.
Wave 4 always ends within the price territory of wave 1.
Going forward in time, a line connecting the ends of waves 2 and 4 converges towards (in the contracting variety) or diverges from (in the expanding variety) a line connecting the ends of waves 1 and 3.
In a leading diagonal, wave 5 always ends beyond the end of wave 3.
In the contracting variety, wave 3 is always shorter than wave 1, wave 4 is always shorter than wave 2, and wave 5 is always shorter than wave 3.
In the expanding variety, wave 3 is always longer than wave 1, wave 4 is always longer than wave 2, and wave 5 is always longer than wave 3.
In the expanding variety, wave 5 always ends beyond the end of wave 3.
Best regards EXCAVO
Bitcoin first green candle in Weekly chart Finally, we have the first green weekly candle in 10 weeks. It interrupted nine weeks of falling.
Like last Monday, the day starts with a green impulse candle. Remember that such sharp movements correlate with the emotions of traders in the current phase of the market. For example, look at what's left of last week's momentum. Do not rush to jump into the market if it is a medium or short-term trade. It is worth waiting for the price fixation above the $32,500 level to confirm some local reversal.
The prices for long-term investment are attractive if you look more globally now. Judging by the SOPR (Spent Output Profit Ratio) metric, the level of the capitulation of long-term BTC holders is entering the extremum zone. When it was in this zone, the formation of the cycle bottom usually began based on experience.
It does not mean that we should start growing from the current prices. On the contrary, we can go even lower, but this indicator suggests that the long-term bottom may already be somewhere nearby, and its formation can take more than one or two months. It is worth being patient. We recommend the DCA (Dollar-cost averaging) strategy for investing. It is a strategy where an investor invests a total sum of money in small increments step-by-step (over time) instead of all at once. The goal is to take advantage of market downturns without risking too much capital at any given time.
Best regards,
EXCAVO
