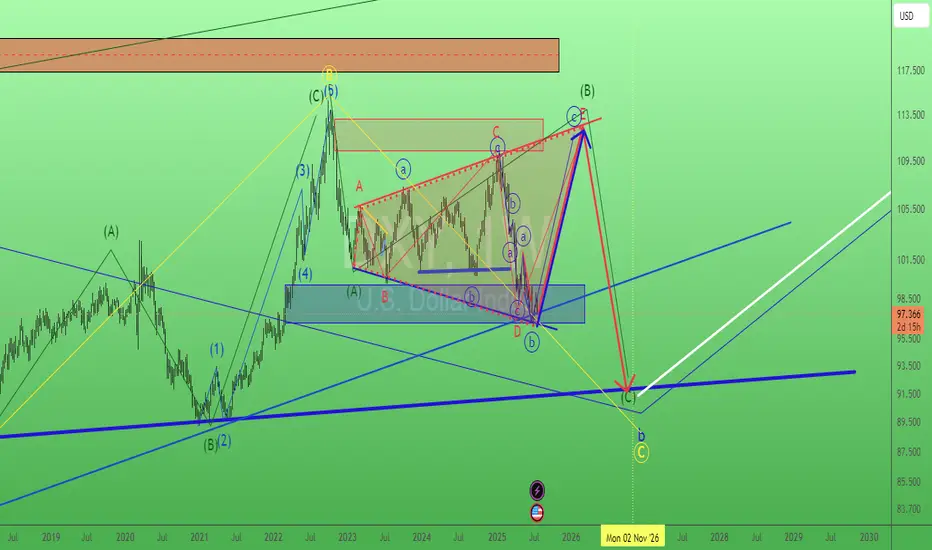
Dollar. When King of cash said : I'm still the king. 23/July/25DXY. when Dollar = the king of cash said : "Cash is King!" AND as a King of cash I'm RECLAIMING MY CROWN.. What will happen to "all equities market? e.g Stocks, Gold or even Bitcoin?
Expandingtriangle
SP500 rock & roll with Trump.. 4/July/25SPX500 breaking ATH again are we in bullish stage? Or again Donald Trump "Inviting" us come to his WWE stage for his favourite "wrestling" games.. Jumping up and down or up side down.( expanding triangle) ......

Ultracemco , 1W , Bullish As Ultracemco is Formed pattern and giving Breakout Now , Watch Carefully after Weekly Confirmation and Take Trade and follow proper Position Sizing and Risk according to your account size
follow for More Swing Ideas like this

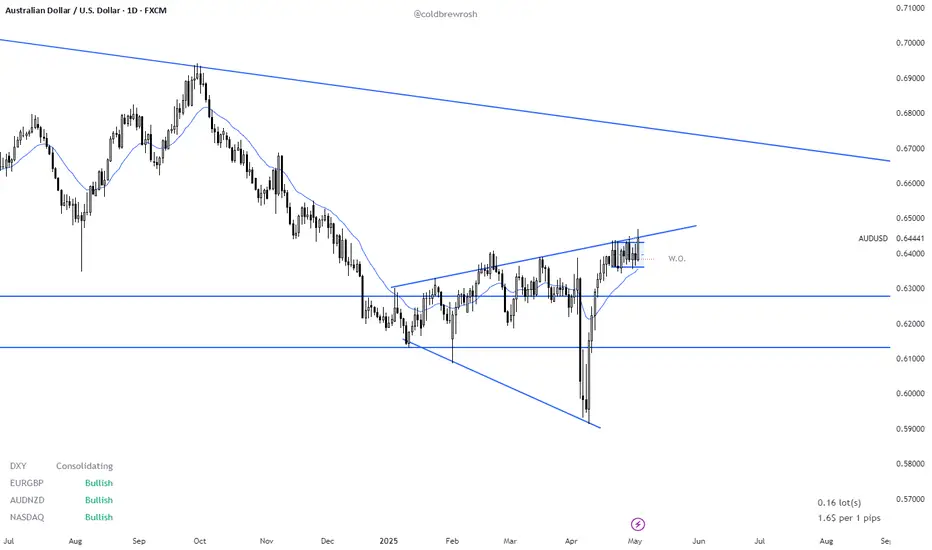
AUD/USD, Are Bull Set for a Breakout ?This analysis dates from the 3rd of May, this is in no way financial advice and should be taken into account in an objective way. Make your own opinion about it, don't take it for granted.
- AUD/USD is trading around the 0.64000 area on the daily chart, it has been consolidating around that area since April 21st following a 7 consecutive bull rally. Where it is heading to next still needs to be determined. Nevertheless, there is a clear Expanding Triangle dating since the start of 2025. (see image attached),(13th January, 03rd of Feb, 09th of April for the lower bar and 27 January, 20th Feb, 17th March, 23rd of April for the upside channel).
- This expanding triangle is similar to the one identified on NZD/USD which had an upside breakout and is now consolidating around the 0.59200.
- Whether there is an upcoming BO on Aussie Dollar is still TBT, but odds slightly favor the bulls following the strong rally in the first half of April. Nevertheless, it has been trading in a trading range since April 21st and there are no confirmed breakout yet. Needs to be closely watched in the coming days!! If bulls manage to get consecutive strong bull bars, this could set the stage for an measured move up for at a minimum a test of the 0.66000 area (downside channel from Feb 2021 to Nov 2024 on the Monthly).
- The Bear reversal case is harder to argue for, as they only managed to get one strong bear bar (04th April), with no follow through selling, The market has been trading for longer on the upper bracket of the extending triangle which means the market participant agree more on higher prices. Stay tuned for further updates !! Peace.
Bitcoin at Resistance: Expanding Triangle Hold=>Last Chance!!!Bitcoin ( BINANCE:BTCUSDT ) is moving in the Resistance zone($104,700-$101,920) , near the upper lines (resistance role) of the Expanding Triangle Pattern , Monthly Resistance(1) , and Time Reversal Zone(TRZ) .
In terms of Classic Technical Analysis , Bitcoin seems to be moving in an Expanding Triangle Pattern during the last 30 days . If the upper line is validly broken, this pattern will be failed.
According to the theory of Elliott waves , it seems that Bitcoin can move in an Expanding Flat(ABC/3-3-5) in the 4-hour time frame . Bitcoin is currently completing microwave 5 of the main wave C . If Bitcoin touches $107,000 , the possibility of this corrective pattern being failed is very high.
I expect Bitcoin to drop to at least $100,000 .
Note: If Bitcoin goes below $107,000, we can expect BTC to make a new All-time High(ATH).
Note: There is also the possibility of Bulltrap formation.
Please respect each other's ideas and express them politely if you agree or disagree.
Bitcoin Analyze (BTCUSDT), 4-hour time frame⏰.
Be sure to follow the updated ideas.
Do not forget to put Stop loss for your positions (For every position you want to open).
Please follow your strategy and updates; this is just my Idea, and I will gladly see your ideas in this post.
Please do not forget the ✅' like '✅ button 🙏😊 & Share it with your friends; thanks, and Trade safe.

BITCOIN Expanding Triangle breakout?Should I be worried and cut my losses because of the war in the Middle East and the impending recession?
For me, no. The lower time frames are full of noise, and if you know your game plan, don’t panic. If you are a long-term investor, that’s fine; if you like to DCA, you’re doing great! What’s important is knowing when to exit.
For me, I'm still bullish unless we break the protected low at GETTEX:48K , because that might be when I need to change my bias.
If you notice the chart, it has retested the expanding triangle three times. I think the fourth retest will be rejected again, but the fifth one will definitely break out.
I think my safe exit will be between $95K and $100K, but we’ll see because we’re not market makers.

Gold's triangle bullish idea. 18/July/24XAUUSD possible forming triangle patten in wave (IV) (blue). P/s Trading is about probability games the only 100% sure things "we can control" is our own risk/money management e.g :- 1) Risk/Reward 2) Position size.

Gold possibility of completed expanding triangle. 10/July/24XAUUSD. Base on its speed z factor and current wave structure, which is a completed 3,3,3,3,3 sub waves in wave B (red). I won't rule out the possibility that we have completed an expanding bearish triangle pattern as previous idea posted on 21 June 24.

Gold possible forming an expanding triangle. 12/June/24XAUUSD possible trending up for wave e ( Blue circled) on an expanding triangle in wave B (red).

GBPCAD - BEARISH MOVE 📉
As We Talked in The Previous Analysis:
The GBPCAD Reached a Strong Resistance Level.
The Price Formed an Expanding Triangle Pattern.
Currently, The Higher Low is Broken.
So, I Predict a Bearish Move📉.
TARGET: 1.69320🎯

GBPCAD - Bearish Expanding Triangle 📉
As We Talked in The Previous Analysis:
The GBPCAD Price Formed an Expanding Triangle Pattern.
The Higher Low is Broken.
Currently:
The Price Pull Back to Important Structure and Formed a Head and Shoulders Pattern.
TARGET: 1.69320🎯

EXPANDING TRIANGLEThe expanding triangle, as its name suggests, is a triangle, but it differs from the other 3 types of triangle patterns which we covered in the previous chapter.
All triangle patterns consist of 2 lines, but in the previous 3 triangles (symmetrical, ascending, descending), the lines were converging, whereas for the expanding triangle, the lines are diverging.

GBPCAD - BEARISH SCENARIO 📉Hello Traders !
On The Daily Time Frame, The GBPCAD Reached a Strong Resistance Level.
The Price Formed an Expanding Triangle Pattern.
Let's Expect The Bearish Scenario:
If The Market Breaks The Higher Low (1.70595 - 1.70440) and Closes Below That,
We Will See a Bearish Move...
TARGET: 1.69320🎯

A good potential for ICID, EgyptWeekly chart, the stock is trading in an expanding triangle, with positive technical indicators RSI and MACD.
After crossing the resistance line (BLUE) - at around 5.7, the target will be 9.38
Below the support line, the stop loss should be considered.

Sidi Kerir Petrochemicals (SKPC) should target 37.7Daily chart, the stock SKPC has been trading in an expanding triangle since May 2023, and it is trending upwards - as supported by the positive MACD and RSI indicators.
Targets are 32, 34, then 37.7
For daily trader, the stop loss below 28.5 should be considered.

Expanding triangle on EURCADA B-wave is possibly morphing into an expanding triangle to be then followed by an upward correction meaning the start of the C-wave which would potentially conclude the corrective phase of the previous downtrend started around mid-july 2020.

AUDUSD Expanding Triangle Pattern BreakoutWe expect further downside on this pair, signalled by the formation of an expanding triangle pattern breakout. We can also see the breakout, close and retest of the price below the key level on lower time frames, further supporting our directional basis. The trend has changed from bullish to bearish.

EURGBP EXPANDING TRIANGLE PATTERNHello Traders,
Today, we're focusing on EUR/GBP. I'm thrilled to share this analysis, especially since I don't often publish such insights.
Let this be the inaugural one.
On its daily chart, EUR/GBP is navigating through the 5th wave within an expanding triangle.
Recent price movements hint at a potential reversal, underscored by the formation of a price action reversal pattern trap. Based on today's candlestick patterns, the price has surpassed the last two bars, signaling bullish momentum.
For those considering entry, stops can be strategically positioned below today's daily candle, aiming for targets along the upper trend line.
This setup is straightforward and easy to follow.
Don't forget to like and follow to ensure you don't miss out on trading opportunities like this one.

GMTUSDTGMTUSDT is in strong bullish trend.
As the market is consistently printing new HHs and HLs.
currently the market is retracing a bit after last HH, which is very healthy retracement level and local support as well. if the market successfully sustain this bullish confluence the next leg high could go for new HH
What you guys think of this idea?

BTC 4h Bear Expanding triangleBTC 4h Bear Expanding triangle
⏰ TimeFrame 4 hours
👉 Bearish Expanding Triangle
👉 Potential drop
👉 Fibo Measure
👉"This is the Way"
✔️Logarithmic (Log) Chart & Fib
✔️ (Log)MACD

TA and BIAS for; STORJUSDTAssessment: EXPANDING TRIANGLE (CONTINUOUS TYPE)
This technical analysis is powered by FIGO TRADER® - The pinnacle of trade
NB:
For best results, ENTRY should be executed at the breakout of chart pattern.

EURJPY EURJPY has formed expanding triangle or we can say a megaphone pattern.
Usually price react extremely well to the support and and resistance of the pattern as we can witness in the pattern.
Currently the price is at the resistance of the pattern , if the price start to continue dropping the next target could be 157.715 followed by 157.192.

USDCAD - NEW BREAKOUT !Hello Traders!
The USDCAD Broke a Strong Daily Resistance Level (1.36023-1.36681)
Currently, This Resistance Level Becomes New Support Level.
So, I Expect a Bullish Move📈
i'm waiting for retest...
-----------
TARGET: 1.37350🎯
___________
if you agreed with this IDEA, please leave a LIKE, SUBSCRIBE or COMMENT!
