BNBUSDT up-to-date potential expanded ending diagonalPotential expanded ending diagonal scenario for this asset. Price action is likely heading downward to made an interesting and profitable 3th wave of the expected bearish impulse wave 3 of that triangle / megaphone hypothetical scene. Key levels for watching on that 30m chart, plus Chaikin Money Flow divergences. Bear flag breakdown expected for soon on 4h chart - linked below.
Expandingtriangle

BITCOIN(BTC) is going to go up
* 4H
The $29500 I kept mentioning in my previous analysis continues to be a strong support zone.
It seems that the expanding triangle pattern is also in progress.
This pattern usually goes up to the top line, so I think it's likely to go up first.
The current downward trend line is also broken, and it is likely to rise unless it breaks the $29,500 mark.
If the $29500 is broken, we need to restructure our strategy.

GBPAUD Expanding Triangle D1
Contracting Triangle w1
Short Now and after Down We gat a Strong Buy Wave 5 And Push Down again
Now we are in wave 4 From (C) looks like (Expanding Triangle) after This We have a last Wave 5 in the limits 1.98200-- 78.6% fibo From wave (D) and Push Down again
have a good luck

TESLA CHART - WEEKLY TIME FRAME The Structure looks good to us, waiting for this instrument to correct and then give us these opportunities as shown on this instrument (Price Chart).
Note: Its my view only and its for educational purpose only. Only who has got knowledge about this strategy, will understand what to be done on this setup. its purely based on my technical analysis only (strategies). we don't focus on the short term moves, we look for only for Bullish or Bearish Impulsive moves on the setups after a good price action is formed as per the strategy. we never get into corrective moves. because it will test our patience and also it will be a bullish or a bearish trap. and try trade the big moves.
we do not get into bullish or bearish traps. We anticipate and get into only big bullish or bearish moves (Impulsive Moves). Just ride the Bullish or Bearish Impulsive Move. Learn & Know the Complete Market Cycle.
Buy Low and Sell High Concept. Buy at Cheaper Price and Sell at Expensive Price.
Keep it simple, keep it Unique.
please keep your comments useful & respectful.
Thanks for your support....
Tradelikemee Academy

BTCUSDT 5th wave downward of an ending diagonalAccording to my wave count, BTCUSDT is finishing an 5th wave expanded in an ending diagonal to complete wave 5 of the actual bearish impulsive wave of this cyclical bear market.

Breakdown from Expanding TriangleFor MDB the structure is called an expanding triangle, its bearish with huge volatile swings. There is enough evidence to assume a break below 224.75 (blue box) will initiate a selloff to at least the yellow box (189-203 range) by next Friday 4/28.
From that momentum it could complete downside target (red box) to as low as 175 before bouncing in early May. However, my point target is 189 - if it holds there, probably a good place to take profits because it will need to test low 200s for rejection before continuing down to 170s.
There has been distribution since Feb. going into the expanding triangle - very volatile here but very tradable.

BTCUSDT Potential Expanding Ending DiagonalBTCUSDT is in a downtrend now to fill the corrective wave-A in a broadening structure, which suggests by the wave count that we are in the terminus of a micro wave-ii, thereby the expected retrace can reach 27750 in the rest of the day, i.e. I'm predicting a extensive wave-(V) in a expanding ending diagonal (broadening wedge formation).

EURUSD NEXT POSSIBLE MOVESEURUSD Forming an Expanding Triangle Structure It Possible for EURUSD to Start Selling Next Week Pls Drop Your Ideas We're All Learning Here

BTC: Same patterns repeatingHello Traders!
Welcome back to another post with analyst Aadil1000x.
Today we can see the patterns are repeating and in both cases, the patterns are forming after the breakout of expanding triangle patterns.
The previous pattern was expanding triangle; if we look whole accumulation period, you will see it is also an expanding triangle pattern.
The market is in a correction phase and soon there will be a breakout of this correction. After the breakout, there will be some reversal pattern and it will be time to jump in for buys. This bullish run will break the resistance at 24K and after that, there will be a nice drop.
Don't forget to hit the like button and follow to stay connected.

XAUUSD : POTENTIAL SHORT ENTRYPotential expanding triangle formed within a downtrend.
A rejection at the third touch will suffice for a short entry.

Apple is near key levelsFirst of all, forgive me to draw so much in this chart but AAPL is on fire and we've to take a close look to price movements because we could see awesome opportunities soon.
We all know AAPL, amazing business, great margins but now suffering some issues with production that can lead to some volatility.
In this chart, you can see:
1. A very big historical bullish channel in grey that give us resistance prices in the 100-110$ level.
2. An amazing expanding triangle unfolding with potential price objective at 100-110$ zone. Take care, I'll explain further this price formation and why it could end at 120 or 115$ the movement.
3. The RED danger zone explained in the idea of few days ago. The break of this support led to -7% returns by now.
4. The small downtrend blue line that was our previous idea. We expected a bullish break that never happened, instead we've seen the break of the danger zone support, so our mind is bearish since then in AAPL. (Please see previous idea to understand this in detail).
5. Some blue lines that are major resistances, the lowest one in the 105-110$ zone. Note that this is also the expected zone of 1 and 2.
Expanding triangle explanation
An expanding triangle is a chart pattern that occurs in a trend and is characterized by a series of higher lows and lower highs. This pattern is formed by two trendlines that converge towards each other as the price moves in a wide range. The upper trendline represents resistance and the lower trendline represents support.
As the price approaches the apex of the triangle, it becomes increasingly volatile, and a breakout is likely to occur. If the price breaks out to the upside, it is a bullish sign and may indicate that the trend will continue higher. If the price breaks out to the downside, it is a bearish sign and may indicate that the trend will reverse.
The consequences of an expanding triangle in the market depend on the direction of the breakout and the strength of the trend leading up to the pattern. If the breakout is strong and the trend is bullish, it may lead to further price increases. If the breakout is weak and the trend is bearish, it may lead to a reversal or consolidation in the price.
By now, we see a wave 3 which is 1,618 times the first wave. We expect a wave 5 which could be 1,618 times the wave 3, this would move the price to 110$, again this zone... Take care, by now wave 5 is slightly more than 100% of wave 3, so the triangle could end at any time, but for us makes sense to wait for lower prices to have a better risk reward ratio.
Ahead we have 120$ and 115$ levels which are also important previous supports and resistances and could lead to some bounces or eventually to the end of the pattern. Let's keep watching!
Worst case
If the price loses the 105$ level, we have no historical volume until 80$ so a crash could happen easily. Anyway, the 105-110$ zone is strong enough to believe that demand will appear there and the expanding triangle could then be confirmed.

Bobby's homework assignment12. 30. 22This will be introduction to expanding triangles.In a way, to my way of thinking, there are 3 kinds of markets: Trending markets, ranging markets, and expanding triangles. Sometimes expanding markets are elusive, but it helps you to know about them. You can still make money and manage your trades...Not knowing. In an expanding market, especially because they're not obvious until later in their evolution. That is not all bad because this kind of pattern really shows Its expansion later in the process. You are still going to look at your gaps, and your extensions, and your retracements, and your support resistance lines... so it's not like you're Trading Stark naked... your tools will give you cover. In a way expanding triangles are a complex reversal... with the biggest move at the end. I think you'll find that it is very easy to get blindsided and miss these patterns...but it is helpful to become aware that A market that is making new lows and new highs... it's not necessarily chaotic and Untradeable... it is a specific type of organized pattern. I need to apologize in that I digress a little bit looking at other tools that I use, is that me complicate the video. However, the tools that I use in the way I process the market, helps me manage and trade the market even when I haven't factored in a significant pattern such as an expanding triangle. In other words, the normal things that I do still protect me...Even when it hasn't quite register with me that I'm trading through an expanding triangle. You really want to know that you're in it expanding triangle before completely plays out>>>>Better late than never.

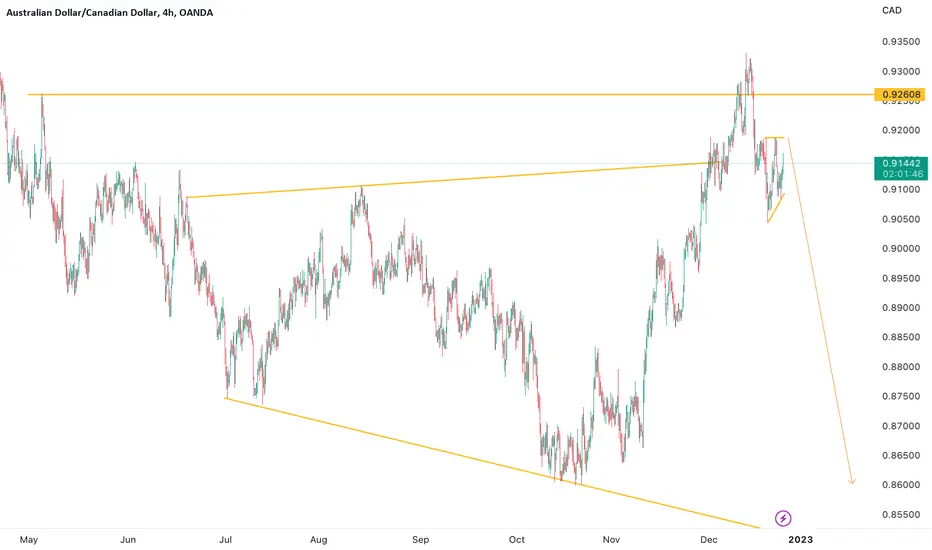
AUDCAD : SHORT BIASExpanding channel with a bearish impulsive rejection on a double top, followed by a corrective structure.
A rejection at the third touch of the corrective structure on the lower timeframe will suffice for a short position, down to the low of the expanding structure.
EURJPY : Potential Bullish MovePrice formed a clear descending channel followed by a double bottom while reaching for the third touch, resulting in a bullish impulsive move.
With the current corrective expanding structure being formed, I am waiting for a final rejection before going long.

$BTC #BTC #Bitcoin #Elliottwave Buy Setup.This count is based on my assumptions so anything can happen not a trading or financial advice just for educational purposes only kindly do your own ta thanks trade with care good luck.

SPX- surprise Rally aheadThe 5 th wave fall on 3rd Nov'22 had not moved down the index significantly.
hence we must recall the wave count that ,the correction (5 wave downfall ) is completed in the form of a neutral triangle abcde.
Provided the low of 3rd Nov'22 (3698) respected(should not break).
If this is so, until 11th Nov, all 5 waves of Expanding triangle A,B,C,D,E has been completed, and a new recovery wave ABC (3 waves)will start.
This may begin with a santa claus rally from 14th Nov'22

SPX- the final count downNow its clear that wave 'C' has started to bring the index DOWN to 3593 or much lower up to 2562

GOLD (XAUUSD) BEARISH MOMENTUM FORECASTHead and shoulder formed at the third touch of the expanding channel, followed by a bearish impulsive break.
Looking forward to some further bearish momentum after the formation of a corrective structure at the moment either in the form of an ascending or expanding channel.

407-419 by next week. Point target 414Update to previous idea.
Look like a minor wave 4 completing in the form of an expanding triangle

German stock index. Europe.According ewt expanding triangle via $DEU40 should plunge lower than lows of 1932 and 1945
in next 70 years.

Snipers DelightBounce zone 195-current level
240s by next week, 260s following pullback see green trajectory
Snipers delight expanding triangle. Bigger picture is we are nearing completion of Triple Combo correction

will SPX test 3195?As everyone expected the climax selling is on the way to test 3195.
So for SPX is corrected in a expanding triangle(limited in 3 waves within trendlines).
Now this leg (E) is final and the trendline is far below(3177).
61.8% support falls @3195 for overall bullishness

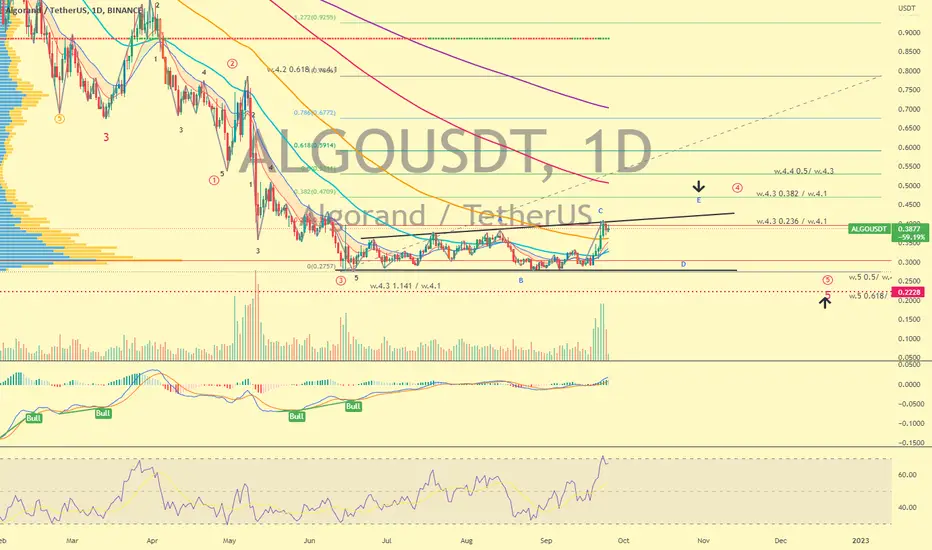
ALGOUSDT | Wave Projection | 4.4 Wave Expanding DiagonalPrice action and chart pattern trading setup
> A possible uptrend 4 wave with expanding triangle pattern ABCDE
> Target take profit zone at 4.4-wave @ 0.382 - 0.5 retracement zone of previous wave 4.2-wave
> The final downtrend 5 wave zone could be projected at 0.5 - 0.618 retracement zone between the recent lowest zone and original major 2-wave - dump & pump pattern is expected.
> Indicator: MACD squeezed and gold cross the baseline with wider uptrend ribbon, most likely to continue rising for now.
Always trade with affordable risk and respect your stoploss - nothing is 100%