A Step-by-step Guide to One of the Chart Analysis Method: VOLTASHello Friends,
Welcome to RK_Chaarts,
Today we're going to learn step-by-step guide to one of the chart analysis Method by analyzing a chart of " VOLTAS LTD. " to identify a trend change opportunity.(Educational Post).
Let's get started!
Applying Elliott Wave Theory
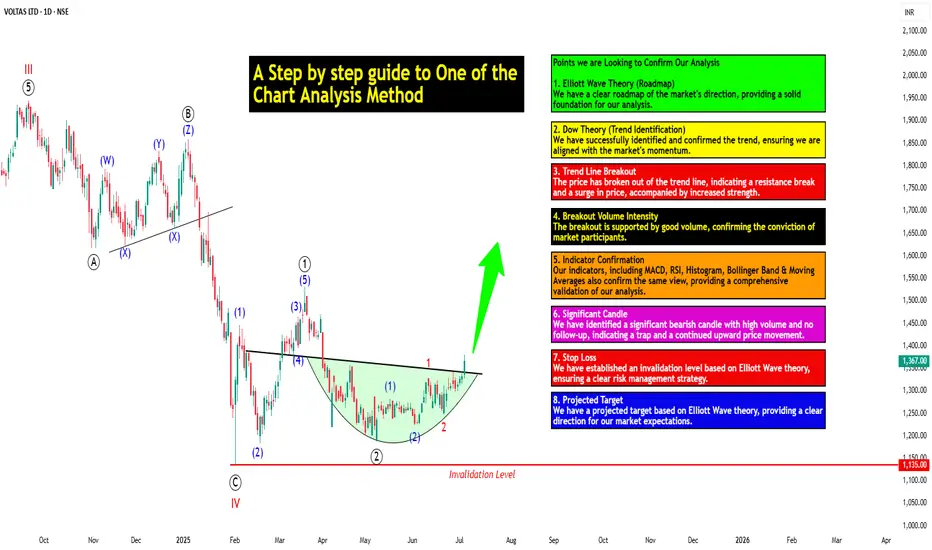
According to Elliott Wave theory, we can see that the high of September 20, 2024, marked the end of the wave III of the cycle degree in Red. After that, a corrective wave unfolded, which reached its low on February 1, 2025. This was the wave IV of the cycle degree in Red, with a low of 1135.
The approximately 6 months correction ended here, and now the wave V of the cycle degree in Red has begun. Within this, there will be five sub-divisions of primary degree in black, which we can label as waves ((1)) to ((5)). Of these, waves ((1)) and ((2)) are complete, and we are possibly now in wave ((3)) of the Primary degree in Black.
Within wave ((3)), there will be five sub-divisions of intermediate degree in blue, of which waves (1) and (2) are complete, and the (3)rd intermediate degree in Blue is underway. Within this, there will be five sub-divisions waves of minor degree in red, of which 1 and 2 are complete, and today we saw the breakout of the 3 of the (3).
Possibly, this is a momentum move according to Elliott Wave theory, which we can call the third of the third of the third.
Now that we have this low of wave IV at ₹1135, it should not go below this level according to Elliott Wave theory. If it does, our current wave count will be invalidated. That's why we have an invalidation level within Elliott Wave, which according to this chart is at ₹1135. This low should not be breached. If it is breached for any reason, we'll have to re-analyze our entire count, and the counts could be different.
However, if this low holds, then the minimum target for wave V, based on the projection of wave theory, would be at least 100% to 123% of the fall from top III to bottom IV, which could take it to around ₹2000 to ₹2100. Shown in chart image below
Possible Elliott Wave Counts on Daily Time Frame Along with Invalidation level & Target levels.
Dow Theory Suggests now Up Trend
After forming the top of wave III, we can see that the price has moved downwards in a pattern of lower highs and lower lows. However, after completing the bottom of wave IV, the price has started forming a pattern of higher highs and higher lows, indicating that an uptrend has begun.
This is a clear signal that supports our wave counts moving upwards, i.e., towards an impulse move, based on Dow theory. The successful completion of wave IV and the initiation of the higher highs and higher lows pattern suggest a strong bullish trend, and we can expect the price to continue moving upwards. Shown in chart image below
Breakout with good intensity of Volumes
In this chart, we've observed a rounding bottom type chart pattern, and today, we've seen a breakout above the upper resistance trend line. Today's candle volume is also significantly higher than the average. Shown in chart images below
Chart Pattern: Rounding Bottom
Resistance Trendline Breakout with Good Intensity of Volumes
Supporting Indicators & Moving Averages
Also we can see that the current price has closed above the 50-day EMA and 100-day EMA. Additionally, indicators like RSI is above 60 and showing momentum, MACD is positive and above the zero line, and the histogram is also showing a breakout. Shown in chart images below
Breakout above 50DEMA & 100DEMA
RSI Breakout above 60+ on Daily Time Frame
Bullish side Breakout in Histogram on Daily Time Frame
MACD running Positive & above zero line on Daily Time Frame
Bollinger Band on Weekly
If we look at the weekly time frame, the current week's candle is above the middle Bollinger Band, indicating that the price is above the 20-period simple moving average on the weekly time frame. which is very good sign. Shown in chart image below
Price Trading above 20 SMA on Weekly Time Frame (Mid.Bollinger Band)
Significant Observation in Price Action & Volumes
Before the breakout, the rounding bottom chart pattern that was forming at the bottom can be interpreted as accumulation, as a red bearish candle with high volume appeared, marking the highest volume. Notably, no candle has closed below the low of that candle since then.
Although a gap-down candle occurred, it opened and closed bullish, indicating no selling pressure below that level. The absence of bearish follow-up and the subsequent breakout today are significant observations, combining price action and volume. This is a positive sign suggesting the price may move upwards. Shown in chart image below
This is how chart analysis is done for investment purposes. We've seen many signs in our favor, and yet we still use a stop loss to prevent significant losses in case the stock or market moves unexpectedly. This is what stop loss is all about - minimizing potential losses.
We've also discussed the target projection based on Wave theory, 123.6% level, which we explained through an image. So, friends, I hope you've understood the entire conclusion and learned how to analyze charts using different methods, one of which we shared with you today.
I am not Sebi registered analyst.
My studies are for educational purpose only.
Please Consult your financial advisor before trading or investing.
I am not responsible for any kinds of your profits and your losses.
Most investors treat trading as a hobby because they have a full-time job doing something else.
However, If you treat trading like a business, it will pay you like a business.
If you treat like a hobby, hobbies don't pay, they cost you...!
Hope this post is helpful to community
Thanks
RK💕
Disclaimer and Risk Warning.
The analysis and discussion provided on in.tradingview.com/u/RK_Chaarts/ is intended for educational purposes only and should not be relied upon for trading decisions. RK_Chaarts is not an investment adviser and the information provided here should not be taken as professional investment advice. Before buying or selling any investments, securities, or precious metals, it is recommended that you conduct your own due diligence. RK_Chaarts does not share in your profits and will not take responsibility for any losses you may incur. So Please Consult your financial advisor before trading or investing.
Exponentialmovingaverages
GuiWave987 - Is a fibonacci EMA lines and its oppositesThe Giugni Wave 987 is a strategy script to demonstrate the EMA Fibonacci numbers from 55 to 987 and its opposite differential lines to the EMA55 (base).
The main idea is to evaluate and identify points of entrance or targets.
You may contact me at mvgiugni@msn.com if you need to develop your own strategy on tradeview

KIRLOSBROS - Cup & Handle patternAll details are given on chart. If you like the analyses please do share it with your friends, like and follow me for more such interesting charts.
Disc - Am not a SEBI registered analyst. Please do your own analyses before taking position. Analysis provided on chart is only for educational purposes and not a trading recommendation.

XAUUSD Forecast Dec 2024Hi all Traders!
In the XAUUSD H4 chart, it is observed that after breaking the support zone, the price is currently in a correction phase and pulling back towards low level fibonacci or continue to above.
Considering the price structure and hit fibo 50%, it is expected that after reaching the identified resistance area, the price will resume its downward movement and target lower levels or after rejection in fibo 61.8% will be uptrend and then continue to downtrend.
Key Points:
Forecast 1 :
Sell Entry 1 : Consider entering a Short Limit position around Fibs 50% with price of 2663.27, positioned close to the breakout level. This offers an entry point near the perceived shift in momentum.
Target Levels: 2560.75
Sell Entry 2 : Consider entering a Short Limit position around Fibs -0.382% with price of 2765.78, positioned close to the breakout level. This offers an entry point near the perceived shift in momentum.
Target Levels: 2516.35
Buy Entry : Consider entering a Long Limit position around Fibs 1.382% with price of 2560.75, positioned close to the breakout level. This offers an entry point near the perceived shift in momentum.
Target Levels: 2765.78
Forecast 2 :
Sell Entry 1 : Consider entering a Short Limit position around Fibs -0.382% with price of 2765.78, positioned close to the breakout level. This offers an entry point near the perceived shift in momentum.
Target Levels: 2516.35
Buy Entry : Consider entering a Long Limit position around Fibs 61.8% with price of 2649.55, positioned close to the breakout level. This offers an entry point near the perceived shift in momentum.
Target Levels: 2765.78
Forecast 3 :
Sell Entry : Consider entering a Short Limit position around Fibs 50% with price of 2663.27, positioned close to the breakout level. This offers an entry point near the perceived shift in momentum.
Target Levels: 2516.35
like and share your thoughts in the comments thank you

SUPREME INDUSTRIES TRADING IDEACup & Handle Breakout with good volume.
Stock can go as marked on the chart
Technicals
—Bullish Crossover
—Above 20 EMA
—Higher High breakout
—RSI 71
Fundamental
Stock P/E 44.2
ROCE 26.8%
ROE 21.0 %
Market Cap ₹38,226Cr.
educational purpose only!✨
Do your research before making any investment🥂

NIFTY DAILY - 22/4/2024Second winning strike of bulls, Nifty opens gap up with almost 150 points.
Initially bears were trying to capture the market but didn’t sustain and made days low that is 221989 level.
Market was choppy throughout the trading session, into last trading hour nifty made high of 22375 with almost 220 points up which is around 1% and gave closing near today’s opening level which is 22336 level.
Index has formed Dragonfly Doji on daily chart which indicates indecisiveness among participants. Candle is taking support of 20 Days Exponential Moving Average Line.
Nifty is able to hold 22300 level and broke the resistance level which was 22276 so, further resistance will be 22556 level with support of 22242 level.
Today’s Advance Decline ratio of NIFTY50
Advance - 44
Decline - 5
Unchanged - 1
FII Sell - 2915.23 crores
DII Buy - 3542.93 crores.
⚠️ Important: Always maintain your Risk & Reward Ratio.
✅Like and follow to never miss a new idea!✅
Disclaimer: I am not SEBI Registered Advisor. My posts are purely for training and educational purposes.
Eat🍜 Sleep😴 TradingView📈 Repeat 🔁
Happy learning with trading. Cheers!🥂

10 EMA strategy ^BEST TREND-FOLLOWING STRATEGY^Welcome! Today, I'm excited to share with you one of the most effective trend-following strategies that is adaptable to any timeframe and asset class ( OANDA:XAUUSD , NSE:NIFTY , FX:USDCHF ), boasting a remarkable risk/reward ratio of up to 1:10. Let's dive right in.
As mentioned, this strategy revolves around the Exponential Moving Average (EMA), specifically the 10-period EMA. For those unfamiliar, the EMA places greater emphasis on recent price data compared to a Simple Moving Average (SMA), providing a dynamic view of market trends.
When the price on your chart is above the 10 EMA, it signifies a bullish trend; conversely, when the 10 EMA is above the price, it indicates a bearish trend. Let's illustrate with an example:
Imagine a bullish trend with four consecutive green candles followed by a red candle. Our entry point occurs when this red candle, the trigger candle, fails to touch the 10 EMA. Subsequently, when a green candle crosses above the high of the trigger candle, we enter the trade. Setting our stop loss (SL) just below the EMA line beneath the trigger candle, we establish our take profit (TP) based on a risk/reward ratio, starting at 1:2 and potentially reaching an impressive 1:10.
Trailing the 10 EMA line allows us to stay in the trade longer, albeit experiencing initial stop-loss hits. However, perseverance reveals the strategy's efficacy over time.
Now, for short positions, such as during a downtrend characterized by three red candles followed by a green candle, our entry occurs when the low of the green candle is breached by the subsequent red candle. Setting the SL just above the EMA line above the trigger candle and TP based on the risk/reward ratio, we execute the trade.
For those interested in trailing stops, there are two options: firstly, trailing along the 10 EMA line; secondly, utilizing the Average True Range (ATR) for algorithmic trading enthusiasts.
With this strategy's flexibility and potential for significant returns, it offers traders a robust approach to navigating diverse market conditions.
***Here are 2 examples of Long & Short: Long position in BINANCE:SOLUSDT
www.tradingview.com
Short in FOREXCOM:EURCAD
It's crucial not only to grasp the concept of this strategy but also to put it into practice. 💼 Start by implementing it with small capital or utilize paper trading, which platforms like TradingView offer. 📝 Additionally, don't hesitate to experiment. For instance, try using an 11-period EMA and assess its effectiveness. You might find that it better suits your trading style and objectives. 🧪💡 Remember, trading is a journey of discovery! 🚀 Don't be afraid to explore new strategies and techniques along the way.
🌟 Like (boost), follow, comment, and share this strategy to spread the knowledge and empower fellow traders! 📈🚀👍
For the optimal TradingView experience, upgrade now to unlock the platform's full potential:
www.tradingview.com

RSI as a Trend ToolMost people use the RSI as a momentum indicator,
trying to find Overbought/Oversold (OBOS) conditions,
and/or divergences.
However there is also a way to use it as a Trend Tool.
There is a mathematical relationship that connects the RSI and EMA's.
The formula is RSI(x) cross-over 50-line = Close cross-over EMA(2x)
i.e. RSI(14) cross-over 50 line = Close cross-over EMA(28)
This one of the properties of the RSI,
which I discovered when taking a more indept look into momentum indicators,
which ultimately led to the discovery of the MACD-v in 2014/2015
The MACD-v was then publicly disclosed in 2022,
in the form of a a paper called
"MACD-v: Volatility Normalised Momentum",
which was awarded:
It has won 2 International Awards:
1. The “Founders Award” (2022),
for advances in Active Investment Management
from the National Association of Active Investment Managars (NAAIM)
2. The “Charles H. Dow Award” (2022)
for outstanding research in Technical Analysis,
from the Chartered Market Technicians Association (CMTA)

USDJPY LONGWith the DXY (Dollar Index) shooting up, we look to buy USDJPY in correlation to the dollar and the EMA'S combined with the broken resistance now turned support give us more confluence.

BTCUSD 2023-2025 16k--62k-ish?Here we have BTC-USD-monthly with logistic (growth) function (phi-rameters are somewhat arbitrary) and with simple Triple Exp Moving Average.
Based on this, I am kind of thinking to buy in during the autumn 2023 (somewhere between 12k-16k), and I might be selling during the winter 2025 (somewhere between 44k-62k). Or maybe not.
___
This is NOT a trading advise! (It is just my superbiased idea.)
The information shared is not meant to be, and do not constitute, financial, investment, trading, or other types of advice or recommendations!

NIFTY DAILY - 6/3/2024After a three choppy session Nifty hit a new high in second half that is 22497 level.
Nifty has formed a big green body candle with long lower shadow which indicates buyers were buying from lower end and upper shadow.
Candle has taken support of 9 days Exponential Moving Average.
Nifty find nearest resistance 22520 level and nearest support lies around 22269 level.
Today’s Advance Decline ratio of NIFTY50
Advance - 35
Decline - 15
FII Buy + 2,766.75 crore
DII Buy + 2,149.88 crore.
⚠️ Important: Always maintain your Risk & Reward Ratio.
✅Like and follow to never miss a new idea!✅
Disclaimer: I am not SEBI Registered Advisor. My posts are purely for training and educational purposes.
Eat🍜 Sleep😴 TradingView📈 Repeat 🔁
Happy learning with trading. Cheers!🥂

ADA/USDT Trading ScenarioBelow is the price movement scenario for ADA.
After significant consolidation of the asset in the price range between the support level at $0.2327 and the resistance level at $0.4582, an impulsive breakout of the resistance level at $0.4582 occurred at the end of 2023. This caused a subsequent establishment of a local maximum at $0.6883.
Despite the overall positive trend in the cryptocurrency market and steady growth of BTC, the asset experienced a correction, dropping by more than 30% and testing the broken level of $0.4582. This was followed by an attempt to rebound; however, from the volume profile perspective, the asset encountered volume resistance.
We expect further development of the scenario for acquiring the asset. In case of a decrease in the asset's price and subsequent retesting of the resistance level at $0.4582, as well as holding this level, together with the shift of the global POC to this mark, we will begin to form positions with further holding.

NIFTY DAILY - 27/2/2024Index open with positive note and afterwards bulls took over the market and made days high that is 22218.
Index has formed green body shaven bottom candle with small upper shadow which indicates participants were buying from lower level.
Candle is taking support of 9 Days Exponential Moving Average as seen in chart.
Next levels for nifty will be 22381 upsides and 22023 level downsides.
⚠️ Important: Always maintain your Risk & Reward Ratio.
✅Like and follow to never miss a new idea!✅
Disclaimer: I am not SEBI Registered Advisor. My posts are purely for training and educational purposes.
Eat🍜 Sleep😴 TradingView📈 Repeat 🔁
Happy learning with trading. Cheers!🥂

NIFTY DAILY - 26/2/2024Nifty open with gap down.
Bulls tried to sustain in the market but failed and bear took over the market and made days low that is 22075 level and formed small body red candle with upper and lower shadows.
Candle is trading near 9 Days Exponential Moving Average.
Next levels for nifty will be 22381 upsides and 22023 level downsides.
⚠️ Important: Always maintain your Risk & Reward Ratio.
✅Like and follow to never miss a new idea!✅
Disclaimer: I am not SEBI Registered Advisor. My posts are purely for training and educational purposes.
Eat🍜 Sleep😴 TradingView📈 Repeat 🔁
Happy learning with trading. Cheers!🥂

AUDUSD SHORT PROJECTIONLooking to short AUDUSD as it rejected a trendline and 38.20% FIB Level. We will also be monitoring the DXY(Dollar Index) for correlation and more confluence. A break and retest below 0.65200 psychological level support will give us a proper confirmation to go short.
I will be shorting this pair now but with extreme caution and add more orders upon the break and retest of the support.

EDUCATIONAL VIDEO ON MOVING AVERAGE AND EXPONENTIAL MOVINGKindly check this Educational video on Moving Average and Exponential Moving Average

APTUSDT - Trend reversal (Possible double top and retest EMA) There is visible trend reversal and possible double top and restest EMA with good risk reward ratio for shorting, what do you think?

EURUSD 4H Chart Inverse Head & Shoulders breakoutEURUSD 4H chart Inverse H&S producing a
breakout
Additional confluences:
- Bullish market structure, the price is forming the
pattern around the support range fro m the
previous major high points
- Head of the inverse H&S pouncing from the
0.618 Fib
- MACD produced a Bullish cross a while back and
now it's providing bullish continuation
- Price bounced from the 200 SMA and now it's
above the 20 and 50 EMA. Monitor the 20 and 50
for a Bullish cross

Bitcoin Bull Flag forming, BTC to 40k?Bitcoin is possibly forming a continuation Bull Flag pattern. Target ~40200
Price is respecting nicely 12H 9EMA as we can see from the chart (same with Total marketcap).
If we break the 9EMA support I think we will go test the Daily 9EMA and Flags bottom level where probably some buyers would show up. (Picture below)
This price action is quite fascinating and the trend seems strong (haven't broken down yet).
Much people are hoping for a Break and Retest on the 32k breakout level, so they can buy their positions. Could be that we won't even get there.
Not financial advice.
My analysis on Crypto Total Marketcap , the most important level I'm following on crypto
-PalenTrade

End of uptrend in hourly chartPrice crossed below 50 EMA
23 and 26 EMA negative cross over
Breadown the Higher Low TL

XAAUSD Strategy to Trade any Pair Testing Phase 1so weekends for many mean relaxing, but for many of us it is, contemplating what went wrong, strategizing our risk management and tweaking our strategies.
I Had a thought that instead of trading during news and peak session, why dont we trade after the market has done what it has done and enter when the strength has weakened, this way we might cut unnecessary loss during news and peak sessions and aim for 3-5$ profits/loss.
its less stressful, you don't need to sit the entire day or half a day, the process might be long and might require patience but its worth it. This may suit swing traders who can hold position for more than a day, but my basic idea is to enter and exit before the day closes(for testing purpose only).
So basically i will take 2 EMA's 20 and 200, During the end of the day i will look to get in to the market.
Conditions : There needs to be a maribozu candle above or below the ema, depending on if its a buy trade or sell trade.
For buy trade the candles should be above both 20 and 200 ema and for the sell trade it should be below the 20 and 200 ema.
Our Entry : will be after it breaks the maribozu candle body.
Risk Ratio : 1:1 for starters
Note: This strategy is risky if you account size is below 5000$
Will backtest this and keep sharing updates.

UPL Weekly pattern breakdown.UPL has been consolidating in a range between 850 and 650 on the weekly chart. It has been in triangle type pattern and has broken down on a weekly basis. A close below the upward trendline shows increasing bearish pressure.
Bearish momentum should increase below the weekly low of 673. One could expect greater selling pressure if price closes below the support at 650 and the 200 Weekly EMA which is also around 654.
After the breach of these levels, the following levels could be expected..
Target 1: 621
Target 2: 569
The setup would be invalid if we get a close above 725. Keep watch.

INVESTMENT IDEA FOR HALAs we can see the stock breaks its trading channel consolidation after 7 months with heavy volume and takes the support of the channel and again it breaks its trading channel on 16th November with heavy volume as compared to the last breakout volume.
STOCK IS TRADING ABOVE 20 50 EMA RSI crossing 60 from below. RSI 65
Hindustan Aeronautics Gets an LOI (letter of intent) for Nine Helicopters from Indian Coast Guard
letter of intent (LOI)
A letter of intent (LOI) is a document outlining the general plans of an agreement between two or more parties before a legal agreement is finalized. A letter of intent is not a contract and cannot be legally enforced; however, it signifies a serious commitment from one involved party to another.
educational purposes only!
