Exponentialmovingaverages

EMA 89 and Price ActionNotice how PA has reacted to 89EMA on 4H. Just tagged it and 20MA forming a potential tweezer on this upcoming 4H close in 10 minutes. Also worth noting the volume spike upon rejection.

Crypto and traditional markets facing strong resistancesCrypto and traditional markets facing strong resistances.
Bitcoin and Ethereum at EMA50 (blue line)... SPX500 and Wallstreet at daily EMA200 (violet line).
And we have todays FOMC meeting.
Will prices break trough before or after that... or will they bounce hard?
What do you think? 😎
Drop me a nice comment if you'd like me to analyze any other cryptocurrency.
*not financial advice
do your own research before investing

Swing trade atleast 20% returnHi All,
Please refer chart for detailed explanation on technical analysis.
Current price is low as compared to book value also there are high chances of Target 2.
I will be buying at all support zone because I'm very much sure that it will reach around 160 levels in few months.
For long term it can also go up to 200 levels.
You can also check my ITC trade for 25% return. Link is shared below or else you can visit my profile and check all the Ideas which I have shared.
If you think my analysis is helpful than please do like my idea. For future reference do follow me so that you do not miss any of my analyses.
Feel free to leave any questions you have in the comments! I will gladly respond to them.
Hopefully, this helps you out a little bit. Please make your own research before investing.
P.S: This is not an investment advice. This chart is meant for learning purposes only. This is my personal viewpoint so please Invest your capital at your own risk

USDJPY Resistance Level At 114.970USDJPY. If price closes above 114.970, then watch for a bullish price action signal on the retest.

NZDCAD Trend Lines + Exponential Moving AveragesWatch for bullish price action signals on the 4H Time Frame.

PYPL - One more deep to touch 200 EMALooking for PYPL to go up and down to bounce again at 200 EMA like what it did last March 2020, but will not break the all Time High because of 20MA and 50EMA is sharply pointing down to 200EMA.
Entry: 174.00 or when bounce at 200EMA
SL: 61.8% of Fibonacci Retracement from March 2020 to ATH
TP 1: 23.60% to 38.20%
TP 2: 38.20% to 50%
*

ADAUSDT possible bottomADA-Cardano reached long-term channel bottom and it's obvious on the logarithmic chart that we have a support in 1.40-1.60$ area that I highlighted with red rectangle. I'm not saying it must start new bull-run but it's high possibility to have a new ATH in December. Because of BTC 4-year cycles and end of BTC bull-run in 2022, 5$ is a reasonable and logical Target Point(Mid-line of rising channel) that ADA can reach it by the end of December.
p.s. : This is only my personal thoughts and you must do your own research before trading.

BTC Indecision!BTC was rejected twice from the previous highs, forming a double-top. Since then, it has slowly been selling off. It's currently closed below the 14EMA and is continuing to look bearish. If it doesn't hold at these levels, we can expect it retest around 53k shown with the blue and turquoise lines. Lets also keep an eye on the RSI. Once that's broken, a strong bullish move usually follows. (Let me know your thoughts in the comments below.)
Love it or hate it, hit that thumbs up and share your thoughts!
Don't trade with what you're not willing to lose. Safe Trading Calculate Your Risk/Reward & Collect!
This is not financial advice.

USDZAR Up TrendUSDZAR Exponential Moving Average Period 10, Exponential Moving Average Period 20, Trend Support Line, Horizontal Support Line
(Watch For Bullish Price Action Above Exponential Moving Average Period 10, Exponential Moving Average Period 20, Trend Support Line, Horizontal Support Line)

USDCNH Target Price 6.40760 Entry Price 6.38819USDCNH | Trend Line; Exponential Moving Averages; Pin Bar; Higher Lows; Up Trend

USDSGD | Trend Level; Horizontal Level; EMA 10 EMA 20 LevelUSDSGD | Trend Support Level; Horizontal Support Level; EMA 10 EMA 20 Support Level
Entry At Rejection Candlestick
USDSGD Market Is Bullish.

How To Trade The Symmetrical Triangle (Higher Lows, Lower Highs)Lower Highs are represented by the diagonal trend line. These lower highs are the resistance line.
Higher Lows are represented by the diagonal trend line. These higher lows are the support line.
Breakout Candlestick
Retest Candlestick
How To Trade The Triangle Chart Pattern
First, Look For An Up Trend
Second, Draw Diagonal Support Line and then draw Diagonal Resistance Line. These lines are your levels.
Third, Wait For The Breakout Candle. Enter after the candle closes.
Fourth, Wait For A Candlestick To Retest Diagonal Trend Line. Enter after the retest candlestick closes.
Fifth, Set Target Using Height of Pattern

USDZAR Triangle Chart Pattern (Target Price 16.08359)USDZAR Foreign Currency
Trend: Up
Level: EMA 10, EMA 20, Diagonal, Horizontal
Price closed above 15.49260. Watch For A Bullish Price Action Signal Above 15.49260.

SPX500 Triangle Chart PatternSPX500 Foreign Currency Pair
Trend: Up
Level: EMA 10, EMA 20, Diagonal, Horizontal

USDSGD Triangle Chart PatternUSDSGD Foreign Currency Pair
Trend: Up
Level: EMA 10, EMA 20, Diagonal, Horizontal

USDPLN Triangle Chart Pattern (Target Price 4.24825)USDPLN Foreign Currency Pair
Trend: Up
Level: EMA 10, EMA 20, Diagonal, Horizontal
Signal: Break Out Candle

USDRUB Triangle Chart PatternUSDRUB Foreign Currency Pair
Trend: Up
Level: EMA 10, EMA 20, Diagonal, Horizontal

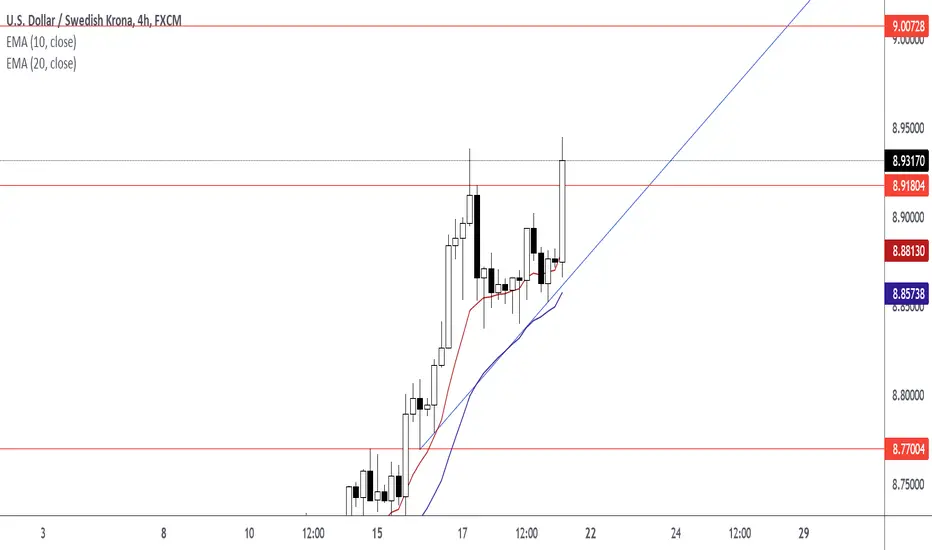
USDSEK Triangle Chart Pattern (Target Price 9.00728)USDSEK Foreign Currency Pair
Trend: Up
Level: EMA 10, EMA 20, Diagonal, Horizontal
Signal: Break Out Candle
USDCZK Triangle Chart Pattern (Target Price 22.67150)USDCZK Foreign Currency Pair
Trend: Up
Level: EMA 10, EMA 20, Diagonal, Horizontal
Signal: Break Out Candle

USDHUF Ascending Triangle Chart PatternUSDHUF Foreign Currency Pair
Trend: Up
Level: EMA 10, EMA 20, Diagonal, Horizontal
Signal: Break Out Candle

SPX500 Index Target Price 4719.50SPX500 Ascending Triangle; Symmetrical Triangle; Exponential Moving Averages; Trend Lines

US100 Index Target Price 16458.95US100 Ascending Triangle; Symmetrical Triangle; Exponential Moving Averages; Trend Lines
