Is It Right Time To Buy/Sell Ultratech Cement Share…. ?Is It Right Time To Buy/Sell …. ?
Welcome To This Analysis About Ultratech Cement, We Are Looking At The Daily Time Frame Perspective. As I Discovered Recently In My Analysis Is Ultratech Cement Reached/Trading Nearest There Diagonal Support, And Price Finding Support At Its 50-day Exponential Moving Average And As Looking At My Chart We Can Watch There Ultratech Cement Is Within This Main Ascending Triangle Formation When Ultratech Cement Stock Has Reverse From This
Support level Then It Has To Continue Bullishly..
But Another Side On Ultratech Cement, Head And Shoulder Pattern Are Looking At The 4 Hrs Time Frame , So There Will Be Chances To Break Down Its Support Level And It Has To Continue Bearishly..
So At This Movement There Will Be More Chances To Ultratech Cement Continue Its Bullish Trend But We Can't Deny To Price Follow Its Bearish Swing So At This Movement My Prediction Is :-
Ultratech Cement Buy :- If Share Price Pushies Up To & Sustain Above Upper Horizontal Line Level 6736, Then It's Most Probably Go for - 6954 (Resistance Level) Our Profit Booking Zone is Between 6925-55 Price Level. And Stop Loss For This Trade Are 6600.
Ultratech Cement Sell :- If Share Price Pushies Down To & Sustain Below Lower Horizontal Line ( Fig-2) Level 6671, Then It's Most Probably Go for - 6544 (Support Level) Our Profit Booking Zone is Between 6599-6544 Price Level. And Stop Loss For This Trade Are 6764.
Exponentialmovingaverages

XRPUSD EMA crossing The EMA crossed, the buy opportuinty started. Be carefulk, last EMA crossing realized as a bull trap. But anyway, keep your stop loss tight.
Risk/Reward looks awesome:
Stop loss $0.59
PT1 $0.76
PT2 $0.96
PT3 $1.27 (long term)
PT4 $1.48 (long term)

SUSHIUSDTThis stock is riding on the EMA, tha´s why I recommend to keep an eye on EMA.
Until we cross the EMA lines, we dedicate an uptrend with the first target of $18.

VeChain - A traditional analysisA look at the VeChain Daily Chart using some traditional methods.
VeChain is still below its Bollinger Bands Middle Band Basis 20 Period SMA on this daily chart.
VeChain is still below its 50EMA level on this daily chart.
VeChain is in a Descending Channel (Dotted Line) on this daily chart.
VeChain is also in an Ascending Triangle (Dashed Line) on this daily chart. The Ascending Triangle has a small upwards trend-line and a potential longer upwards trend-line. We can expect strong resistance at the resistance of the Ascending Triangle. We need the upwards breakout to be on strong volume and if there is a retest after the breakout, that resistance needs to be turned into strong support.
Volume is still relatively low on this daily chart and the Volume Bar is still below its Volume 20 Period Moving Average.
VeChain is still below its Volume Profile Visible Range VPVR Point of Control (POC) for this charts visible range.
VeChain is above its Volume Profile Fixed Range VPFR Point of Control (POC) for the range i have selected. VET needs to stay above this level.
The Moving Average Convergence Divergence (MACD) is showing the MACD Line (Blue Line) is pointing upwards and the Signal Line (Orange Line) is pointing sideways. So we may see the MACD Line cross back ABOVE the Signal Line on this daily chart which would form new Green Histograms and is a potential buy signal. A full Bullish trend is confirmed when the MACD Line crosses back over the 0.0 level, this will be a signal that a 12 Period EMA has crossed back above a 26 Period EMA on this daily chart and would bring the MACD into the positive zone.
The Relative Strength Index (RSI) is showing upwards momentum has increased and note that the RSI (Purple Line) is above its 9 Period EMA (Orange Line). The RSI is showing that VeChain has a huge amount of room to move up before becoming overbought.
You all know how passionate i am about VeChain and it's future in the world of Blockchain. There is a possibility that VeChain might drop more within its Descending Channel before any potential breakout, so any dips should be used to accumulate more for your Dollar Cost Averaging (DCA).
I hope this traditional analysis is helpful with your trading and hodl-ing.

BTC - Quick Daily Chart UpdateQuick BTC Daily Chart update:
BTC is still ranging sideways within its Sideways Channel.
BTC has found some resistance from its Weekly 50EMA, it is crucial that BTC closes THIS weekly candle above this level and turns it into strong support.
BTC is still below its Bollinger Bands Middle Band Basis 20 Period SMA. BTC needs to closes above this level and turn it into support.
BTC is still above its descending Pitchfork (A,B,C) Median Line.
BTC is still below its Volume Profile Visible Range VPVR Point of Control (POC) for this charts’s visible range.
Daily Volume is still relatively low and the Volume Bar is below its Volume 20 Period MA.
The Chaikin Money Flow (CMF) is indicating BTC is still being accumulated and accumulation has increased from 0,02 to 0.14, notice that the CMF (Green Line) is back above its Least Squares Moving Average (LSMA) which is at 0.10.
The Average Directional Index (ADX DI) is indicating the trend strength is sideways with the ADX (Yellow Line) at 39.29 below its 9 Period EMA (White Line) which is at 39.84. Notice that the -DI (Red Line) has dropped from around 33 to 28.52 and is pointing downwards. The +DI (Green Line) is pointing upwards at 13.16. This indicates negative momentum has dropped and positive momentum has increased on this 1D timeframe. We eventually need the +DI (Green line) to cross back ABOVE the -DI (Red Line) on this 1D timeframe.
So tonight is a crucial WEEKLY CLOSE as we ideally need BTC to CLOSE THIS WEEKLY CANDLE above the Weekly 50EMA.
I hope this is helpful with your trading and hodl-ing.

USOIL how long can you ride a trendUSOIL is reaching an sgnificant high, I expect the EMA 100/200 curling down to take a short opportunity followed by the next long run.

AUDUSD Risk/RewardRisk/Reward ratio looks pretty good, entry point confirmed.
We are riding under the 200/100 EMA and can expect a bullrun until we break the EMA again.

ADA - 4hr chart updateQuick ADA update:
ADA is below its 50EMA for this 4hr timeframe.
ADA is below its Bollinger Bands Middle Band Basis 20 Period SMA for this 4hr timeframe.
ADA is back in the Bearish Zone of the Ichimoku Cloud for this 4hr timeframe.
ADA is below its Volume Profile Visible Range VPVR Point of Control (POC) for this charts visible range.
ADA is above its Volume Profile Fixed Range VPVR Point of Control (POC) for the range that i have selected. ADA has also found some support from this level due to the buy volume located at the POC.
The Previous 4hr volume bar was above its Volume 20 Period Moving Average but was lower than the previous so we may see volume dropping slightly.
At the moment of typing this, ADA is in a new Descending Channel. ADA needs to close a 4hr candle above the new Descending Channel and above the Bollinger Bands Middle Band Basis 20 Period SMA and turn those levels into strong support.
The Chaikin Money Flow (CMF) is showing that ADA is back in the Distribution Zone and has dropped to -0.07. At the moment the CMF (Green Line) is still above its Least Squares Moving Average (LSMA) which is at -0.11. But note that the CMF is pointing downwards and the LSMA is pointing upwards so we may see more distribution. We need the CMF (Green Line) to eventually cross back above the Zero Line into the Accumulation Zone.
The Average Directional Index (ADX DI) is indicating a strong trend with the ADX (Yellow Line) at 29.13 above its 9 Period EMA (Blue Line) which is at 25.81. The -DI (Red Line) is at 23.72 an still above its +DI (Green Line) which is at 10.72. Notice that the -DI (Red Line) has dropped and is pointing downwards and the +DI (Green Line) is starting to pointing sideways, this is an indication of weakening negative momentum and we may see a possible increase of positive momentum. We eventually need the +DI (Green Line) to cross back above the -DI (Red Line) for this 4hr timeframe.
At the moment, all cryptos are at the mercy of Binance & the market makers BTC manipulation, so we will have to see how BTC develops.
I hope this is helpful with your trading and hodl-ing.

BTC - Quick daily chart updateVery quick BTC daily chart update:
BTC is below its Bollinger Bands Middle Band Basis 20 Period SMA for this 1D timeframe.
Note that at the moment, the Bollinger Bands Upper and Lower Bands are NOT extending outwards for this 1D timeframe. The Upper and Lower Bands extending outwards means increased volatility.
BTC is below its Schiff Pitchfork (A,B,C) Median Line. BTC needs to eventually close a daily candle above this level.
At the moment of typing this, BTC is below its Volume Profile Visible Range VPVR Point of Control (POC) for this chart range.
At the moment of typing this, BTC is below its Volume Profile Fixed Range VPFR Point of Control (POC) for the range i have selected.
Note that Volume is still relatively low for this 1D timeframe and the Daily Volume Bar is still below its Volume 20 Period MA.
BTC has found some support from its Schiff Pitchfork (A,B,C) Lower Yellow Support Line. Note that BTC has bounced off this support line twice before on this 1D chart. This is a crucial level to CLOSE a daily candle above.
Note that the 50MA is getting really close to the 200MA. If you don’t know, It is called a death cross if the 50MA crosses below the 200MA.
Now for the good news…….. BTC is still above its Weekly 50EMA.
The weekly 50EMA is the one to watch, even if the death cross happens on the daily, from my perspective that is not the end game, the weekly 50EMA is the deciding factor for me. If BTC keeps CLOSING WEEKLY candles ABOVE the WEEKLY 50EMA then all will BE WELL and we’ll just see sideways ranging within a range until the next run up. If BTC CLOSES a WEEKLY candle BELOW the WEEKLY 50EMA, then all will NOT BE WELL for BTC. Remember that BTC wicked 3 times below the WEEKLY 50EMA but did not close below it! If your longterm, its where the candle closes that’s important, not where it wicks to.
I hope this is helpful with your trading and hodl-ing.

ADA - updateQuick ADA update:
ADA is in a Descending Channel. You can see the various support and resistance levels that ADA has had as resistance and support after it broke out from its previous Ascending Wedge.
ADA has found support from its 2nd upwards support line.
ADA is still in the Bearish Zone for this 4hr timeframe. Note we have had a Cloud Twist (Kumo) into a red cloud.
ADA is below its Bollinger Bands Middle Band Basis 20 Period SMA for this 4hr timeframe.
ADA is still below its 50EMA for this 4hr timeframe.
The Average Directional Index (ADX) is showing the ADX (Yellow Line) at 36.55 dropping below its 9 Period EMA (Blue Line) which is at 37.92 indicating trend strength is dropping. The -DI (Red Line) is at 24.07 still above its +DI (Green Line) which is at 12.4. Notice that the -DI (Red Line) has dipped and the +DI (Green Line) is starting to slope slightly sideways. For the longterm, we need the +DI (Green Line) to cross back above the -DI (Red Line) to indicate positive momentum has overtaken negative momentum on this 4hr timeframe.
The Chaikin Money Flow (CMF) is showing that the CMF (Green Line) is inside the Distribution Zone and at -0.16 and under its Least Squares Moving Average (LSMA) which is at -0.08. Notice that the CMF (Green Line) is now pointing upwards. For the longterm, we need the CMF (Green Line) to cross back into the Accumulation Zone fro this 4hr timeframe.
ADA is still below its Volume Profile Visible Range VPVR Point of Control (POC) for this 4hr timeframe.
ADA is still below its Volume Profile Fixed Range VPFR Point of Control (POC) for this 4hr timeframe.
Volume is still relatively low and this 4hr volume bar is below its Volume 20 Period Moving Average. It’s a good thing that these dips are happening on low volume which indicates just a short-term dip from possible profit taking or week hands.
I still believe that any dips with ADA should be used to accumulate more ADA to which you can stake your ADA to earn even more ADA. But if your trading & waiting for full bullish confirmation for this 4hr timeframe, then ADA needs to cross back above both Volume POC levels, the Bollinger Band Middle Band Basis, the Leading Span B (Senkou Span B), the 50EMA and then the Leading Span A (Senkou Span A) levels and turn these levels into strong support. For further confirmation, crossing into the Bullish Zone ideally needs to be on high volume.
I hope this is helpful with your Trading and Hodl-ing.

VeChain - a different style post - enjoyVeChain 4hr Chart update using support and resistance lines:
VeChain is Below its 50EMA on the 4hr chart. VeChain needs to eventually close a 4hr Candle above this crucial level and turn it into strong support.
VeChain is below the Bollinger Bands Middle Band Basis 20 Period SMA. VeChain needs to eventually close a 4hr Candle above this crucial level and turn it into strong support.
Both the Bollinger Bands Upper and Lower Bands are pinching inwards indicating volatility is still slowing.
Note that VeChain had dropped out on the downside of its Bearish Rising Wedge Pattern.
VeChain is testing the 1st Upwards Support Line. This is a very crucial support line and VeChain 110% needs to close a 4hr candle above this support line.
VeChain is in a new Symmetrical Triangle on this 4hr timeframe.
VeChain is still above its Volume Point of Control (POC) for this visible range. We need VeChain to close above this POC as it is a crucial support. On the VPVR you can also see the amount difference between the buying and selling trading activity for this visible range.
Volume has risen slightly and is now above its Volume 20 Period Moving Average. Hopefully VeChain can close this 4hr candle green.
The Relative Strength Index (RSI) is indicating momentum has dropped and is now slightly pointing upwards but be aware hat the RSI is a fast reacting indicator.
If VeChain manages to stay above the 1st Upwards Support Line and the VPVR Point of Control (POC) then we may see another attempt at getting above the Bollinger Bands Middle Band and the 50EMA. If VeChain drops below the 1st Support Line and the VPVR POC, the VET will possibly drop to the 2nd upwards support line. It’s looking hopeful that VET will stay above the 1st support Line and the VPVR POC, but note that it is also still dependant on what BTC does.
If you are uncertain as to whether or not to place a long, its best to wait until VET closes above the Bollinger Bands Middle Band Basis, 50EMA and the New Symmetrical Triangle Resistance Line and turns the ST Resistance Line into strong support for this 4hr timeframe.
I decided to post this chart differently from my usual style of Ichimoku Clouds, Pitchforks, CMFs ect ect, so i hope you have found this helpful with your Trading and Hodl-ing.

VeChain - a 4hr chart analysisVeChain 4hr Chart update:
VET is still in the Bearish Zone of the Ichimoku Cloud.
VET is testing the Ichimoku Cloud Leading Span B (Senkou Span B) cloud resistance. Which is also where the Bollinger Bands Middle Band Basis 20 Period SMA is located at the moment.
We need VET to eventually close a 4hr Candle within the Equilibrium Zone of the Ichimoku Cloud, above the Leading Span B (Senkou Span B) resistance.
VET is below its 50EMA. We should expect strong resistance at this 4hr 50EMA level. VET needs to close a 4hr candle above this level and turn it into strong support.
Volume has increased with the Volume Bar above its Volume 20 Period Moving Average. Hopefully VeChain can end this 4hr candle green.
VET is above its Least Squares Moving Average (LSMA) for this 4hr timeframe.
VET is above both its Volume Profile Visible Range (VPVR) Point of Control (POC) and above its Volume Profile Fixed Range (VPFR) Point of Control (POC). VET 110% needs to stay above the POC for this 4hr timeframe.
The Chaikin Money Flow (CMF) is indicating accumulation has dropped from 0.08 to 0.07 but the CMF (Green Line) is still in the accumulation zone and still above its Least Squares Moving Average (LSMA) which is at -0.04. We need the CMF store stay above the Zero Line and in the accumulation zone for this 4hr timeframe.
The Average Directional Index (ADX DI) is indicating trend strength is sideways with the ADX (Yellow Line) at 25.53 above its 9 Period EMA (White Line) which is at 22.66. The -DI (Red Line) has dropped to 24.63 but is still above its+DI (Green Line) which is at 14.54. Notice that the -DI (Red Line) is indicating negative momentum had dropped with the =DI (Green Line) indicating positive momentum has risen but is now sideways on this 4hr timeframe.
You all know how strongly i feel about the future crypto giant VeChain, so any major dips n drops should be used to DCA & acquire more VET before it does and ADA and gets over that crucial $1 mark.
I hope this is helpful with your trading and hodl-ing.

BTC - Don't get corrupted by the emotion of othersBTC Daily Chart update:
BTC is still above its WEEKLY 50EMA.
BTC is back above its Descending Pitchfork Median line.
BTC needs to turn its Bollinger Bands Middle Band 20 Period SMA into strong support.
Volume has increased and is now above its Volume 20 Period Moving Average. Hopefully BTC can close this day as a green bar.
BTC is still in a Descending Triangle so BTC needs to close a daily candle above the downwards trend-line and turn it into strong support.
I have added a Volume Profile Visible Range (VPVR), you can see the Point of Control (POC) for this charts visible range. BTC is trying to get above this POC.
I have also added a Volume Profile Fixed Range (VPFR), you can clearly see that BTC is above the Point of Control (POC) for the fixed range that I’ve selected. The VPFR gives us a more clearer, macro view of buying and selling for an actual candle fixed range.
The Chaikin Money Flow (CMF) is indicating an increase in accumulation withe the CMF (Green line) in the Accumulation Zone at 0.10. Note that the CMF (Green Line) is above its Least Squares Moving Average (LSMA) which is at 0.06.
The Average Directional index (ADX DI) is showing the ADX (yellow Line) has dipped slightly at 54.13 and is slightly still above its 9 Period EMA (White Line) which is at 54.07. The -DI (Red Line) has dropped to 28.08 and the +DI (Green Line) has risen to 11.94. Notice that the -DI (red Line) is pointing downwards and the +DI (Green Line) is pointing upwards.
An important point that I said in my previous BTC post when BTC wicked below the Weekly 50EMA was that BTC may WICK a few more times below that level, but that the real CRUCIAL thing is if BTC CLOSES THIS weekly candle BELOW the weekly 50EMA. if or until that happens, any post about BTC dropping to $20K and below is pure speculation and traders trying to convince you & the masses to join them in their short sell. Seriously its true, when BTC wicked below the Weekly 50EMA, some people on TradingView thought that this was the end, it clearly isn’t, and as I’ve said many times, if your longterm, its where the candle closes that counts not where it wicks to! Remember that BTC still has 4 1/2 days left on this weekly candle. Don’t let people make you emotional and make hasty decisions, try to study a bit of TA and FA, practice and do your own research as that is the only way to cut out the BS. Because remember, it’s your money!
I hope this is helpful with your Trading and Hodl-ing.

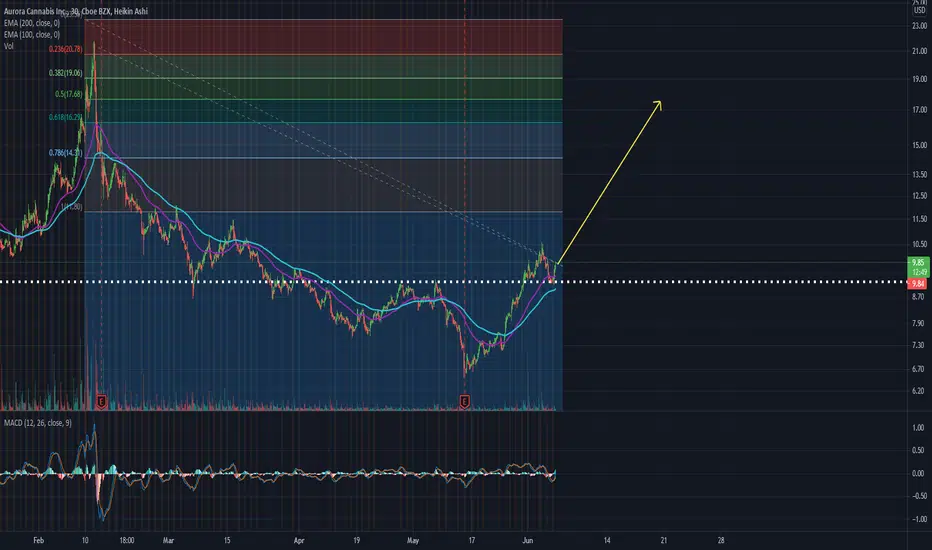
ABC nice bounceABC bounced on 9$ again - perfect.
If we ride on the 100 EMA next target will be 14$ then 17.60$. Overall there is an started uptrend.
DAX30 Short PositionMy software has automatically entered me into this trade. See notes on the chart. There is no trailing stop on this strategy so it either hits the original stop loss or hits the moving average and the trade is closed. Occasionally, if price consolidates for a while and the moving average moves higher, the price can be closed at the MA for a loss (although this is rare). As you can probably tell though, the longer the trade goes on, the closer the MA will get to the entry point. Therefore, we would prefer a quick reversal to maximise our returns.

BTC - Quick UpdateQuick and easy BTC 4hr chart update:
On this 4hr timeframe, BTC is above its Bollinger Bands Middle Band Basis which is a 20 period SMA.
BTC has found resistance from its 50EMA. BTC needs to close a 4hr candle above this crucial level.
BTC is back above its Least Squares Moving Average (LSMA) for this 4hr timeframe.
If we look at the descending Pitchfork (A,B,C), BTC is still below the Pitchfork Median Line. BTC needs to close a 4hr candle above this crucial level.
The ADX DI is indicating that negative momentum has dropped with the -DI (Red Line) at 20.22 and the positive momentum has risen with the +DI (Green Line) now at 16.65. The ADX (Yellow Line) is at 22.76 and has dropped below its 9 Period EMA (White Line) which is at 24.09.
The Chaikin Money Flow (CMF) is indicating that there has been a sharp increase in accumulation with the CMF Line (Green Line) at 0.12.
BTC is in a Symmetrical Triangle on this 4hr timeframe. Symmetrical Triangles are mostly continuation patterns, the preceding movement before the Triangle was Bearish, that means there is a strong possibility of this triangle becoming a Bearish Continuation Symmetrical Triangle. It is not set in stone because there are other factors at play here, if BTC stays above the Bollinger Bands Middle Band Basis & manages to close a 4hr candle back above the 50EMA and turn the 50EMA into strong support then we may see another attempt at getting above the descending Pitchfork Median Line and back above the upper Symmetrical Triangle Trend Line which would invalidate the Bearish Continuation Symmetrical Triangle.
A look at the Chaikin Money Flow (CMF)
A look at the Average Directional Index (ADX DI)
I hope this is helpful with your Trading or Hodl-ing.

VeChain Daily Chart UpdateVeChain Update:
What an absolutely crazy couple of days. Remind me never to buy a Tesla.
At the moment of typing this, VeChain is still below its 50EMA on the daily chart. VET needs to eventually close a daily candle above this level and turn it into strong support.
VET is above its 200EMA.
At the moment of typing this, VET has found a support & resistance at its 100EMA. VET needs to close a daily candle above this level and turn it into strong support.
Notice that VeChain came close but never actually managed to drop & close below its Pitchfork Hagopian Line indicating that this longterm upwards Pitchfork Pattern is still valid.
At the moment of typing this, VeChain is still below its Bollinger Bands Middle Band Basis which is a 20 Period SMA. VET needs to eventually close a daily candle above this level and turn it into strong support.
The Bollinger Bands Lower Band is starting to curve sideways indicating volatility is slowing.
The Price has gone back above its LSMA and has closed a daily candle above this indicator yesterday.
The Chaikin Money Flow (CMF) is indicating VET is back in the Accumulation Zone and heading sideways with the CMF Line (Green Line) at 0.02.
The Average Directional Index/Directional Movement System (ADX DI) is indicating the -DI (Red Line) is at 26.2 still above its +DI (Green Line) which is at 12.2. The ADX (Yellow Line) a 36.8 still above its 9 Period EMA (White Line) which is at 32.2 indicating a strong trend but notice the +DI is pointing upwards and the -DI is pointing downwards so we may eventually see a +DI cross back above the -DI for renewed upwards positive momentum.
Notice that the Volume is increasing and is above its Volume 20MA (Orange Line).
During the recent Crypto drop, VeChain was one of the cryptos that was hit the worst but it is now showing signs of a possible strong recovery. It’s still too early to say for certain but a good sign for the entire crypto market will be if BTC manages to close a daily candle above $40.5K which is roughly where the 200MA is on the BTC daily chart and turn that level into strong support.
It should be an interesting 2 months for VeChain with POA2.0 and possible DHL & Government carbon projects on the horizon. Also, congrats if you managed to accumulate more VET at $0.05 - $0.1 during the drop.
I hope this is helpful with your Trading or Hodl-ing.
CMF
ADX DI

USDOLLAR - Reflection PointFX:USDOLLAR
Hello Everybody, here we have the USDOLLAR INDEX on the Weekly chart. Over the past few months we have pretty much just been melting to the downside since making a double top around 12500. Price is now at a very significant level testing both the neckline and a major weekly descending trendline which was broken in March.
We currently have two fibs in play, a bullish fib on the weekly timeframe with price hovering above the 786 Level and a daily bearish fib giving us some room to come down, this will allow us to continue to short the Dollar on the lower timeframes.
We are hoping in the next couple of weeks we will have a clearer indication of where the dollar is heading in the coming months, should next week(s) candle close below the 786 level instead of rejecting it then we are anticipating further Dollar weakness.
If you look below at the daily timeframe you can see that we are still making higher highs and higher lows, respecting the bearish daily 618 fib level, EMA and trendline therefore the dollar can continue lower to around 11500 before either a daily correction or a much deeper pullback takes place.
If you have found this useful then why not join our free telegram on the links below, you can find more chart analysis and setups as well as educational content.

VeChain - 4hr Inverted Head and ShouldersVeChain - A quick 4hr chart update
VeChain has broken upwards from its Inverted Head and Shoulders pattern.
VeChain is above its Bollinger Bands Middle Band Basis which is a 20 Period SMA. Note that the Bollinger Bands Upper Band has started to point upwards.
VeChain is below its 50EMA fro this 4hr timeframe. We need to close a 4hr candle above the 50EMA for this 4hr timeframe.
The Ichimoku Lagging Span (Chikou Span) is indicating momentum is upwards or this 4hr timeframe.
The Ichimoku Cloud Conversion Line (Tenkan Sen) is indicating short-term momentum is upwards for this 4hr timeframe.
The Ichimoku Cloud Base Line (Kijun Sen) is indicating mid-term momentum’s sideways for this 4hr timeframe.
VeChain is trying to get back over its Leading Span B (Senkou Span B) resistance level, crossing this level will take VET out of the Bearish Zone & back into the Equilibrium Zone of the Ichimoku Cloud for this 4hr Timeframe.
The Chaikin Money Flow (CMF) is showing that VET is still in the accumulation zone at 0.13 for this 4hr timeframe.
The ADX (Yellow Line) is at 47 slightly below its 9 Period EMA (White Line) which is at 48. The -DI (Red Line) is at 24.5 above its +DI (Green Line) which is at 15.1. Notice that the _DI (Red Line) is pointing downwards and the +DI (Green Line) is pointing upwards, if upwards pressure maintains then we may see the +DI (Green Line) cross back above the -DI (Red Line).
If VeChain closes this 4hr candle in the Equilibrium Zone, then VET will be poised to attack the Leading Span A (Senkou Span A) cloud resistance to try and get back into the Bullish Zone of the Ichimoku Cloud for this 4hr timeframe. If VET crosses back into the Bullish Zone, we will then get a Kumo (Cloud) Twist back in to green indicating a renewed Bullish Trend for this 4hr timeframe.
I hope this is helpful with your trading and hodl-ing 👍🔥🚀🌍🌔🪐🛸👽

Bitcoin (BTC) Long-term & Mid-term AnalysisBitcoin (BTC) Long-term & Mid-term Analysis
As you can see Bitcoin tested Weekly support and EMA21 and so far a not-so-good bounce. still, the Weekly trend is not bearish.
However Daily is starting to change of behavior because when BTC corrected from $58k to $50k, open interest rose up.
On a weekly basis, if $45k breaks, the $38k ~ $32k range test would be highly probable.
But until then Bitcoin could create a very boring range now and just frustrate people.

LTCUSD Litecoin EMA 10 EMA 20 Pin Bar 15 May '21 03:00LTCUSD Price broke 334.86 support resistance level. Price pulled back into exponential moving averages and formed a pin bar. Entry at pin bar candlestick closing price.

DOGEUSD (Dogecoin / US Dollar) DOGEUSD (Dogecoin / US Dollar)
Entry 0.24939000 Closing Price
Target 0.44813000 Previous High Price
Optimal Entry is WHEN the Close Price, Open Price, High Price, and EMA 10 EMA 20 numeric values are close together. Candlestick Bar is a Pin Bar or Rejection Candlestick Bar like a Hammer.
Target Price is previous swing high.

SPY - Daily with trendlines and 50EMATomorrow will be very interesting. Looking to hold support. If not, watch out below.
Holding PUTS.
