XAU/USD Head And Shoulder Pattern Can Gold down ?
.
.
.
Gold Bull on all time high, now sentiment of markets make bearish potential.
Target prices gold on 1 projection yellow and 1.272 orange area (Extension) fibonacci.
.
*This for everyone for learn and me too 😁
Extensionfibonacci

Tatachem - Big Targets WaitingTatachem perfectly retracced from and made pennant...316 -320 is supply zone so take caution at that level. Targets on chart...

XAU/USD CORRECTION WAVE FLAG (Short)LAST POST OF XAUUSD FLAG BEFORE, ON CORRECTION WAVE FLAG PATTERN (3) TO (4) 0.618 TARGET DONE! AND I PROFIT WITH THAT.
SAXO:XAUUSD
NOW CORRECTION AGAIN TO RETRACEMENT OF 0.786 AND EXTENSION 1.272.
YOU CAN LOOK AT THE CHART, THATS RED LINE I DRAW SIMETRICAL WAVE. YOU CAN READ BOOK "Carolyn Boroden" fibo relationship.
SELL 1733, SL 1740, TP1 1720, TP2 1715
* "This analysis maybe not 100% win, you can use SL for manage risk, you can use them as examples of how to develop your trading system.
You will be successful by testing and evaluating them yourself".

The Power of the 1.27 Fibonacci ExtensionA solid currency trading strategy consists of entering a trade at the right place, having a stop that is properly calculated, and setting a reasonable profit target level that works time after time after time.
Many newer traders set too ambitious profit targets expecting the trade to be "the big one" and hoping it will help offset the losses they have accumulated.
However, a far more effective currency trading strategy is to set a reasonable profit target each time, not expecting the home run, and being satisfied with smaller profits which on a consistent basis will build the equity in the account surprisingly quickly once the compounding action kicks in.
Here is where the Fibonacci tool comes in.
This article assumes a trader knows how to use the Fibonacci tool which comes as a standard technical analysis tool on most charting software packages.
While the key retracement levels are 38, 50, 62 and 70 percent, two extension levels are commonly used - 1.27 and 1.62 percent.
The Importance Of Fib 127
It is the 1.27 level we are interested in.
Why?
Because price regularly gets to the 1.27 level, or at least within a few pips of it. Price also gets to the 1.62 level fairly often but not nearly as often as the 1.27 level.
So if you are trading with the trend, always a safe currency trading strategy, and price has pulled back to the 50 or 62 retracement levels, there is a very reasonable chance price will reach the 1.27 target.
If price pulls back to the 79 retracement level it may not go so far. If you trade from that retracement, you will want to take the first profit at the end of the swing as price may not extend beyond that point to the 1.27 or 1.62 level.
Some traders just focus on this currency trading strategy when going with the trend:
In at the Fib 50 retracement
Out at the Fib 127 extension
How To Use Fib 127
Here are some other factors to consider when using the Fib 127 extension:
Look to see if this level coincides with other factors such as
A previous key level of support or resistance on the higher time frames such as 1 hour, 4 hour, daily, or even weekly.
The 200 EMA ( Exponential Moving Average ) on the 1 hour or 4 hour. This often provides quite a strong level of support and resistance .
A pivot point (Central Pivot Point , R1, R2, S1, S2, or M1-4 levels ) calculated from the previous day's High, Low and Close.
Even when targeting the Fib 127 as the profit taking point, it is wise to trim a couple of pips of the limit order. So often price will nearly reach Fib 127 and pull back.
Yes it might go on to touch it later but in the meantime price retraces and you have to have the mental stamina to be able to handle that.
Many traders would rather just take a slightly smaller profit and save themselves one or two hours of price consolidation with the risk they may lose the profit altogether.
A solid currency trading strategy develops over time. A key ingredient is not being too ambitious. The Fib 127 extension level is a reasonable profit target you can use regularly to extract your wages from the Forex market!
Jan 01
Comment: Any opinions, news, research, analysis, prices, trade discussions, or other information contained on this website are educational in nature and merely provided as a presentation of trading strategies. Commentaries made on this website reflect our own opinions and trading techniques and do not constitute investment advice.
All information and material is for educational and entertainment purposes only and is not intended to provide financial advice.
I'm not a registered investment advisor.

Learn to appreciate fibonacci extension (Example)A solid currency trading strategy consists of entering a trade at the right place, having a stop that is properly calculated, and setting a reasonable profit target level that works time after time after time.
Many newer traders set too ambitious profit targets expecting the trade to be "the big one" and hoping it will help offset the losses they have accumulated.
However, a far more effective currency trading strategy is to set a reasonable profit target each time, not expecting the home run, and being satisfied with smaller profits which on a consistent basis will build the equity in the account surprisingly quickly once the compounding action kicks in.
Here is where the Fibonacci tool comes in.
This article assumes a trader knows how to use the Fibonacci tool which comes as a standard technical analysis tool on most charting software packages.
While the key retracement levels are 38, 50, 62 and 70 percent, two extension levels are commonly used - 1.27 and 1.62 percent.

VENTA USDCADTendencia bajista usdcad, retroceso fibonacci, doble techo en h1 y velas de indesicion en 1d, buscamos nivel 100% del retroceso asi esperando
que baje 240pips , tambien tenemos rompimiento de tendencia en h1 buscando la baja, paciencia y por esos profits

USDCAD SHORT TWING, SINGW & INTRADAY en las 2 entradas anteriores posteadas del USDCAD tomamos ganancia por un total de 300 pips ahora vemos como el precio llego a la zona marcada para buscar ventas en 4h y 1d y observamos que nos crea un patrón de doble techo junto con divergencia y confirmacion con fibonacci en temporalidad mayor, esperamos shift of momentum en 5M y tomamos una entrada a corto en swing, y la entrada en 1h la tomamos despues del doble techo y ahora esta dando reentrada al retesteo de la ema 20.

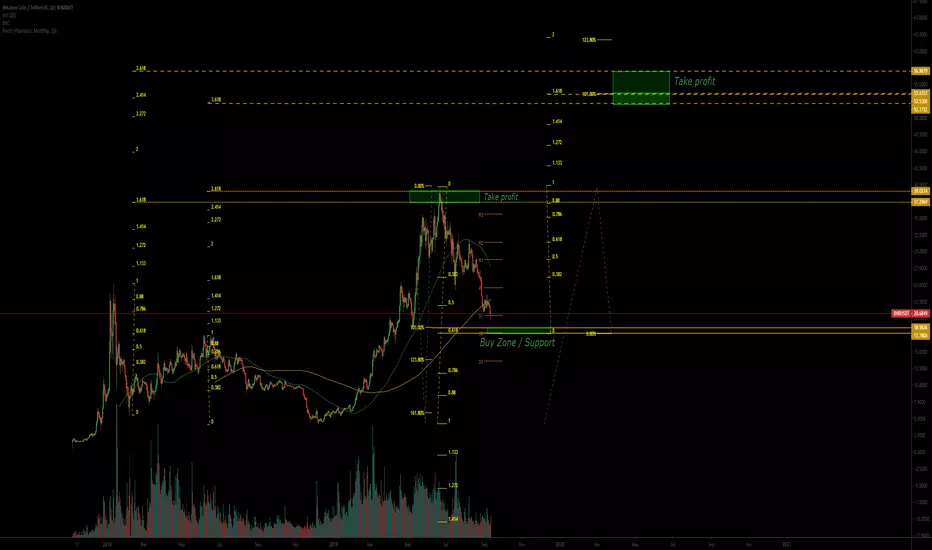
BNB Long - TermAnalysis on this chart was made only with Fib. Retracement and Fib. extension. Check out this precision of extreme Fibbonacci calculations. Stop telling me, that TA is not working ;) The bigger Time Frame, the more precise target :)) I´m sure with my next Target.
DIAGONAL CONTRÁCTIL EURGBP H1Tenemos una diagonal contractil en h1 con el oar EURGBP, confluencias entre la extension fibonacci 2-3-4 en el 78.6 % y el retroceso fibonacci 1-2 en el -27%, se espera que llegue a zonas del 100/ 127%

Has the Nasdaq (Market) Topped? I find this long term chart of the Nasdaq Index with Fibonacci extension levels applied, to be quite illuminating. For me it puts things into a helpful perspective.
By no means am I a "perma-bear" but I find this chart helps me to be honest with myself. Especially if I'm wanting to put money to work in this environment.
Prices have extended well beyond previous year's moves and have reached those magical fib extension levels of 1.618 and 1.78.
You may not agree with the method of analysis, the method of I've applied the fibs, or whatever....but I think most technical analysts could agree that these levels of extension often coincide with significant reversals. I'm not "talkin up my book" here, as so many seem to do on these forums, etc. Just some food for thought, and take it for what it is worth - just another opinion.
The big question now is where does a bottom form? Fortunately price, volume , sentiment, etc. will provide the appropriate clues at that time.

EURNZD!! Amazing Zone.EURNZD Respetando Area de reversion de precios (desde el 2010); Deberiamos Plantearnos ventas por el curso que esta formando.
---------------------------------------------------------------------------------------------------------------------------------------------------------------
EURNZD Respecting the area of price reversal zone (since 2010); We should raise sales for the course that is forming. FX:EURNZD

BTCUSD!! JUST HODL IT. Movimientos bajistas del BTC, un simple retroceso para seguir con su curso.
----------------------------------------------------------
Bearish movements of the BTC, retracement to continue with its course. BITFINEX:BTCUSD

USDJPY Long h1/h4Watching for a trend continuation with a retracement in the zone I show on my analysis.
