METAverse Percentage Plays since Facebook announcementQuick look at the %'s of coins that involved with gaming & virtual items
Some like UFO & RNDN and others were not able to be listed due to TradingView not covering them yet
SAND being the biggest gainer, while Axe Inifinity came up pretty poorly, which was a surprise
choose wisely or grab a load of all of them, big things coming in next year!
trade smarter, not harder!

META ~ FBFacebook if it can't break 320 will have possibility to come down and test the 290 area where I believe would be the best spot to start adding to Meta on the dip.
This one could still go either way but FB is undervalued here on the cut, it pulled a possible fake to the downside with more upside to come -- good luck trading and don't get too eager unless you're buying shares.

LONG FB: 20X FW P/E, 25% CORRECTION, MACRO SUPPfirst bids on FB at macro supp -25% off ATHs at 300ish.
1@300
2@280
3@255
4@245
5@225
time frame multi month
SL = N/A

$FB | WEEKLY WATCHLIST 12/6Still needs some time to develop, but bounced off falling wedge support for now. Also holding between 23.6-38.2% fib.
Markets must reverse in order for Facebook to reverse as well.

FB-Meta Platforms (Face Book)The wave you see in the future price on the chart is a schematic of a possible price trend and will not be formed just to clarify the possible price movement.
This is a personal analysis and should not be considered a criterion for buying or selling. Please pay attention to the Take profit and Stop loss

profit taking in facebook $fb ? failed high? neckline? Facebook price to sales multiple keeps declining as it failed to make new price highs. Is this an indication that there are sellers or profit takings moving out of this steady grower? Are investors not happy with the name change to META and unsure of the metaverse future? the support neckline we are current sitting is where the battle is being fought and voted on by buyers vs sellers. time will tell

$MANA to $9.1?!Mana is looking really good so far we have broke out retesting hopefully we hold the trend line if not I have drawn on the level to watch on the downside and targets for upside.


Daily Market Update - Stocks - FAANG - Twitter Look Out Below!In this video:
* Overall, I remain neutral to slightly Bullish Crypto, however...
* There are definitely more and more caution flags appearing!
* Today we look at the influence that the Stock Market might be playing on crypto
* We start with the FAANG stocks: Facebook, Apple, Amazon, Netflix, and Google
* We look at Twitter
* We look at the S&P, Nasdaq, and Dow Jones Industrial Average
* And we finish by looking at our market leaders in the crypto space
* Be careful out there traders! The market is on edge.

MANA: HTF FractalHTF Fractal taken from previous price increase, when stretched so that the beginning of the run fits the beginning this current run, seems to be somewhat predictive so far.
Is this a crazy price target? Yes.
May it be warranted? Possibly...
MANA is now a direct competitor to 'META' (formerly, 'Facebook'). Meta's current market cap is ~880 billion. MANA's is around 8.6 billion.
If MANA had Meta's market cap (so assuming some scenario where MANA becomes THE metaverse, beating out Facebook /Meta and all other competitors), that would put MANA's price at ~$482.
Full disclosure: this isn't so much a serious possibility in my mind, at least not yet, I'm just posting this to see how this theory/ fractal pans out; mostly just curious.

Facebook ( Metaverse) to Test 315$ and bounce back to 338$Facebook ( Metaverse) to Test 315$ and bounce back to 338$

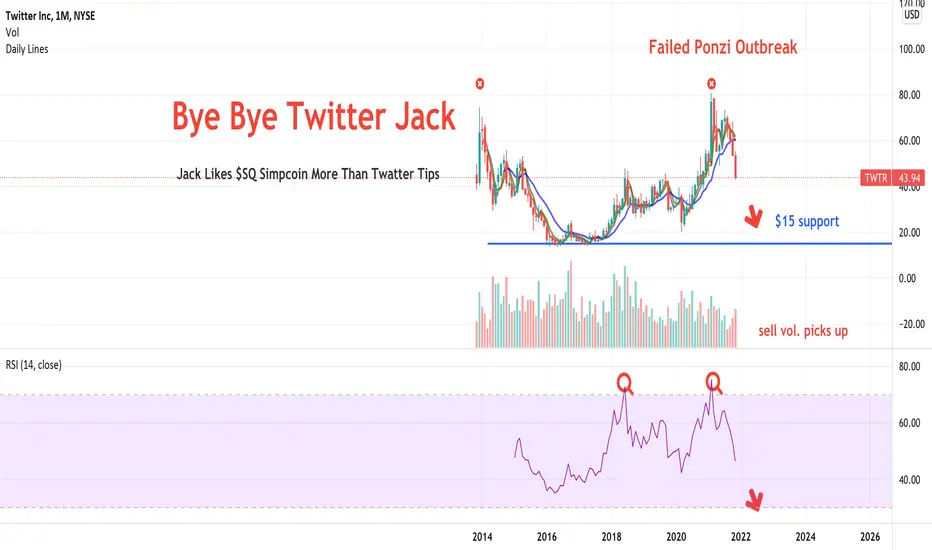
Twitter $TWTR Crash - Bye Bye Jack - BUY Volatility $VIXYADVERTISING MODEL PLATFORMS CRASH!!!! The old 2digit tickers they try to run and hide from. Gross. THAT'S WHAT DECENTRALIZATION FIXES. *ADVERTISING*.
Notice Jack is out when $FB zuck changes their business name to META. WE ARE LAUGHING. Never would I ever!!
Everybody has their own coinage at this point. Sorry Jack. Sorry Zuck. No chance. Both have got to stick with #simpcoin & $SQ until the Digi Dollar puts it to rest. They're all echochamber FEE VULTURES. They don't care which crypto you pass around. They take fees from the system. Ponzi Poggers. Storytellers. NOT INVESTMENT WORTHY.
ETHEREUM IS JUST AS GREAT AT $100. OH MY. $10????
#cryptocrash
Go Gary G!!
#kingdollar
Buy $VIXY VOLATILITY
Volatility Boom. Go small caps.
#cannabisreform
$KERN
$MSOS
$PSDN
Cannabis Saves Lives. Federalization #comingsoon
Facebook - Back to the top?-Here we are back with the stock market again. Where are we headed? Everyone expects different outcomes. We all expected November to be harsh due to the tapering talks but nothing really happened. Then the new virus coming from Africa hit the market, everyone expects something, but again, market is not really moving in any particular direction.
-Since the beginning of November we are stuck around $170 with TQQQ. So where to go now? We suggest going for instruments and strategies where you can benefit from this sideways movement.
-Facebook is a great stock to bet on, both due to the financial situation and the new developments within the company (META). Our target is $360, but it might take some time for the stock to hit that level.

FB - STOCKS - 17. NOV. 2021Welcome to our Weekly V2-Trade Setup ( FB ) !
-
4 HOUR
Bearish break towards previous highs.
DAILY
Expecting another push to the upside..
WEEKLY
Great price action, looking for more bullish breakouts..
-
STOCK SETUP
BUY FB
ENTRY LEVEL @ 342.58
SL @ 323.06
TP @ Open
Max Risk: 0.5% - 1%!
(Remember to add a few pips to all levels - different Brokers!)
Leave us a comment or like to keep our content for free and alive.
Have a great week everyone!
ALAN

What do you think?the price reached support. Two scenarios are possible here. after such a fall, it is easier to expect a breakout. What do you think?

ROSE Falling Wedge Long Opportunity Charts published are based on technical factors using patterns, structures and price action and no chart is 100% guaranteed and market volatility can change the trade setups or plans anytime. We share the charts and analytics for education purposes while you should follow them at your own risks. We always recommend doing your own analysis before investing in high risked market instruments.
Not a Financal Advice.

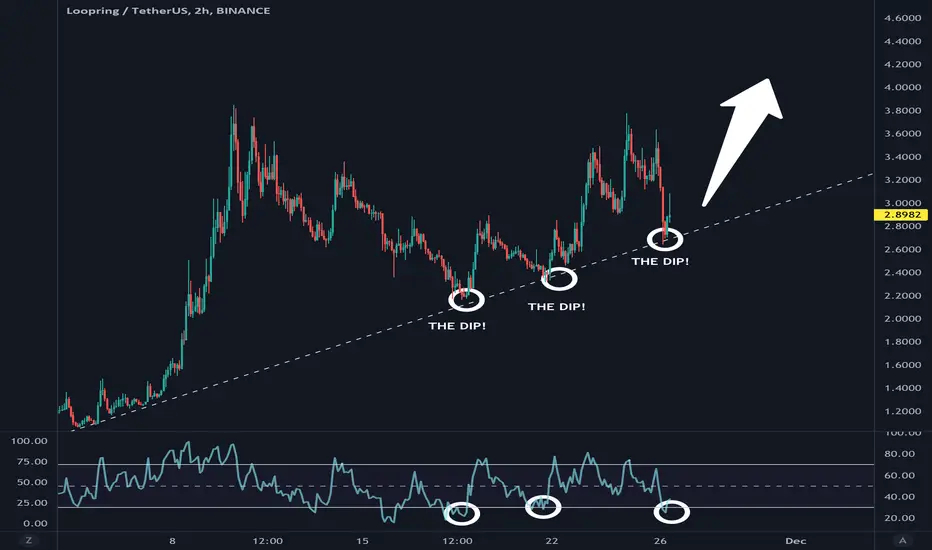
Loopring [ LRC ] - BULLISH. The Dip!!Loopring has finally fallen into the first dip that I feel comfortable buying since I heard about it. Very nice value area here.
FBFacebook seems to be targeting 355-366 on a bullish move. I really want to see this hold 336 for a move to the upside, if it can't hold that lvl it will unfortunately see downside momentum ! Good luck on the trades but I'm very confident on Facebook leading QQQ ! !! ! !! Happy Thanksgiving one last time !

FB/Meta - Resistance Turned SupportWeekly chart for FB and newly named Meta
It can be seen along the 1/1 Gann line that a previous resistance (red oval) has turned into a support (green oval)
The 50MA can also be seen as a point of support in both points
Now is the time to go long, with the new Metaverse pursuit and the consistency of price displayed through history by Meta

Nowpossible scenario. The price broke through the resistance. Now I expect a pullback or further growth

FB Meta Platforms sold by ARK InvestIs it overvalued?
Is a crash about to happen?
ARKF sold 43,188 shares of FB yesterday, equivalent of 14.55Mil usd.
And it`s not the first time!
FB has a strong support in the $285 area!
Looking forward to read your opinion about it.

🔥 ROSE Facing Massive Resistance: Dump Or Break Out?A little while ago I made an an analysis on ROSE's bull-flag break out, which was a great success.
In the meantime, ROSE announced that they're going to use META's platform, which launched the price up and the token doubled in price in a couple of days.
As of now, ROSE is facing very strong resistance around the trend line which connects the two last tops. Chances are that ROSE will reverse from here and move back towards the lower support of the rising wedge. However, a bullish break out is likely, assuming that BTC sentiment will get better. The first option is more likely imo.
Happy trading!

Meta, 22 Nov. Will the Head & Shoulders Work Out?FB printed a large inverted H&S pattern and consolidates at the neckline. However, price is currently in the 50-61% reversal zone so that we need to observe positions carefully.
Elliott:
We can count a wave (i) and wave (ii) in blue, which retraced precisely 50%. Now we count the unfolding wave (iii) on a smaller degree (green waves).
Geometry:
Price reacts nicely to the current pitchfork. A breakout above the upper boundary (blue dashed line) confirms that we are indeed in a wave (iii), because it would also catapult price above the .618 retracement fib. This is important.
Gann:
Support: 340, 312
Resistance: 370
How I trade it:
The idea is to trade the inverted H&S pattern with an entry above the Gann level (341). The target of the pattern is 383. The 355 level (.618 retracement of the previous wave down) is critical because price could drop from here. In that case we are able to close at breakeven and invert the trade.
