Good opportunity to go long!If the market has been going up, it''ll continue going up. If it has been going down it'll continue going down. In this case it has been ranging up and I assume it'll continue going up and it also broke above the Daily resistance zone.


NASDAQ- Off to 14350Updated Nasdaq chart.
Markets are volatile but still mostly sideways. My updated NASDAQ chart shows an ascending channel and a take profit level at 14350 where resistance will need to be tested to see if the price can go even higher or if it will bounce back down.
the FXPROFESSOR
PS. i KEEP BUYING FACEBOOK AS WELL AS AMAZON, GOOGLE, APPLE THIS WEEK

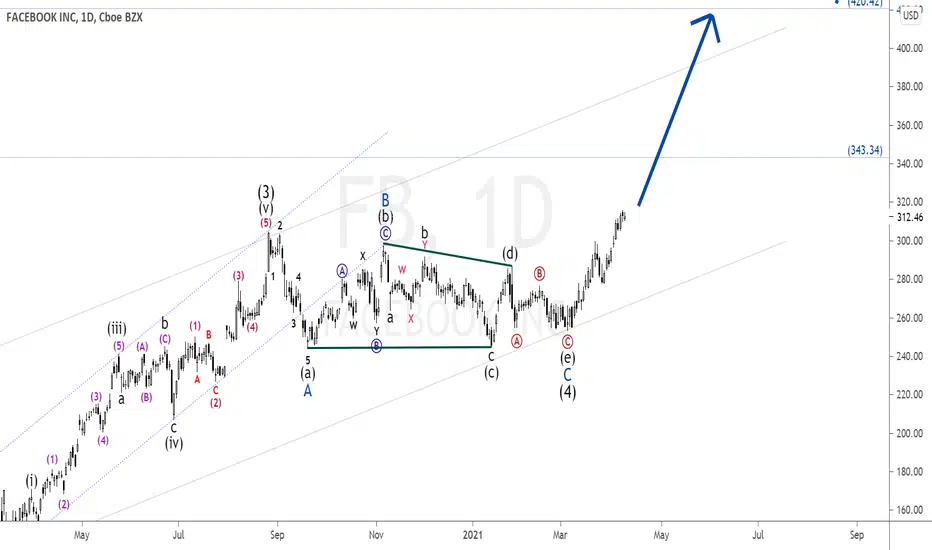
FACEBOOK - Was a Great Time to Buy but we need HIGHERFurther to my previous idea , Facebook timing was a great for a Buy, as expected/prognosed.
Now the price can do a a lot better and go higher, after it rose over 8% after my post.
Take a look at the projection here, on the bigger chart

FB Ready to Soar Past the Psychological Resistance on Robust EPSFacebook's earnings rose by 48 per cent from a year earlier, causing the company's share price to explode by more than 7 per cent in the pre-open hours.
It has recently broken out above the upper boundary of the Ascending Wedge, which signifies the strong bullish sentiment in the market.
The uptrend was resumed after a minor throwback to the Wedge from above, and the price has broken out above the psychologically significant resistance level at 300.00 since then.
Notice that it is currently consolidating above this major make-it-or-break-it point, which is converging with the 20-day MA (in red). Given the record-breaking earnings data from yesterday, Facebook's rally is more than likely to be extended further into uncharted territory next.

Fb--> did u caught the move
Posted few days back that soup in the cup is getting hot and it also had break out before earning. Post earnings it is 5 percent up . I think it can fill up the gap and will run up. Check my previosu fb chart 4 days back for more infor
hope you are enjoying my analysis, ideas here are for entertainment and education these are not trading advice

BUY FACEBOOK or keep in te wallet/ACHETER ou Garder BUY FACEBOOK or keep in te wallet/ACHETER ou Garder
Hello everyone, according to my graphical analysis of PAYPAL , there is a high probability of an increase.
Bonjour à tous, d'après mon analyse graphique PAYPAL , il y a une forte probabilité d'augmentation
CHALLENGE EVERY DAY ONE TECHNICAL ANALYSIS FOR A MONTH DON'T FORGET TO SUBSCRIBE AND PUT A LIKE
DEFI CHAQUE JOUR UNE ANALYSE TECHNIQUE PENDANT UN MOIS N'OUBLIEZ PAS DE VOUS ABBONEZ ET DE METRRE UN LIKE


FACEBOOK - Time to Buy some ZuckerStocks?Facebook looks great on the chart.
earnings expected to be great
Facebook plans going 'digital payments''
Facebook streams Spotify
I like what i see, I like what i hear. I am buying
the FXPROFESSOR
ps. Last time i gave you a share it went VERY well. Check the idea below

FB to buy at 268-253Good weekly demand zone at 268-253, this is a good zone with good RR to enter the long trade.

Facebook bullish ER runup planNYSE:TWTR NYSE:PINS NASDAQ:FB Facebook is currently looking GREAT for a rally. It is currently bouncing off 200 EMA (very strong support), at .236 fib level (bounce region?), potentially breaking out of the bull flag pattern, 6 oscillator bullish divergence, AND Earnings on Wednesday? I smell GREAT chances for a rally especially with a lot of other Tech and social media stocks having earnings this week. This should be a great week for social media stocks like Facebook and tech stocks in general. Currently in a squeeze but I am expecting that we are flying on release. Planning on buying a few calls on monday, and playing the ER run up. Good luck to anyone thinking about hopping in! Lets make some money!! If you liked this, follow me on twitter to see all my new TA @greg_trades_

Facebook is retracing of a breakout of a consolidation periodFacebook is ready to bounce hard after a pullback to the resistance level of the previous consolidation period.
Target Price: 330

Facebook Bullish IdeaThe analysis is as follows
It appears that we are in wave 5 of a greater trend move.
This is confirmed by the fact that we have just broken out of a triangle, and according to Elliott wave principles, the triangle always and only precedes the last move of the greater trend.
In addition to being the wave 5 of the greater trend, within the wave 5 we are in wave 3, of 3, of the wave 5. As a result, I expect to see facebook go up much higher in the near future.
I believe we are in the wave 3 of 3, since the recent move from march 25th to april 8th was a clear impulsive move. In addition to this, the wave before that was also a clear impulse. The reason I am not labeling this as 1-2-3, is because the wave 3 would be incredibly short in time and price. I highly doubt this is the case, since if it were, the wave 5 would have to be ending very soon, and for the wave 5 to end with such little price moves and so quickly, it just isn't realistic.
Since both of these moves are contained within parallel lines, I am looking for a big move up, to breakout, and confirm that we are in the wave 3 of 3.
I would be concerned about my wavecount, if the price continued to fall below 298.
Target for the wave 3 of 3 is the 1.65 which is around 345-350.
The next target is the 2.00 which happens to be the 1.65 projection off of the greater wave 1.
I am anticipating that his move will be made very swiftly since it is a wave 3 of 3.


FACEBOOK INC. Bull waveHere is my Facebook Inc. Wave count. FB Inc. is heading to finish off its wave (5) - intermediate count.
Below are my price targets;
1st target = $343 /share
2nd target = $420 /share
3rd target = $545 /share
Disclaimer: This is only a trading idea and must not be taken as a trading signal.
Please support this idea by leaving a like or comment below 😊.

FB Stock 10/04/21 Analysis 4H Chart- Trend Analysis -
📑Value: 6/20
📈Growth: 16/20
💰Profitability 20/20
🚀Momentum: 18/20
💸Earnings: 16/20
🖇️Total Score: 76/100
Data:
Volume 15.98M
Average Volume (3 months) 21.17M
Previous Close $313.02
Open $311.52
Shares Outstanding 2.41B
Technicals:
( Simple Moving Average )
10D SMA $297.51 (+5.03%)
50D SMA $274.65 (+13.77%)
200D SMA $266.95 (+17.05%)
Market Cap $891.38B
Total Debt $11.18B
Cash $61.95B
Enterprise Value $840.60B
Revenue $85.97B
Gross Profit $69.28B
Net Income $29.15B
EPS Diluted $10.09
Free Cash Flow / Share $8.29

FB FINAL WAVE RUN UP COMPLETE? If it uses the red line as support, then bull. If not, wave 5 is probably complete and look for retracement levels. If bull, look at the rectangular outlines for long exits/short entries.


FACEBOOK - Sell Setup Forming!Hello everyone, if you like the idea, do not forget to support with a like and follow.
FACEBOOK is approaching a strong daily supply in green and round number 300.0 so we will be looking for sell setups on lower timeframes.
on H1: FACEBOOK is forming a trendline in red, but it is not valid yet, so we will be waiting for a third swing low to form around it to consider it our trigger swing. (projection in purple).
Trigger => Waiting for that swing to form and then sell after a momentum candle close below it (gray zone)
Until the sell is activated, FACEBOOK would be overall bullish and can still test the 300.0 level or even break it upward.
Good luck!
All Strategies Are Good; If Managed Properly!
~Rich


Facebook - A Stock to Own.Please see our link where on 3rd of March we highlighted that you should watch Facebook stock as it was making an interesting setup.
Here we are, the setup is very clear and now we are re-testing. BULLISH.
Price target: 340$
Stop: 250$
