Facebook plans to release Libra crypt currency in January 2021.Such triangles are traded on the fact of breakout.
Of course, the news is interesting:
Libra will still be
FT: Facebook plans to release Libra crypt currency in January 2021.
Initially, Libra association will launch only the crypt currency to the dollar.
Facebook may release Libra crypto currency in January 2021, writes. Financial Times with reference to the three people involved in the initiative. The currency will be in an even more limited format than originally planned.
Libra Association, which in addition to the social network includes Lyft, Spotify, Uber and others, will launch only the cryptovalue linked to the dollar, told the publication one of the sources. According to him, Libra, tied to the euro and other currencies, as well as multicurrency token will be launched later.
The exact launch date of Libra will depend on when the project receives approval from Finma, Switzerland, but it can happen in January, three people said. The company filed the application in May, Finma does not comment on it.
The Novi crypto wallet is already "ready in terms of product", but will not initially serve all regions as the company wants to focus on large money transfer channels, one source told FT. According to him, Novi needs its own license in every state of the United States - he has ten more to get.
Libra and Novi refused to comment on the publication.
- The launch of the Libra crypt currency and wallet for its use social network reported in June 2019. The company became partners of 27 organizations, including large payment systems.
- The company planned to release the currency in 2020, but faced criticism from regulators: those were afraid that Libra could affect the exchange rate of the dollar or euro, as well as promote money laundering and financing terrorism.
- In October 2019, the project left PayPal, while Visa, Mastercard, eBay and several other companies refused to cooperate.
- In April 2020, the social network decided to review the project and offer users currencies produced by central banks, such as the dollar and the euro. In May, the company created an independent "daughter" for the development of the crypto pocket to show that Libra does not belong to the social network, and Facebook is only part of the association with others.

FB bullish???Not sure what way this may go, would appreciate some help.
maybe a pennant bullish pattern but this is over a few months, not weeks (so maybe a triangle pattern?); if so is there any indication as to whether itll go up or down?

FB Pop, The start of a move higher?Keeping an eye on FB as today's pop could be the start of a move higher

Facebook FB observations - Back into wedgeClimbed approx 2.5%, one FIb level to .5 today
Now that it's back in the wedge there's high probability near term strike price on the converging top line of the wedge and the .786 Fib level at $291-ish

Naspers Buy-SignalAfter a very long side movement there is a new buy-signal at 177$. The goal would be 249$ now.
Naspers is a big south african company who owns 30% of Tencent.


Oversold, price action getting tighterBreak of trend line would confirm. Some minor support/resistance levels shown in addition to the fib retracement.

my hedged trade on FacebookHi everyone,
This is another trade taken today: Long Facebook vs Short JC DECAUX.
Facebook has lost about 20% from its august top.
Fundamentals are still strong (ROE, revenues, margin, cash flow), the management is strong as well.
I choose to hedge it with JC DECAUX, traditional advertising industry, with weakening fundamentals (debt and cash flow are bad), Moody's outlook is negative, and the management is not that good (actually they are the heirs of the founder, compare with Facebook that is run by its founder...).
This is implemented with barrier options maturing in 90 days.
Comments are welcome!


Book of FacesFB made a turn very near its most prominent resistance... I feel that this is close enough to it to pick up its influence and head south... completing a head and shoulders pattern ?
Keep an eye on these larger time frame support and resistance vectors... each one is made of 3 points and then retires.

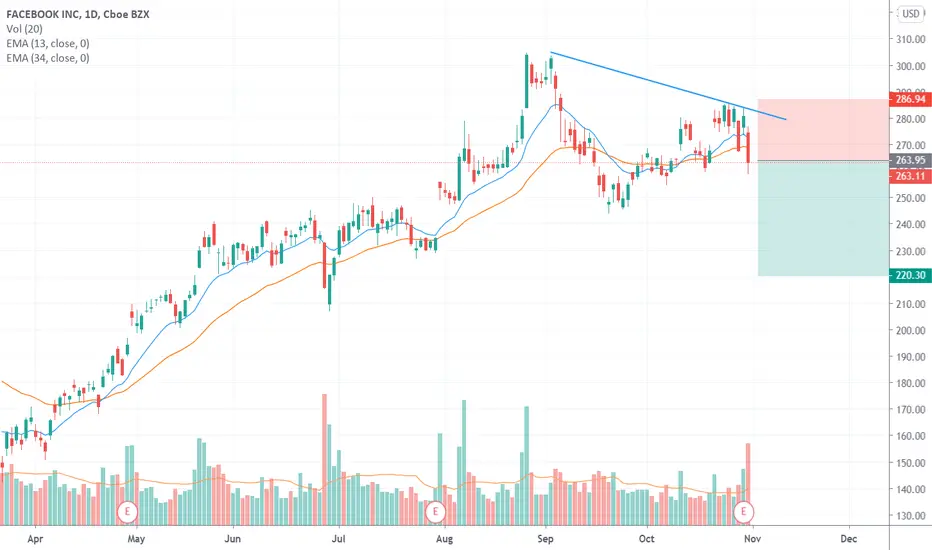
Sell Facebook 1/11/2020Facebook share could not reach the previous high at 302.5
With lower volumes on the upside and higher volumes on the decline
So it can sell
Targeted 220.3
Stop Losses 287
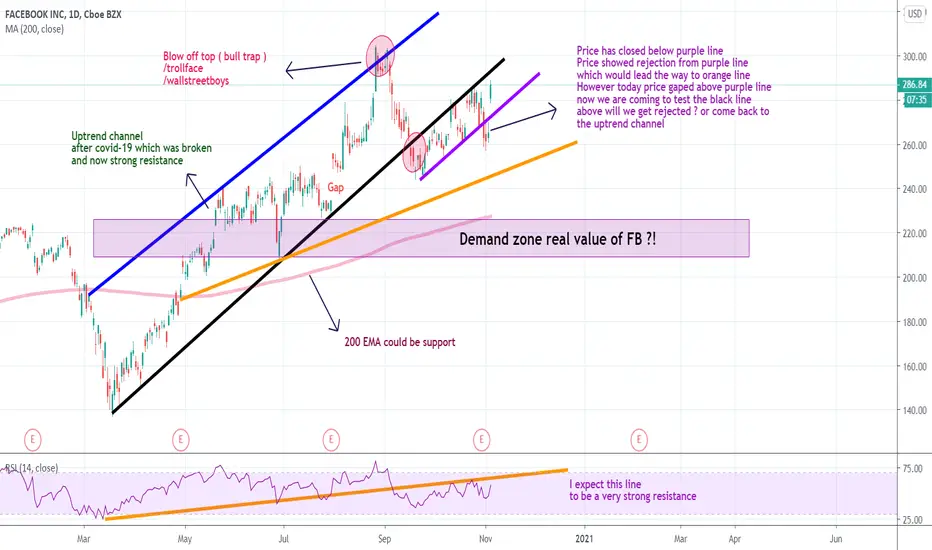
FACEBOOK path and directionHello everyone
This is my Facebook idea for Daily time frame
watch key notes for more detail on chart
for any question feel free to ask :) good luck
AAPL needs a push from $SPY to continue after the break.If you watched my last video I set two levels as my prediction from AAPLS range today. It respected it well. Other Tickers such such as $NIO and $CVS which I Signaled in my channel. Held up well against the markets downside today. AAPLs divergence stayed true today as we saw a tight range , but regardless we continue up I believe. If you are long on AAPL make sure you are well hedged with UVXY or VXX calls. If i am bearish on this i am looking for a retest of the previous resistance turned support. The market makers are strong...but are robinhooders stronger?

Bearish on Facebook. NASDAQ: FBI was looking through the hightech QQQ stock index and thought I might do a review on some of the major players in that index. FB had a monumental impulse,and it looks like we are coming to an end. RSI shows slowing momentum, EWO is in agreement with my fractal mapping. We are painitng ABC patterns here. If my count is right then we are correcting, and this too will drop unless FedReserve doesn't step in and start printing even more money. I will be watching this space closely. NFA .

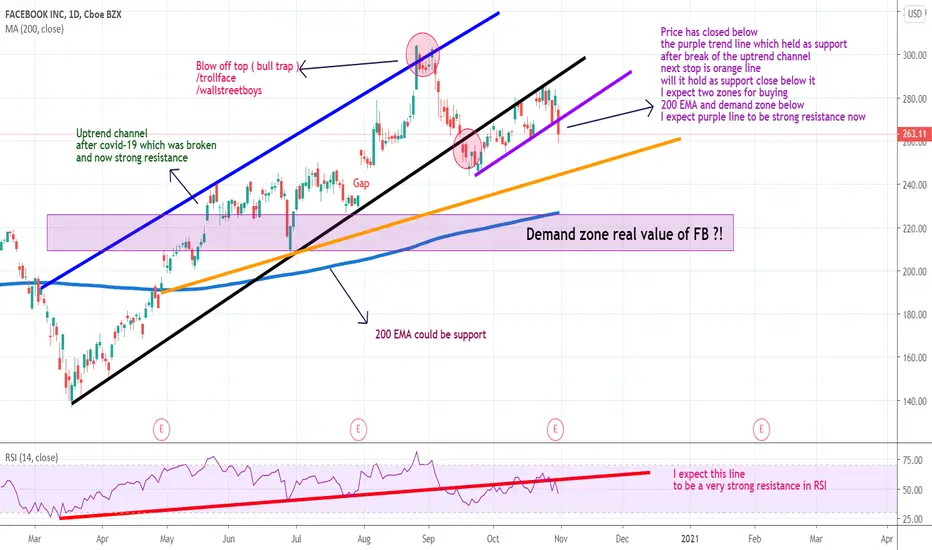
FACEBOOK path and direction .. elections or overvalued ?!Hello everyone
This is my Facebook idea for Daily time frame
watch key notes for more detail on chart
for any question feel free to ask :) good luck
Note: Facebook has broke two very important support
next we have three supports zones below see chart for more detail good luck !
FACEBOOK trend-continuation setup!Hello everyone, here is the top-down analysis for FACEBOOK, feel free to request any pair/instrument or ask any questions in the comment section below.
If you like the idea, do not forget the like!
Best of luck!

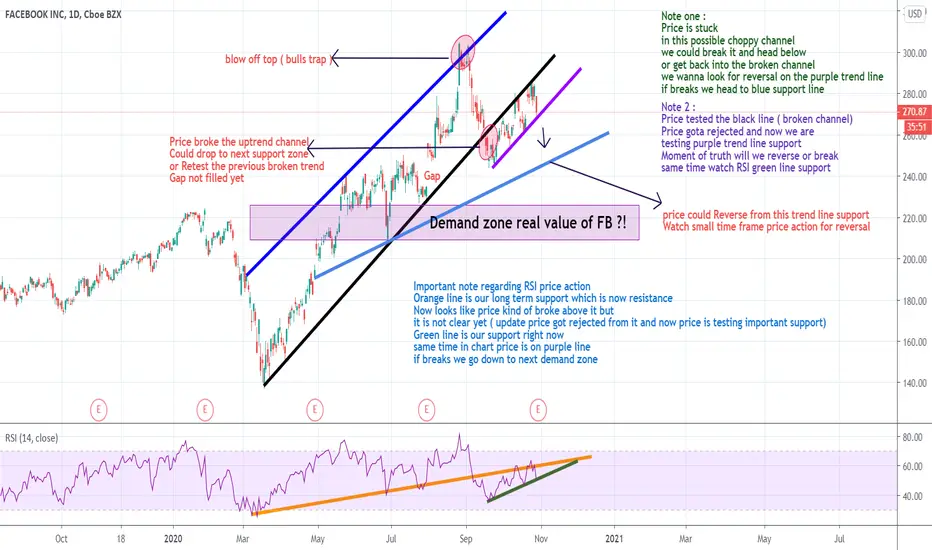
FACEBOOK path and direction ( moment of truth here we go ... ) Hello everyone
This is my Facebook idea for Daily time frame
watch key notes for more detail on chart
for any question feel free to ask :) good luck
Note:
Price got rejected from broken channel
Price is testing important support purple line if close below it is very negative for uptrend ..
good luck everyone be careful now Europe lock downs and USA elections is very volatile
2020 Tech Bubble - Nasdaq100 vs. GNLNThe 'ole "Fliparoo". Overhyped $FAANG is coming down hot. No touch. Go Long USA MSO $GNLN. Hold for many years. More Created Content at Risk Savage Linktree.
THC saves lives! #federalize


FACEBOOK Good Idea BuyI am a consultant for anyone who needs a consultant, I see that Facebook will GO UP IN FEW HOURS when the market open
1, When you decide to use my ideas in your trading, please contact me to inform you of some things and monitor the position together without specifying a take profit or stop loss, we will decide when to open and close the position
2 (When I set the take profit and stop loss in a number that does not mean that the price will reach it, I gave a buy or sell signal only according to the analyzes I made in the chart and delete it later, in the order to share it with you so that you have a clear picture and read it clearly, thank you!)
3, you can try me for one or two weeks to decide to work with you and give you signals about buying or selling

FB/SHOP Sympathy playPartner for e-commerce looks ready to break downtrend with some positive news. Took a while to digest the move from 78 to 162 on the announcement.

FB short setupThis is how I see it. There is a big gap to the downside. Price is likely to cover it.

FACEBOOK path and directionHello everyone
This is my Facebook idea for Daily time frame
watch key notes for more detail on chart
for any question feel free to ask :) good luck
