Comparison of the best technology companies since 2015.Comparison of the best technology companies since 2015:
#NAMAFG Netflix Amazon Microsoft Apple Facebook Google

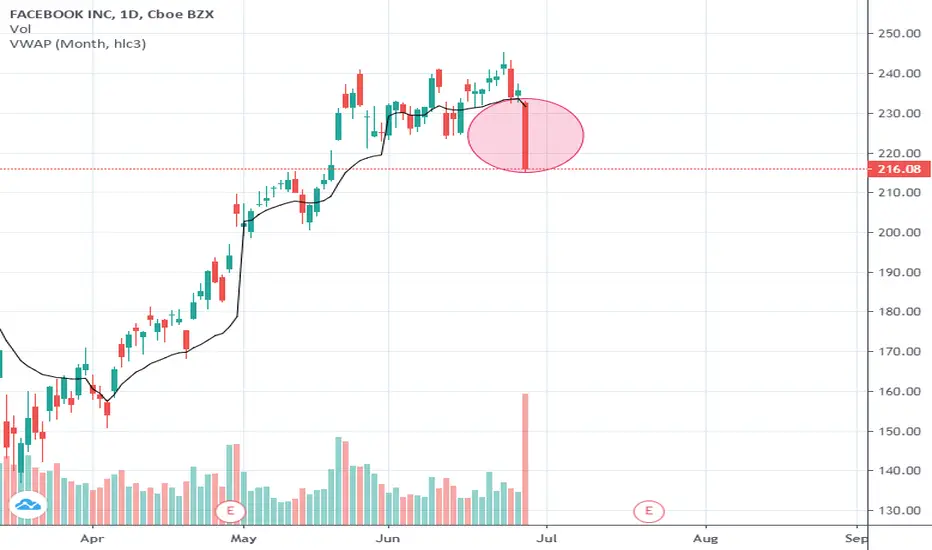


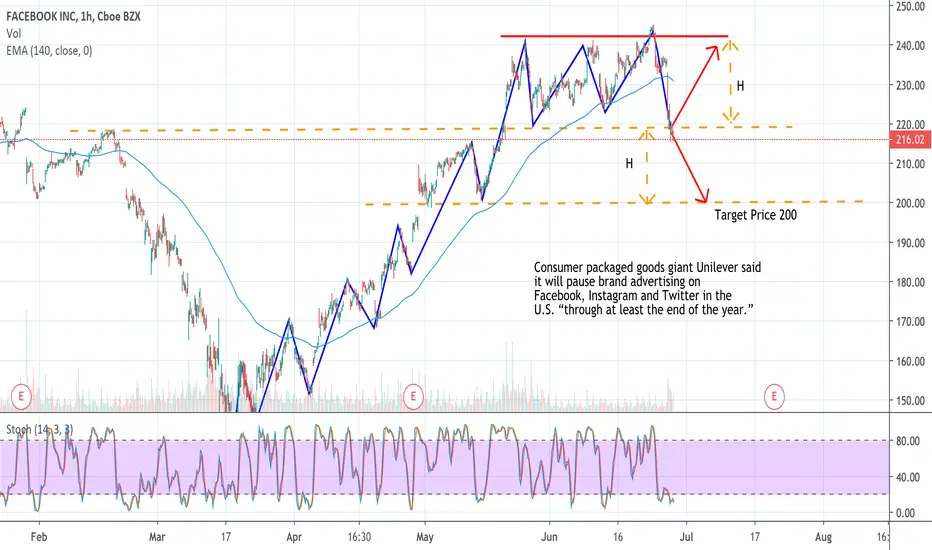
Facebook - Technical AnalysisThe idea is to hold as prices might keep going down due to the fundamental analysis. More companies might stop advertisements on Facebook (and Twitter).
The idea is to invest always in the trend direction, as the trend is bullish and now the prices are in a retracement stage, the wisest option is to wait to go long again for a long term investment.
Fundamental News:
Unilever pauses Facebook and Twitter advertising for rest of 2020 due to ‘polarized atmosphere’ in U.S.
NASDAQThe time has come for the Nasdaq to begin the dump, looks like there will be some blood on Monday & Tuesday, S&P 500 is already testing the 50 & close to testing the 100 , 200 ema so NASDAQ will likely follow suit, and there should be a dead cat bounce off the ema B4 a larger correction starts to play out.

FB Facebook D Timeframe Chart AnalysisFB as today had attempt to climb up again without success. For options/stock traders, this represents a nice opportunity to wait and react.
Lets see what the next days ahead brings to the table.
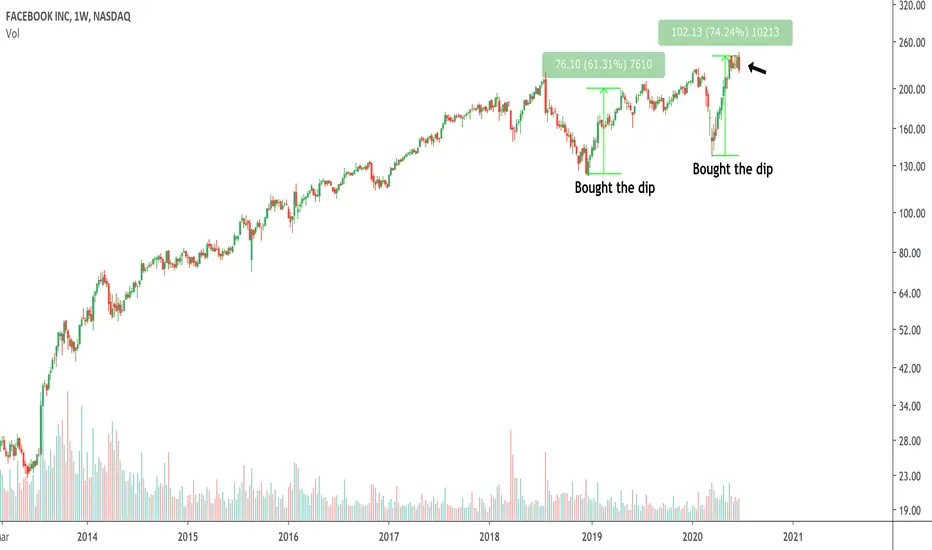
Facebook loses ads, but does it matter?Facebook has gone through some big drops the last 12 months or so. Like really big. And people continue to give Facebook a hard time.
No one seems to like Zuck. I get it.
But, someone out there is accumulating Facebook on every drop. It crashes, roars back to all-time highs.
They are being pressured today after some ad sales drama. Companies are pulling ads. Does it matter? Should we care? I will be watching closely. Many people have called for the end of Facebook but they continue to grow and hoard cash.
Occulus, WhatsApp, Instagram... and the list goes on. Watch it carefully.
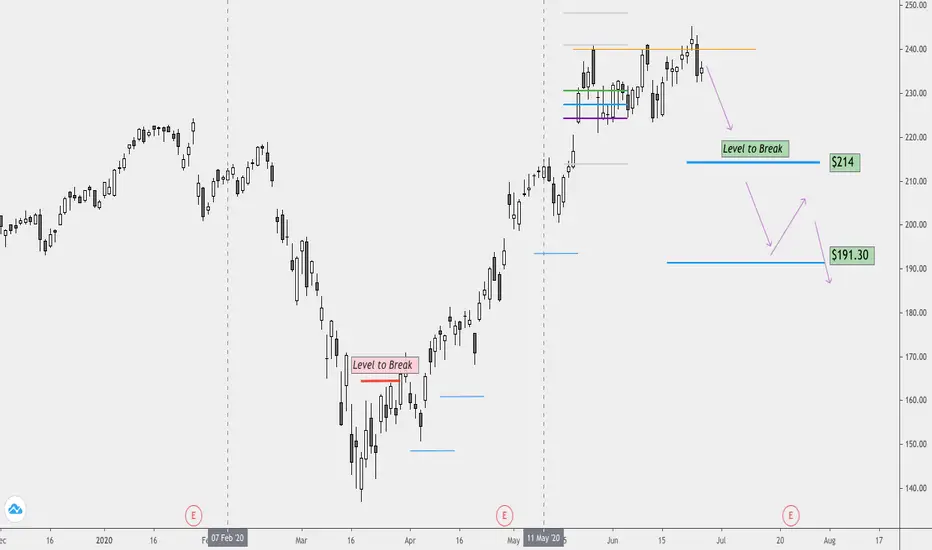
Possible bear pennant on $FB Looking if we break below 233 at risk for a downside move to $224 area.


💰 Will Resistance Hold For Facebook? (FB)💰 LET'S GET INTO SOME FACEBOOK ANALYSIS!💰
1️⃣ First off SMASH that LIKE BUTTON & Give us a FOLLOW for DAILY ANALYSIS! ❤❤❤
(Overall Market Sentiment) 🤷♂️ Neutral
- 3day Chart
- Green Engulfing Candle
- 3/3 EMA DOTS Green
Facebook is sitting on a key level of Resistance but has not shifted on any indicators yet for the 3 day. Let it play out the rest of the week and see how it closes.
Best of luck to you and all of your trades this week! 🤜
Drop your charts and comments down below, share with us what you think is going on in the markets! ❤❤❤
Thanks for checking out our analysis! ✌😁✌
🥇MLT | MAJOR LEAGUE TRADER

WALT DISNEY COMPANY daily analysisHI FRIENDS
THIS GRAPH SHOWS WITH A HIGH PROBABILITY A LOW TREND UP TO THE LEVEL OF 78.86 WITH OF course THE VIGILANCE OF CHANGE IN THE MARKET TOWARDS THE OPPOSITE

Elliott Wave View: Facebook Should See More UpsideFacebook (ticker: FB) shows a higher high sequence from June 15 low, favoring further upside. The 30 minutes chart update below shows that the stock ended wave 3 at 241.75 high. Afterwards, the stock did a pullback in wave 4. Wave ((a)) ended at 223.55 low and wave ((b)) bounce ended at 231.66 high. Facebook then extended lower in wave ((c)), which ended at 222.53 low. Up from that wave 4 low, Facebook resumed higher in wave ((i)) as 5 waves impulse Elliott Wave Structure. That rally in wave ((i)) ended at 238.46 high. From there, the stock did a pullback in wave ((ii)), which unfolded as a zig-zag Elliott Wave Structure. Wave (a) ended at 233 low and the bounce in wave (b) ended at 237.88 high. Facebook then declined lower to end wave (c) at 231.73 low.
The stock has resumed higher since. It has broken above the previous wave 3 high, confirming the next leg higher in wave 5 is already in progress. From wave ((ii)) low, the stock extended higher and ended wave i at 237.59 high. The pullback in wave ii ended at 232.15 low as a zigzag Elliott Wave Structure. From there, the stock resumed higher and ended wave iii at 240.83 high. Wave iv then unfolded as a triangle and ended at 238.75 low. The stock then pushed for another high in wave v, which ended wave (i) at 234.92 high. Wave ((ii)) pullback is currently in progress. Near term, while pullback stays above 231.73 low, expect the dips in 3,7, or 11 swings to find support and Facebook to continue to extend higher.

$FB Bullish Breakout of Structure.Facebook held up the breakout today (6/23). It's currently in consolidation right above it's previous flag. Due to the strong fundamentals of this stock I believe that it continue to rise. I'm long on Facebook as it has proved that it is resilient to COVID news. Lmk your thoughts below in the comments.

facebook analysis in 15 min (BIG SIGNAL FOR BUYING)we have here a big signal of buying facebook its 85%


$FB to $250 | Bull FlagCaught the breakout the first time, let's grab this one too while we're at it...
The Plays (Rating 7/10):
FB $252.5 Call 6/12 @ $70
FB $255 Call 7/2 @ $145
Do not trade this, not financial advice
DotcomJack | Easy Loot | The Dotcom Takeover

Facebook in a decisive Range !!After accomplishing 5 waves to the up, Facebook is struggling on a Range box.
We wait for a break out either to Up or Down before considering a position.
The RR will be at least 1:5

$FB New 52 High Breakout IdeaNASDAQ:FB traded quite heavy today and met with heavy sellers. All time highs just above worth a try over $240 for me.


facebook analysis in 15 min (SELL SIGNAL)after this hight tendance and this great volume you have to wait the next red candle thats confirm 90% of selling

Facebook would short -9.34%Facebook has broken trend line and would now move to previous demand zone!!!
