FB: Longterm Short TradeGood Morning TradingView Family!
Today we are looking at the FACEBOOK stock on the larger timeframes. Please note that im not that much into stocks and most likely trade currencies!
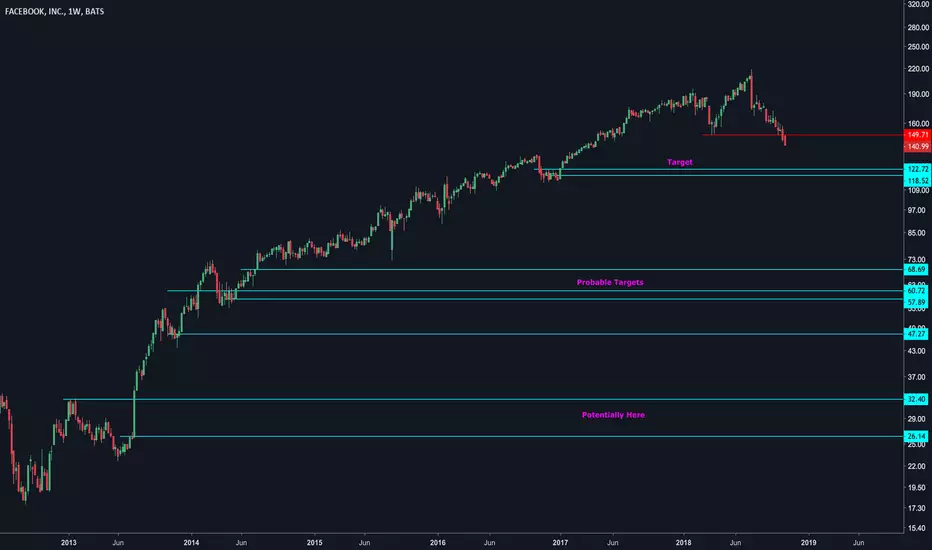
But this longterm short setup got my eye. Price from FB did break through the 200 Dollar mark and now is consolidating. From this point on i really like to see a larger correction to the downside.
First potential price targets are around the 181.00 Dollar area.
Wishing everyone success and a great trading day!
Facebooksetup

223.40 is next target for FBWe'll be looking to buy facebook till 223.40, we can therefore buy every dip...

Facebook - Bearish Divergence. FBNASDAQ:FB is looking extremely bearish. Expect a drop
#facebook #fb #short #bearish

Facebook Short +8% Max Profit PotentialReading some of our Spectro M and considering some of bad press FB is getting due to shady partnerships with government entities for content censorship and monitoring I'd bet on a bearish short-term call.
The Volume Analyzer, the color under the candles just went red, it's on precision mode so it's pretty fast and reactive.
We just had a Spectro M Warning,
Targets for profit and risk-management are all provided by all our Smart Adaptative Fibo Algo.
I've been testing Fisher for some entries and we just had a cross so - I'm in!

FacebookShorted FB on this last dead cat. Peak Social! let's see where regulations and fines can take us. Target 1 94 dollars

The FALL of Facebook Facebook in technical terms is screwed.
All the lawsuits and bad press surrounding Facebook over the past year has forced its price lower, both technical and fundamental analysis look bad for Facebook.
You can see from our chart that price has been respecting a bearish trend line and using it as resistance, this lines up with fundamentals and we can only see things getting worse for this " market giant"
We will be entering this trade once we have confirmation, All entry, TP and SL will be sent out to our clients once trade is valid, If you are interested in joining our team then just message us as we offer a 2 week trial to our VIP group.

FACEBOOK resistance turned supportAs you can see from our chart the Facebook has been testing and respecting our trend line and using it as resistance for months, just recently it has broken this trend line and has come back down and is now using it as support.
Entry, SL and TPs are all reserved for our clients, if you are interested in joining our team then please send us a message.

Long $FB off this bullish divergence and falling wedgePossibly a risky trade given the shaky sentiment in the markets right now but I couldn't resist an opportunity to pick up some $FB at this price based on the bullish divergence, falling wedge pattern and indicators screaming oversold. There's always the possibility this moves against me to the downside hence my stop loss.. I'm willing to enter long here and see how it plays out and no big deal if my s/l gets taken out on this one. Not financial advice.

FB UPDATE - nay sayers, like me :)I AM EXPECTING MORE FUTURE DROP DOWN
FOR FACEBOOK, thou for now there should be
a moment of respite for them
like, follow and comment for more

Facebook bulls almost ready to takeoverWe could se a retest of the key support line ( 169.63 ) on the daily timeframe, price has tested and bounced on a few occasions ( marked by the arrows on the chart ) if we take into account the fundamentals along with the technical analysis both point to the bulls taking over and pushing price higher.
• Daily active users (DAUs) – DAUs were 1.47 billion on average for June 2018, an increase of 11% year-overyear.
• Monthly active users (MAUs) – MAUs were 2.23 billion as of June 30, 2018, an increase of 11% year-overyear.
• Mobile advertising revenue – Mobile advertising revenue represented approximately 91% of advertising revenue for the second quarter of 2018, up from approximately 87% of advertising revenue in the second quarter of 2017.
Trade will be sent to our clients along with SL and TP once it becomes valid to enter, if you would like to join us then please message.

Facebook heading in correct directionTake a look at our charts, we called the Facebook long, as soon as we called it we had 2 days of bullish movement.
Hours and hours of reading reports, earnings and news pays off, this is what we do for our clients.
All TP and SL are reserved for our clients.
Please message us if you are interested in joining.

Look at the Bigger Picture, the UPTREND is still intact $FBIf you a take a step back and look at the bigger picture, the uptrend is still intact. Fundamentally, the earnings weren't disastrous. I felt that physiologically, too many people piled into FB in the past few months with a very optimistic view and once they heard a droplet of bad news, they over-reacted and the stock plummeted. However, hindsight is 20/20 but playing earnings is many times like flipping a coin. I've taken advantage of this recent drop and have purchased future dated call options.
--
DISCLAIMER
Disclosure: I/we have positions in the investments/securities mentioned.
I wrote this article myself, and it expresses my own opinions. I am not receiving compensation for it. I have no business relationship with any company whose investments/securities is mentioned in this article.

Easy FaceBook Trade +30% in 90 days w/ Spectro™ MThis is a textbook trade using Spectro™ M
The green triangles mean that Spectro's Reversal Confirmation is triggered, so after that we just waited for the next conservative Spectro™ M alert and bough in, still no sell alert but we have the red triangles warning for a big correction or reversal so we just closed this position.
So if you're thinking about shorting it, I'd get ready for a possible good entry point.
Liked it? Give it a shot at, it's really affordable - you wouldn't believe if I told you: hypester.org

Facebook Elliott Wave Analysis: Pullback Remains In ProgressHello Traders,
In this Elliott Wave Analysis, we will have a look at Facebook in the 1-hour chart.
Short-term Elliott wave analysis suggests that the rally to $203.55 ended in black wave ((1)). Down from there, the pullback in black wave ((2)) remains in progress in 3, 7 or 11 swings to correct cycle from 3/26/2018 low. The internals of that pullback shows an overlapping structure thus suggesting that the correction takes the form of corrective structure i.e either (W),(X),(Y) or (W),(X),(Y),(X),(Z) structure.
Below from $203.55 high, the pullback is proposed to be unfolding as Elliott Wave double three structure where blue wave (W) ended at 193.11, blue wave (X) ended at 200.75, and blue wave (Y) of ((2)) remains still in progress. The internal of blue wave (W) also unfolded as a double three structure where red wave W ended in 3 swings at $199.31, red wave X ended $202.24 and red wave Y of blue (W) ended at $193.11 as a Flat. Up from there, blue wave (X) also unfolded in 3 swings as Elliott Zigzag structure with red wave A ended at $199.40, red wave B ended at $195.98 and red wave C of blue (X) ended at $200.74 high.
Down from there, blue wave (Y) of black ((2)) remains in progress as another double three structure. Internals of that decline ended red wave W in 3 swings at $192.22 and red wave X ended at $197.45. Near-term focus remains towards $188.92-$186.90, which is 100%-123.6% Fibonacci extension area of blue wave (W)-(X) to end black wave ((2)) pullback. Afterwards, the stock is expected to find buyers for black wave ((3)) higher ideally or should do a 3 waves reaction higher at least. We don’t like selling it into a proposed pullback as the right side remains to the upside in the higher timeframe.


FACEBOOK bullish trendFB in the near term is technically positive. We recommend an opportunistic buy with an entry below 144.85 with a primary target at 151.53.
FACEBOOK
FACEBOOK
FACEBOOK
FACEBOOK
FB
FB

FB @ 1h @ Outbreak confirmed above GAP last week! This week too?Take care
& analyzed it again
- it`s always your decision ...
(for a bigger picture zoom the chart)
Best regards :)
Aaron

FACEBOOK - TRENDLINES | ZONESHere, I analyze NASDAQ:FB according to trendlines.
Lower green trendline is important, tracing back to earlier months, hence thickest .
Upper green trendline is of lesser time, hence less thicker .
The red lines show the most recent levels to keep a tab on.
The black lines are another set of trendlines to look.
Watch how how the stock behaves when it touches these lines and then trade accordingly.
Personally, I would enter a short trade if it touches 'the red line' ( double top ) ; and more convicingly if the 'strong green' trendline, with a significant break of it as stoploss.
Your comments and opinions are welcomed.

FB @ 1h @ gap recovered back last week, now into alltime highs ?Take care
& analyzed it again
- it`s always your decision ...
(for a bigger picture zoom the chart)
Best regards
Aaron

FB @ daily @ constructive breakup into new alltime highs ?Take care
& analyzed it again
- it`s always your decision ...
(for a bigger picture zoom the chart)
Best regards
Aaron

FACEBOOK STOCK GOING DOWN TO 108.00In order to complete this corrective structure it has to make another wave down.More correction can occur so Ill take the sell after a break and consolidation.
