GC1! – The Wedge Strikes BackGC1! – The Wedge Strikes Back 🚀
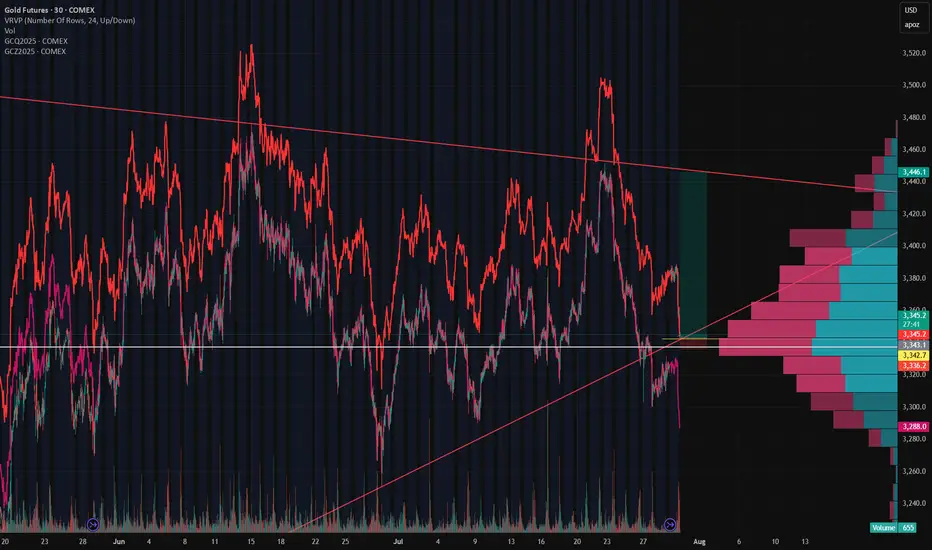
Gold futures (GC1!) just gave us a textbook rollover move. As the front-month rolled, price faked a wedge breakdown, only to rip back inside the structure once rollover completed. That failed breakout speaks volumes – and now the wedge is back in control.
Rollover Trap → Back Inside the Wedge
Rollover volatility flushed price below the wedge, pulling in shorts… but the move didn’t stick. Buyers stepped up and snapped price back inside, turning the wedge’s lower boundary into rock-solid support once again.
The Long Game 🎯
With GC1! holding the wedge:
Longs off wedge support are the play
Resistance: 3,380
Target: 3,446 (upper wedge boundary)
Stop-loss: 3,336 (below support)
Risk/Reward: 🔥 10.69 RRR
Volume Profile also shows heavy accumulation in the 3,336–3,380 zone – crack through 3,380, and we could see momentum accelerate quickly.
Bottom Line
This isn’t just another bounce – it’s a failed breakdown on rollover. Wedge traders are back in the driver’s seat, and the setup offers a crystal-clear invalidation point with serious upside potential.
Failedbreakout
Tesla Trade Breakdown: The Power of Structure, Liquidity & ...🔍 Why This Trade Was Taken
🔹 Channel Structure + Liquidity Trap
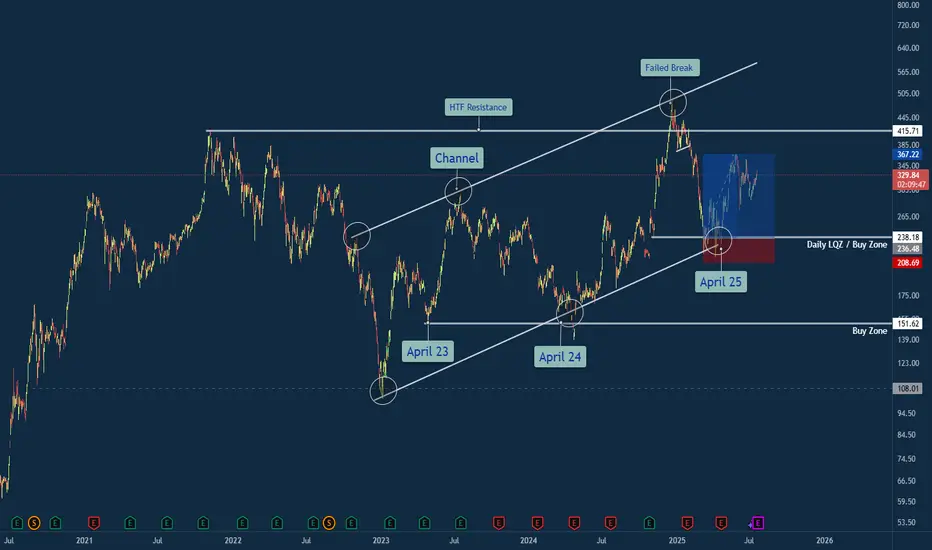
Price rejected from a long-standing higher time frame resistance channel, making a false breakout above $500 — a classic sign of exhaustion. What followed was a sharp retracement into the lower bounds of the macro channel, aligning with my Daily LQZ (Liquidity Zone).
🔹 Buy Zone Confidence: April 25
I mapped the April 25th liquidity grab as a high-probability reversal date, especially with price landing in a confluence of:
Demand Zone
Trendline Support (from April 23 & April 24 anchor points)
Volume spike + reclaim of structure
🔹 Risk/Reward Favored Asymmetry
With a clear invalidation below $208 and targets at prior supply around $330+, the R:R on this trade was ideal (over 3:1 potential).
Lessons Reinforced
🎯 Structure Always Tells a Story: The macro channel held strong — even after a failed breakout attempt.
💧 Liquidity Zones Matter: Price gravitated toward where stops live — and then reversed sharply.
🧘♂️ Patience Beats Precision: The best trades don’t chase. They wait. This was one of them.
💬 Your Turn
How did you play TSLA this year? Were you watching the same channel? Drop your insights or charts below — let’s compare notes 👇
#TSLA #Tesla #SwingTrade #PriceAction #LiquidityZone #FailedBreakout #TechnicalAnalysis #TradingView #TradeRecap #ChannelSupport #SmartMoney
SPX SPY Trading Range or BO? Daily Chart Analysis - 5 Mar 2025
• The market traded lower earlier in the day. The market then reversed higher for most of the day around noon time. The SPX then pulled back off its high in the final 30 minutes of the day.
• The bulls see the market trading in a broad bull channel and want the move to continue for months. They want an endless pullback bull trend.
• They want a retest of the all-time high (Dec 6) followed by a breakout and trend resumption. They see the current move as a bull leg within the trading range.
• They want a reversal from a double bottom bull flag (Jan 13 and Mar 4) and a wedge (Feb 25, Feb 28, and Mar 4).
• They hope the bottom of the 22-week trading range will act as support. They want a failed breakout below the January 13 low.
• At the least, they want a retest of the middle of the trading range (around the 20-day EMA).
• If the market trades lower, they want the November 4 or October 3 low to act as support.
• The bears got a reversal from a higher high major trend reversal, a wedge top (Dec 6, Jan 24, and Feb 19), and a smaller double top (Jan 24 and Feb 19).
• They see the market as being in a 22-week trading range.
• They hope to get a bear leg to retest the January 13 low followed by a breakout below. They got it yesterday (Mar 4).
• Next, the bears want a breakout below the January 13 low, followed by a measured move based on the height of the 22-week trading range.
• If the market trades higher, they want the bear trend line or the 20-day EMA to act as resistance.
• They want at least a small second leg sideways to down to retest the March 4 low.
• So far, the market is trading in a 22-week trading range.
• The SPX broke below the January 13 low yesterday (Mar 4) and traders want to see if there are any follow-through selling.
• Or will the market form a pullback, followed by a second leg sideways to down to retest the March 4 low after that?
• Traders may BLSH (Buy Low, Sell High) within the trading range until there is a breakout from either direction with follow-through buying/selling.
• The bears must create a strong breakout below the January 13 low with follow-through selling to convince traders a breakout could be underway.

BAJAJ FINANCE LTD: Bullish Momentum and Key Trading InsightsBAJAJ FINANCE LTD is demonstrating robust bullish momentum with potential breakout opportunities. Traders and investors should consider key indicators and trend direction to inform their trading strategies.
Current Stock Price: ₹7,606.60
Key Levels:
• Swing High: ₹7,824
• Swing Low: ₹6,451
Trend Direction: UPTREND
Indicators in Focus
Bullish Momentum and Possible Breakout: The stock is currently exhibiting strong bullish momentum, indicating positive market sentiment. This is further supported by a possible breakout scenario, suggesting that the stock might surpass significant resistance levels and experience substantial upward price movement.
Swing Trade and Buy Today, Sell Tomorrow (BTST): Swing trading aims to capture gains from short-term price swings. This strategy is suitable for traders looking to capitalize on brief market movements. The BTST approach involves buying the stock today with the intention of selling it the next day for a profit, especially in a bullish market scenario.
RSI Breakout: The Relative Strength Index (RSI) levels indicate momentum shifts. Current levels show that the stock is in a healthy trading range without extreme overbought or oversold conditions.
Technical Indicators Analysis
Daily (D), Weekly (W), Monthly (M):
• Stochastic: High Stochastic values on the daily and weekly timeframes suggest that the stock is trading near its highest point in the trading range, indicating strong upward momentum and a bullish trend. On a monthly scale, the Stochastic value shows potential for a new upward swing, indicating room for further price appreciation.
• CCI (Commodity Channel Index): High CCI values indicate that the stock's price is significantly higher than its average price, suggesting strong buying pressure and market interest. On a monthly scale, the mixed CCI values indicate a combination of bullish momentum and potential consolidation, hinting at a balanced market sentiment.
• MACD (Moving Average Convergence Divergence): On the daily and weekly timeframes, a "Bull" indication aligns with the current uptrend, suggesting continued positive momentum. This reinforces the bullish sentiment and encourages investors to hold or buy the stock. However, mixed signals (Bull, Bear) on a monthly scale indicate potential long-term volatility, prompting investors to be cautious and consider risk management strategies.
Swing Points:
• Swing High: ₹7,824
• Possible Next Swing Point: ₹8,451
Volume Analysis
Volume Data:
• Current Volume: 2.48M
• SMA Volume: 1.12M
Current Volume vs. SMA Volume:
When the current volume of 2.48M is compared to the SMA volume of 1.12M, we see that the current trading activity is significantly higher than the average. This indicates a surge in trading interest and strong investor participation.
Impact on BAJAJ FINANCE LTD:
1. Increased Trading Activity: The high current volume suggests robust buying interest, potentially driving the stock price higher.
2. Confirmation of Bullish Momentum: The increased volume, along with bullish technical indicators, confirms the uptrend and signals further price appreciation.
3. Potential for Breakout: The significantly higher volume may lead to a breakout, with the stock breaking through key resistance levels and achieving substantial gains.
Conclusion and Strategy
Short-term (Swing Trade/BTST): With strong bullish momentum and potential breakout, the short-term strategy could focus on buying the stock at the current levels and targeting the next possible resistance levels (Swing High: ₹7,824 and ₹8,451).
Long-term: Given the bullish sentiment in daily and weekly indicators, investors might consider holding the stock for longer periods, monitoring the monthly MACD and CCI for trend shifts.
Risk Management: Use stop-loss orders to manage risk, particularly if the stock price nears key support levels or if bearish signals emerge in short-term indicators.
Caution : Please note that the company’s financial results are due to be announced tomorrow, 29 January 2025. This can lead to increased volatility in the stock price. Traders should exercise caution and consider the potential impact of the results on their trading strategies.

Technical Review - BTCThere are lots of confident predictions about where markets will head next. However, at its core, trading is about speculation and taking calculated risks—not about certainty. In this post, I'll share some technical trades in BTC from recent price action. While hindsight bias will naturally come into play, I did take several of these setups in real time.
Higher Timeframe Context (1-Month)
In terms of the higher timeframe context, there has been a clear uptrend with two distinct continuation setups (noticeable move up, followed by a contraction towards the mean price which then sets up for a continuation). At the current time there has been an attempt for a third move.
These could have been entered on the range expansion from the contractive state, however when prices become extended towards the outer boundaries we better be cautious due to risk of mean reversion. At such extremes, its better to scale out or look for better opportunities. These locations are often reached as measured moves (assumed average price volatility is sustained, as seen on the right side of the chart). This does not meant the move is over, but rather where the risk of mean reversion is increased, price can deviate from average volatility all the time.
This analysis is not a prediction of future behavior, but rather a review of recent events and how they could have been traded in technical terms. There is also a component of discretion, which occur in in real time, but is not relevant to asses at this point.
Before we take a trade we want to consider:
What is the current structure in play, is it a trend or a range?
Where is price located within that structure, are we at or near extremes?
In case above conditions are met, is there a setup or an entry trigger?
This all boils down to the search for imbalance.
Daily Timeframe: Range-Bound Trading Opportunities
In terms of my trading timeframe, which is the daily, BTC has spent the past months within a distinct range. When such a structure is in play, the locations of interest are at or near the extremes (upper and lower boundaries) where imbalances tend to occur.
Efficient trades at these extremes typically arise when there’s a failure test (also known as a failed breakout or 2B pattern). In these cases, price pushes outside the boundary, fails to follow through, and reverses back inside—often trapping participants and can fuel a move in the opposite direction.
This dynamic tend to hold until there is an actual breakout, there is no bulletproof way to know what will happened, but most of the time it can be helpful to reference the higher timeframe. For example, in case breakout happen in opposite to the trend we can treat them as potential failures, while with trend (as in this case with BTC to the upside) we can either treat them as breakouts or at least not fade the move. There are however exceptions and nuances to these type of plays.
On the chart, I’ve marked all failure tests where price moved back into the range and formed bullish continuation structures. These setups offered opportunities to enter and take profits. In my case, I typically targeted 1R trades on these setups, with some extending into full measured moves.
In conclusion, its probably a decent idea to have a structured framework to locate imbalance, but it must be combined with discretion so we can adapt to different conditions. Its not about confident predictions, but rather probabilities and calculated risks. Don't become attached to positions, let the cumulative effect drive results.

Will BTC Break Its Consolidation Range This Week?Over the past few weeks, BTC has consolidated around the $19,246 level, which is the Fibonacci level of interest discussed in a number of recent posts in the past couple of weeks. See the links embedded in the Primary Chart above.
BTC has chopped above and below this $19,246 level quite a few times, forming a tight consolidation range between and $18,232 and $20,225 approximately. Each breakout move has resulted in a bear or bull trap that fails to follow through with a sharp reversal back to the opposite side of this level. See the intraday Supplementary Chart below for an overview of the past two weeks of price action with some of the prominent failed breakouts highlighted with circles.
Supplementary Chart: Key Fibonacci Level at $19,246 with Multiple False Breakouts in Both Directions
The failed breakouts in both directions have likely been a source of frustration for bulls and bears alike. Each move has been essentially a trap move that failed to follow through, with a sharp reversal to the opposite side of the $19,246. As pressure mounts on major equity indices like the S&P 500 ( SP:SPX ) and NDX 100 ( NASDAQ:NDX / NASDAQ:QQQ ), with many of them undercutting June 2022 lows, BTC is like to follow suit in short order. This does not negate the possibility of BTC yielding a sharp OS bounce in the coming week or two after a trend move lower.
One argument for the bulls is that BTC's sideways chop action has resulted in its relative strength becoming quite impressive. Equity indices have been plummeting sharply since mid-August 2022 with little reprieve. But BTC during this time has largely chopped sideways after losing a few key levels in late August and early September 2022.
BINANCE:BTCUSDT
BITSTAMP:BTCUSD
COINBASE:BTCUSD
KUCOIN:BTCUSDT
KRAKEN:BTCUSD
CME:BTC1!
________________________________________
Author's Comments:
(1) Thank you for reviewing this post and considering its charts and analysis. The author welcomes comments, discussion and debate in the comment section. Shared charts are especially helpful to support any opposing or alternative view.
(2) This technical-analysis view does not constitute a trade recommendation or trade setup. Instead, it attempts to offer technical commentary that describes and analyzes price levels, trends, price action, or the broader technical environment as of the publication date. Technical-analysis commentary does not equate to trade setups or recommendations. Within a given price environment, traders bear responsibility for their own trading strategy, risk tolerance, and time frame, and for any due diligence associated with such trades.
(3) This technical-analysis viewpoint could change at a moment's notice, e.g., when price violates a key level of invalidation for a particular view. Further, proper risk-management techniques are vital to trading success.
(4) To the extent countertrend price moves are discussed, consider that countertrend or mean-reversion trading, e.g., trading a rally in a bear market, remains higher risk and lower probability even for the most experienced traders and investors.
DISCLAIMER: This post contains commentary published solely for educational and informational purposes. This post's content (and any content available through links in this post) and its views do not constitute financial advice or an investment or trading recommendation, and they do not account for readers' personal financial circumstances, or their investing or trading objectives, time frame, and risk tolerance. Readers should perform their own due diligence, and consult a qualified / licensed financial adviser or other financial or investment professional before entering any trade, investment or other transaction.

BTC Likely to Test June 2022 Lows SoonToday saw volatile, whipsawing price action in both cryptos and equity indices. BTC was no exception. As discussed in an article on September 19, 2022 at the start of this week (see link in the Primary Chart above), the US Federal Reserve Open Market Committee (FOMC) has held their September 2022 meeting on Tuesday and Wednesday this week. This meeting concluded today with a presser at 2:00 p.m. EST in the US. The hawkish monetary policy that has been fostered by the FOMC has put pressure on risk assets for much of this year. Federal Reserve Chair Jerome Powell clearly stated that monetary policy would continue to remain restrictive and tight for quite some time until inflation comes down toward its 2% target.
The Federal Reserve, along with other central banks around the globe, have been attempting to tackle sticky inflation. Inflation has been the number one problem in developed countries from a macroeconomic perspective, and it has been running at high levels not seen in decades. Though some argue that inflation may have peaked, and there are good arguments for this conclusion, it remains sticky and well above central banks' targets, which in the US is 2%.
The Primary Chart above links to other recent posts on BTC where key levels are discussed in more detail than in this post, especially the downtrend line and key Fibonacci levels.
After the FOMC presser, it appears that BTC is heading quickly to test June 2022 lows. BTC failed in its breakout attempts over the summer as to key levels. This is discussed in the prior posts linked in the Primary Chart above.
In the most recent post regarding levels to watch this week, .786 retracement of the summer rally was identified as a key one to watch. Price chopped around this level with two failed breakout attempts. These failed breakouts are similar to the failed breakouts as to other key Fibonacci levels as well discussed in the linked recent posts.
Supplementary Chart A: Failed Breakouts This Week over .786 Retracement Level
Given these failed breakouts, combined with the failure on September 13, 2022, at the major downtrend line resistance, BTC is likely headed to test June 2022 lows soon. First it must violate the lows from earlier this week at 18,271. A successful violation of this level will lead directly to June 2022 lows. After that, some of the Fibonacci Channel lines can be considered as subsequent targets.
Please also see the update by @Tradersweekly posted in the link below, which covers volume and some additional resistance levels based on multi-year price peaks. This article is highly recommended for a complementary but slightly different perspective on BTCUSD.
________________________________________
Please note that this technical-analysis viewpoint is short-term in nature. This is not a trade recommendation but a technical-analysis overview and commentary with levels to watch for this week. Also note that countertrend trading, e.g., trading a rally in a bear market, is tricky and challenging even for the most experienced traders. Countertrend trades are lower probability trades as well.
This technical-analysis viewpoint could change at a moment's notice should price move beyond a level of invalidation. Further, proper risk-management techniques are vital to trading success.
Author's Comment: Thank you for reviewing this post and considering its charts and analysis. The author welcomes comments, discussion and debate (respectfully presented) in the comment section. Shared charts are especially helpful to support any opposing or alternative view. This article is intended to present an unbiased, technical view of the security or tradable risk asset discussed.
DISCLAIMER: This post contains commentary published solely for educational and informational purposes. This post's content (and any content available through links in this post) and its views do not constitute financial advice or an investment or trading recommendation, and they do not account for readers' personal financial circumstances, or their investing or trading objectives, time frame, and risk tolerance. Readers should perform their own due diligence, and consult a qualified financial adviser or other investment / financial professional before entering any trade, investment or other transaction.

Lovely cup and handle, but it failedA lovely cup and handle pattern formed on Physical Gold. However, it never broke out and failed. You can't rely on bullish patterns all the time.

SPX Breaks Symmetrical Triangle Consolidation PatternPrimary Chart: SPX Symmetrical Triangle and Anchored VWAPs
The S&P 500 broke out of a symmetrical triangle pattern this week. On September 13, 2022, SPX's price closed below the lower trendline of the triangle, which is an upward trendline from the June 17, 2022, low. These multi-month patterns do not resolve easily every time. A backtest of the trendline that was violated commonly occurs, though it's not a certainty. A backtest in this case could mean price moves up to test the SPX 3930 to 3941 zone in the next several days, if it occurs at all.
Two anchored VWAPs are shown on the Primary Chart above. First, the anchored VWAP from the all-time high on January 4, 2022. Price moved above this level in mid-August 2022 at the end of the summer rally. But price quickly failed back below this anchored VWAP not long after the breakout. This constitutes a failed breakout, which has bearish implications for the near term outlook.
The Primary Chart also shows a VWAP anchored to the June 2022 lows. SPX's price broke above this VWAP at least three times on the daily chart, but each breakout has failed. This also has bearish implications in the near term.
The levels that matter the most right now are the symmetrical triangle's two trendlines. As long as price stays below the lower trendline of the triangle (an upward trendline from June's low), the technicals favor a continued bearish outlook. But there are some other levels that are important to watch as well. For next week, all the key SPX price levels to watch are identified below. Key resistance levels for next week include the following levels:
3980 = two key Fibonacci levels coincide here (a .50 retracement of the two-month summer 2022 rally and the .618 retracement of the early September rally)
3978 = anchored VWAP from June 17, 2022, low
3959-3961 = highs from last week's two-day consolidation, September 14-15, 2022
3927-3944 = upward trendline from June 2022 lows that is now resistance (previously support)
3899/3900 = major resistance from June and July as well as the .618 retracement of the summer rally
3886-3888 = important lows from the first half of September 2022
Key support levels for next week include the following:
3858 = anchored VWAP from March 2020 pandemic lows
3837 = low from OPEX / quad witching on September 16, 2022
3812 = 1.272 extension of the retracements of the early September 2022 rally
3783 = .786 retracement of the two-month summer 2022 rally
3721 = 1.618 extension of the two-month summer 2022 rally
3636 = the YTD SPX low
Lastly, the next major levels for the bears to conquer should be the VWAP anchored to the pandemic-crash low in March 2020. Look where SPX's price closed on Friday, September 16, 2022, just above this VWAP after a brief break below it:
Supplementary Chart A: Anchored VWAP from March 2020 low
Supplementary Chart B: Fibonacci Levels from June to August Rally and Early September Rally

This Chart is ScaryTraders,
As you know, EuroDollar Futures has been one of the lead indicators regarding Fed rate hike action. As the futures drop, the inverse occurs with the U.S. dollar (DXY). It goes up. Likewise, the Fed tends to respond with a rate hike in accordance with the gravity of the EuroDollar's move down. Yesterday, the drop was huge after the CPI report was released! Is this chart possibly projecting a 100 bps rate hike? I, myself, am skeptical but this is what the data may be telling us. Thoughts?
Stew

RALLIED FAILED BEARS HAVE SPOKEN!Bulls tried to rallied the patterned market play and was DENIED access due to bears having more momentum. Market key timeframes and targets delievered created great resistances during higher/lower areas. Remember to always invest wisely.

Tetra Technologies (TTI) RECALL ALERT!Hello everyone,
It is with the utmost conviction that I must return to a trade posted on June 7th, 2022, and admit, I was WRONG. I have to own it... the breakout has failed; I have stopped out of this trade.

turn back around plseBroken trend line and channel bottom. It can only mean a failed breakdown. So ride it back to the top plse.

What Is a Failed Break?A failed break (false breakout) occurs when a price moves through an identified level of support or resistance but does not have enough momentum to maintain its direction.
Failed breaks may also signal traders to enter a trade in the opposite direction of the attempted breakout. Since the breakout attempt failed, the price could head the other direction.
A throwback is when the price retraces back toward the resistance or support level just broken. A throwback is not a failed breakout.
How to detect failed breaks?
A failed breakout reveals that there was not enough buying interest to keep pushing the price above resistance or below support.
If a security does not see strong volume and substantial price moves supporting the breakout direction, the chance of a false breakout increases. Take a look at the chart and see how the uptrend line is broken with unexpected low trading volume.
If there is significantly increased volume on a breakout, the likelihood of a false breakout developing decreases (but is not eliminated). However, a throwback may still occur.


$trow failed breakup on wedge?looking at a possible failed breakout up on an upwedge; returning to wedge this week and look for breakdown and short trades

ALGT 1D RANGE TRADINGBuy a Daily Candle Close above the Range Top.
Watch for a Failed Range Breakout.
Use a 30m/1h time chart to watch if there is a Bearish bounce off Range Top.
Breakout Candle Must Be 100% of the Average Volume For full-size position
75% of the Average Volume For ½ size position
Stop Loss is 1.5 x ATR First Target is 1 x ATR (close ½ position 1st TP)

Mexico failed breakoutAn interesting way to see how countries are doing is by the iShares of the country.
Mexico had seen a breakout, but very quickly gave that up, creating a failed breakout.
Next support & resistance levels are drawn in the chart.
50sma and 200sma look like they will start trading together.
Mortality rate there is the highest in the world unfortunately.

BEAT #FailedBreakout #HeadandShouldersI've posted twice about H&S forming. Nothing is certain in trading. Example of a failed breakdown. Always have a strategy around your exits and trade management. Identifying the chart pattern is the easy part, the hard part is managing your trades after you enter them.

RSI breakout reversalAfter breaking our briefly last Friday, the has reversed and has closed under its resistance every day for the last week. The RSI and trendlines both show that the VIX is going to get scrunched between its resistance and support lines. Because flag patterns are usually a breakout followed by a triangle pattern followed by a breakout in the same direction, I would expect a break past the resistance line. Until then I have a neutral outlook on the VIX.

UTI #Rectangle #FailedBreakoutChart patterns have their fare share of failed setups. No "edge" is perfect. Identifying the trade is the easier part. Trade and Risk management is where the heavy lifting is. I alerted to this setup when it was forming here

LEND- Time to cool offMakerDao, Compound and Aave are the three major lending protocols in the DeFi space. I think LEND has run its course and there are better coins to speculate on since it has already gone up more than 35x this year alone.
It may be facing a major pullback soon. Even so, it is never a wise idea to short a high momentum coin until the trend is clearly broken, which hasn't happened for LEND yet.

CALM Failed #Breakout #AcendingTriangle #ChartPatternNASDAQ:CALM broke out of the 4+ month ascending triangle chart pattern and close above resistance 4 days in a row before the news shock after the close yesterday. The stock gapped down 5+%, held around the opening print for around 2 hours and gravity took over from there. Remember, anything could happen when you enter the trade. Use stop losses and risk management to minimize damage.
