Bitcoin - Expecting Liquidity Grab at 102.8k Before Relief MoveMarket Context
After a strong rejection from resistance, price has shown clear signs of internal weakness. We recently got an internal liquidity sweep followed by a sharp move down, confirming a shift in momentum. The market is currently compressing just below a key fair value gap, hinting at further downside before any real bullish structure can form
Internal Sweep and Bearish Pressure
The internal sweep acted as a final inducement before the market sold off. The reaction afterward was clean and aggressive, suggesting that smart money is offloading positions into trapped longs. Price has now stalled in a tight range, and the lack of bullish follow-through adds weight to the idea that lower prices are still on the table.
Fair Value Gap Below as Draw
The unfilled imbalance below, lining up near 102.8k, is acting as a magnet. This level has not been tapped and lines up cleanly with the idea of a final liquidity sweep before any retracement. It would make sense to target this zone to clear out remaining liquidity and rebalance price before reassessing.
Retracement Scenarios After the Sweep
Once that low is swept and the gap is filled, we could see a retracement back into the previous fair value gap around 106k. This could either form a lower high, continuing the broader downtrend, or potentially run the high if there's enough momentum. Either way, the reaction from that level will offer the next major clue on direction.
Key Expectation
Until the low around 102.8k is swept, the bearish narrative remains intact. The cleanest setup would be a liquidity run into that level followed by a reaction that leads us higher, ideally back toward the 106k zone. From there, we’ll watch how price behaves to decide whether a deeper correction or a trend continuation is in play.
Conclusion
Still leaning bearish short-term as long as that gap and low remain unfilled. Once we tap into the 102.8k area, I’ll be watching for a shift that could give us a play back into the 106k gap. It’s all about liquidity, structure, and the cleanest path for smart money to move.
Disclosure: I am part of Trade Nation's Influencer program and receive a monthly fee for using their TradingView charts in my analysis.
Thanks for your support!
If you found this idea helpful or learned something new, drop a like 👍 and leave a comment, I’d love to hear your thoughts! 🚀
Fairvaluegap

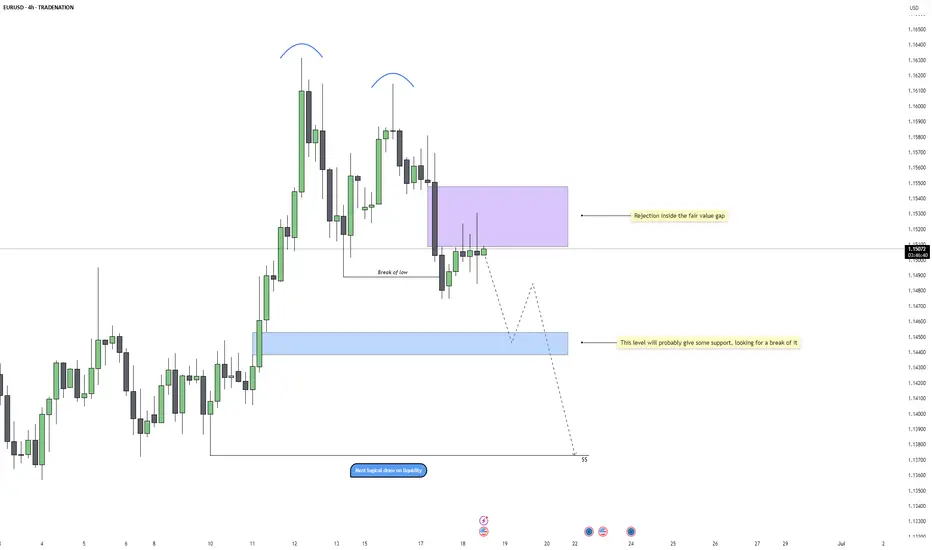
EURUSD - FVG Rejection and Bearish Continuation PlayEURUSD has been showing consistent bearish pressure on the 4H chart, with a clear shift in momentum after forming a double top near 1.162. That marked the beginning of a structural change, which was confirmed once price broke the most recent higher low. Since then, the market has transitioned into a bearish structure, with lower highs forming consecutively. This suggests that the bullish trend is over for now, and the market is more likely to seek liquidity below.
Rejection at Fair Value Gap
After the low was broken, price retraced back into a 4H fair value gap, which has now acted as resistance. This is typical smart money behavior, sweep liquidity, shift structure, then retest an imbalance before continuing lower. The wick rejection inside the purple FVG zone is a strong signal that this area is being respected and that sellers are defending it. The rejection aligns with the overall bearish market flow and suggests that the market has likely completed its retest.
Short-Term Support and Liquidity Target
The light blue FVG around 1.144 could offer temporary support, but the bias remains bearish. That level sits right at the midpoint of the recent bullish leg that was already violated, and while price may pause here, the more logical draw on liquidity sits deeper. Unless there’s a sudden shift in market structure or high-impact fundamental news, this area is expected to eventually give way.
Liquidity Below and Final Target
The cleanest and most obvious liquidity pool rests around the 1.137 zone. This is where price previously consolidated before initiating the impulsive move higher, and it remains unmitigated. If the current bearish structure holds, the market will likely target this area next. The path there might not be linear, we could see a short-term bounce off 1.144, but as long as price remains below the 1.153 FVG rejection, the bearish continuation remains valid.
Trade Expectation and Risk Context
This setup aligns well with typical displacement-retest-continuation behavior. The risk is clearly defined above the FVG rejection, and as long as lower highs continue forming beneath that zone, the bearish thesis remains intact. Key downside targets are 1.144 for partials, and 1.137 as the final draw on liquidity. This setup offers both precision and strong narrative confluence, ideal for swing or intraday positioning.
Conclusion
Price has shifted bearish on the 4H, confirmed by a break of structure and rejection from a clear FVG. As long as we remain below that imbalance, the market should continue hunting liquidity to the downside. 1.144 may act as short-term support, but the real magnet sits at 1.137. Patience and risk control will be key in riding this move effectively.
Disclosure: I am part of Trade Nation's Influencer program and receive a monthly fee for using their TradingView charts in my analysis.
___________________________________
Thanks for your support!
If you found this idea helpful or learned something new, drop a like 👍 and leave a comment, I’d love to hear your thoughts! 🚀
EUR/USD - Eyes on the major resistance at 1.1540!Introduction
The EUR/USD currency pair has been trending downward on the 1-hour timeframe, indicating that bearish momentum is firmly in control. In this analysis, I will outline what to expect from the pair moving forward, and highlight the high-confluence zone that could offer a potential short setup. This area combines technical factors that suggest it may act as strong resistance if price retraces upward before continuing the downtrend.
Market Structure
On the 1-hour chart, the EUR/USD continues to form a series of lower highs and lower lows, which clearly confirms a bearish market structure. This consistent pattern reinforces that sellers have the upper hand, and that any short-term rallies are likely to be corrective in nature, not trend-changing. As long as this structure remains intact, the broader expectation remains bearish, with sellers likely to defend key resistance levels.
Fair Value Gaps on the 15-Minute and 1-Hour Timeframes
During the latest downward movement, the pair left behind two notable Fair Value Gaps, one on the 1-hour chart and another on the 15-minute chart. These imbalances are closely aligned, creating a strong confluence zone where price may face resistance if it moves back upward. The zone between 1.15400 and 1.15600 represents this overlapping FVG area. Because these gaps were formed by aggressive selling pressure, revisiting this level could trigger a bearish reaction, as traders look to re-enter short positions from a premium price.
Golden Pocket Fibonacci Retracement
Adding to this confluence, the Golden Pocket, the area between the 61.8% and 65% Fibonacci retracement levels, lies between 1.15407 and 1.15441. This zone is widely respected among traders due to its tendency to act as a reversal point in trending markets. The fact that it aligns so closely with both the 15-minute and 1-hour FVGs increases the likelihood of price reacting here. If the market retraces into this pocket, we could see renewed selling pressure, making it a valuable level to watch for short entries.
Point of Interest and Liquidity Zone
Within the latest leg down, there was a brief two-hour consolidation before the pair continued lower, leaving behind a distinct wick to the upside. This area is significant because it likely represents a point of interest where buy-side liquidity was grabbed. Many traders who entered shorts early may have placed their stop-losses above this consolidation high, creating a liquidity pool. This level, sitting inside the broader resistance zone formed by the FVGs and the Golden Pocket, adds another layer of technical significance. Price may move into this liquidity before reversing lower, offering a potential trap for buyers and an opportunity for sellers.
Downside Targets
If the price reacts to the resistance zone and resumes its downward movement, there are two logical targets to the downside. The first is 1.1485, which corresponds to the most recent swing low. The second target is 1.1475, which represents a deeper low and a stronger potential support level. These levels align with previous structure and could serve as key take-profit zones for traders holding short positions.
Conclusion
The EUR/USD remains in a well-defined downtrend, and several technical elements now converge between 1.15400 and 1.15600 to form a strong resistance zone. This area includes the 15-minute Fair Value Gap, the 1-hour Fair Value Gap, the Golden Pocket Fibonacci retracement, and a significant point of interest tied to liquidity. While the pair may not need to reach this zone before continuing lower, if it does, it is likely to act as a barrier to further upside. For traders looking to follow the dominant trend, this high-confluence area offers a potential entry point to the downside, with clear structure-based targets below.
Disclosure: I am part of Trade Nation's Influencer program and receive a monthly fee for using their TradingView charts in my analysis.
Thanks for your support.
- Make sure to follow me so you don't miss out on the next analysis!
- Drop a like and leave a comment!

Bitcoin - Trend Shift Confirmed, Eyes on $102.8K LiquidityMarket Context
Bitcoin showed signs of exhaustion after a strong short-term rally within a clean upward channel on the 1H chart. Price action had been respecting the trend structure until a key deviation occurred near $108,500, where we saw an internal liquidity sweep that hinted at potential distribution.
Fake-Out Confirmation and Shift in Momentum
After taking out local highs around $108.5K, price failed to continue higher and instead reversed sharply, confirming the sweep as a classic fake-out. This kind of internal liquidity grab is typically used to trap breakout buyers before reversing and targeting previous lows.
Break of Structure and Channel Retest
The rising channel was broken convincingly, and price has now retested the underside of the channel, aligning with the 50% equilibrium of the entire high-to-low range. This reinforces the bearish bias and suggests the market has likely shifted from accumulation to distribution.
Downside Targets and Key Levels
Immediate support sits around $104.6K, which served as a consolidation base during the earlier run-up. If this level fails to hold, the next key target would be a sweep of the previous significant low at $102.8K. This area is marked as a point of interest and could offer a reaction or reversal.
Price Expectations and Trade Outlook
As long as price remains below the broken channel and under $107K, the bearish scenario remains in play. I’m watching for bearish continuation into $104.6K first, and a potential full sweep toward $102.8K if that support fails.
Conclusion
The internal sweep followed by impulsive rejection, combined with a clear channel breakdown and retest, shifts the bias to bearish. A move into the $104.6K region seems probable, with a lower liquidity target at $102.8K in sight if downside pressure accelerates.
Disclosure: I am part of Trade Nation's Influencer program and receive a monthly fee for using their TradingView charts in my analysis.
___________________________________
Thanks for your support!
If you found this idea helpful or learned something new, drop a like 👍 and leave a comment, I’d love to hear your thoughts! 🚀

US100 – Eyes on $22,040 as bulls take chargeIntroduction
The US100 is currently showing signs of a bullish breakout, moving above the boundaries of a previously established parallel channel. It is now approaching an important area of imbalance, known as a Fair Value Gap (FVG), on the 4-hour chart. If the index manages to break through this zone, there is a strong potential for continued upward momentum. Let’s take a closer look at the technical setup and what might come next.
Parallel Channel
For some time, the US100 had been trading within a downward-sloping parallel channel, consistently making lower highs and lower lows. However, today's price action has changed that narrative. The index has broken out of the channel to the upside and is currently pushing towards new short-term highs, which could mark the beginning of a bullish trend reversal.
4-Hour Fair Value Gap (FVG)
The current focus is on an open 4-hour FVG that ranges from approximately 21,840 to 21,870. This zone could serve as a significant resistance level, potentially rejecting further upward movement. However, if the US100 breaks decisively above this range, it could open the door for a rapid push toward previous highs. Such a move would signal strong bullish momentum and confirm the breakout as legitimate.
Possibility of a False Breakout
There is always the risk that this breakout could turn out to be a false move. If the US100 fails to hold above the 4-hour FVG and reverses back below the channel breakout point, it could indicate a bull trap. In that case, the index may resume its downward trend. Still, based on the current momentum and market structure, this scenario seems less likely at the moment.
Upside Target
If the breakout above the FVG is successful, the next significant target lies at the recent highs near 22,040. This level is expected to act as strong resistance. Should the US100 manage to break through it, we could see a test of the all-time high in the near future. However, it’s important to approach the market with patience and let each level confirm itself before expecting further upside.
Conclusion
While the US100 has successfully broken out of its parallel channel, it is now facing a key test at the 4-hour FVG. A clean break above this zone would likely shift market sentiment to bullish and set the stage for a move toward 22,040 and potentially beyond. Until then, traders should watch closely for confirmation and be mindful of the possibility of a pullback.
Disclosure: I am part of Trade Nation's Influencer program and receive a monthly fee for using their TradingView charts in my analysis.
Thanks for your support.
- Make sure to follow me so you don't miss out on the next analysis!
- Drop a like and leave a comment!

Bitcoin - Bears vs Bulls: $100k next?Price recently tapped into a well-defined 4H and daily resistance zone and was met with an immediate rejection. That rejection wasn’t just a reaction, it led to a confirmed market structure shift as price broke the previous low. This transition from higher highs to a lower low signals the first sign of bearish control, flipping the short-term bias and setting the tone for a move lower.
Retest of MSS and Inversion Fair Value Gap
After the break in structure, price retraced directly into the origin of the move, retesting the same zone where the shift occurred. A previously bullish 4H gap has now flipped into resistance, rejecting price perfectly. This inversion, where a bullish imbalance turns into a bearish reaction zone, confirms the change in direction and strengthens the downside narrative.
New FVG as Entry Opportunity
The latest bearish impulse created a clean new fair value gap just above current price. A retest of this gap would offer a high-probability continuation setup, as it aligns with both recent structure and order flow. This zone becomes the critical level for bears to defend, and unless price reclaims it, the expectation remains for continuation toward lower liquidity.
Liquidity Outlook and Bearish Target
Below current price, a large pool of liquidity is sitting just above a major psychological round number. That level hasn’t been swept yet and is a likely downside magnet. With no meaningful support between the current FVG and that draw on liquidity, price is likely to reach for it next. This fits the typical sequence following a market structure shift: rejection, shift, retest, continuation, and liquidity sweep.
Momentum and Contextual Confluence
Zooming out slightly, the current move fits within broader bearish momentum that has been developing across timeframes. There’s no sign of strong bullish absorption, and each push higher has been met with efficient selling. This isn’t a chaotic breakdown, but a controlled sequence of lower highs and lower lows, supported by clean structural shifts and consistent rejection zones.
Conclusion
The chart tells a clear story. A clean rejection from a key resistance zone led to a confirmed bearish structure shift, followed by a textbook retest and fresh fair value gap. As long as price remains below that gap, the setup favors continuation lower, with the nearest liquidity pool being the most likely draw. This remains a high-probability bearish scenario until proven otherwise by a shift back above invalidation levels.
___________________________________
Thanks for your support!
If you found this idea helpful or learned something new, drop a like 👍 and leave a comment, I’d love to hear your thoughts! 🚀

EURUSD - Waiting for the Breakdown After 4H SweepEURUSD has just completed a sweep of the 4H highs, tagging liquidity resting above the consolidation range. That move looks like a classic inducement, with price now reacting lower and showing signs of weakness. This type of sweep, especially when it happens inside a range, often leads to a reversal back through the range, provided the internal low breaks cleanly. Right now, price is still hovering above that key point, but we can see signs of slowing momentum already.
Liquidity Context and Sweep Logic
This recent push above the highs fits well within ICT-style logic: a sweep of internal range liquidity that serves to fuel the opposite move. The chart shows a textbook example of a consolidation phase being manipulated to the upside first, where buy stops get triggered and liquidity is taken. The real move tends to unfold after that, once we get confirmation through structure breaks and displacement to the downside.
Structure Break and Bearish Confirmation
The internal low within the range is acting as a key trigger level. A clean break below that would serve as confirmation of a bearish market structure shift. That’s the point where the market goes from internal liquidity hunt to actual displacement. If that low gives way, the probability of continuation lower increases significantly, and that’s where I’ll be expecting price to seek the next pocket of liquidity.
Support and Key Area of Interest
There’s also a well-respected support level not too far below, one that price has bounced from several times. That area could either act as a temporary reaction zone or, if broken impulsively, could open the path toward deeper inefficiencies. Ideally, I want to see price break below both the internal low and this support area, then continue toward my next level of interest where I expect either a reaction or a higher probability setup to form.
Conclusion
For now, this setup is a waiting game. The liquidity has been swept on the upside, and now it’s all about whether the structure confirms to the downside. I’m not interested in chasing the first move. What I want to see is displacement below the internal low and support level, followed by continuation or a clean reaction from the next zone of interest.
Disclosure: I am part of Trade Nation's Influencer program and receive a monthly fee for using their TradingView charts in my analysis.
___________________________________
Thanks for your support!
If you found this idea helpful or learned something new, drop a like 👍 and leave a comment, I’d love to hear your thoughts! 🚀

Bitcoin - Bulls in Control: Aiming For $110kBitcoin has just confirmed a strong bullish breakout after consolidating beneath a prior fair value gap. The market not only broke out of that zone cleanly but did so with conviction, creating a new inversion fair value gap (IFVG) along the way. This type of structure often indicates a shift in sentiment, especially when paired with increasing volume and impulsive candles.
Fair Value Gap Break and Continuation Context
Following the breakout, price surged straight through another 4H FVG overhead, flipping it with strength and no hesitation. That kind of move shows clear intent. The market didn't pause or stall at resistance, which increases the probability that the same pattern could play out again, clean break, shallow pullback, and continuation. The breakout level now holds as short-term support.
Near-Term Expectations – FVG Fill Before Higher
With this latest 4H candle close, I’m now expecting a short pullback to fill the newly created 4H FVG below. This would provide the market with the fuel it needs to continue higher without leaving inefficient price action behind. The structure is setting up a classic breakout-fill-continue sequence, and the next key objective sits just below a clear resistance zone overhead.
Conclusion
Bitcoin broke out of a compression zone, formed an IFVG, and followed up with a strong push through the next fair value gap. I’m expecting a controlled retracement to fill the new 4H imbalance, after which price could continue pushing toward the major resistance area. The momentum is clean and structured—until that changes, continuation remains the more likely path.
___________________________________
Thanks for your support!
If you found this idea helpful or learned something new, drop a like 👍 and leave a comment, I’d love to hear your thoughts! 🚀

Bitcoin - Showing strength as it breaks key resistance levels!Bitcoin (BTC) recently demonstrated impressive strength by bouncing off a well-known confluence zone consisting of the golden pocket and a 4-hour fair value gap (FVG) around the $100,000 level. This technical area has historically acted as a reliable support and once again proved its significance, offering a solid foundation for the current rally.
Following this bounce, BTC surged to $108,000, decisively breaking above the 4-hour FVG near $107,000. With this breakout, the previously resistant zone is now expected to flip into support, adding further confidence to the bullish outlook. This type of price action is often seen in strong uptrends, where key resistance levels are reclaimed and converted into support, providing a base for further upside.
Importantly, BTC has also managed to push through the golden pocket resistance, a critical Fibonacci retracement area closely watched by traders. This breakout, in conjunction with the 4H FVG clearance, clears the path for a potential continuation toward Bitcoin’s all-time high.
Momentum is clearly building. Buying pressure is strong, and retracements have been shallow, indicating a market dominated by demand. While this is a bullish sign, a brief pullback or bounce off the newly formed support (the 4H FVG zone) would be healthy. Such a move would allow BTC to consolidate and build strength before potentially pushing toward new highs.
Overall, the technical landscape looks increasingly favorable for BTC. As long as it holds above the reclaimed support zones, the path to retesting, and possibly surpassing, the all-time high appears wide open.
Thanks for your support.
- Make sure to follow me so you don't miss out on the next analysis!
- Drop a like and leave a comment!

Did Gold Just Sweep the Low for a Reversal?After a clean sweep of the Previous Day’s Low (PDL) on XAUUSD, price reacted sharply, grabbing liquidity and signaling a possible shift in order flow. This forms the first pillar of my CRT model (Candle Range Theory) : Sweep, Break, Retest .
Following the sweep, we observed a strong Break of Structure (BOS) , indicating bullish intent. We will then wait for price to retrace back to a FVG at a discount, and then execute the trade.
The stop loss was logically placed just beneath the PDL sweep and FVG zone, protecting against deeper liquidity hunts. Take profit targets the next high where resting buy-side liquidity is likely to be engineered.
This setup checks all the boxes:
Sweep of PDL ✅
BOS confirming shift ✅
FVG retest for refined entry ✅
Solid RR and clean narrative ✅
This is a great example of how patience and a structured approach can create high-probability setups.

AUDJPY pull back to FVG then LongAUDJPY Long Setup (Preliminary Plan)
Target Levels:
First Target: 94.300
Second Target: 94.800
Strategy:
Looking for bullish price action (PA) confirmation around the highlighted Fair Value Gap (FVG).
Expecting a possible breach of minor resistance on open, which may lead to a push toward the first target at 94.300.
A pullback may follow after the first target is hit.
Notes:
This setup is preliminary and subject to adjustment.
Live price action will be monitored before executing the trade.

BTC Short Setup! Break of Structure + OB + 70.5% Premium TapBitcoin (BTCUSD) | 30-Min Chart – Clean Bearish SMC Setup
BTC just delivered a textbook Break of Structure (BoS) to the downside, and price is now retracing into a high-confluence premium zone packed with Smart Money signals: a bearish Order Block (OB), Fair Value Gap (FVG) alignment, and multiple Fibonacci retracement levels. This setup is precision-crafted for patient traders who wait for institutional footprints before striking.
🔍 Trade Breakdown:
🔺 Market Structure Shift:
Price broke decisively below the internal range, forming a clear BoS (Break of Structure). The lower low confirms bearish intent. Any retracement into premium is now a potential short opportunity.
📉 Bearish Order Block:
Marked just above the 61.8% Fib
Originated the strong bearish impulse that created the BoS
This is where Smart Money likely entered the move — we look to join them
🟣 Fair Value Gap (Imbalance Zone):
Gap within the OB
Price is likely to rebalance this inefficiency before continuing the bearish trend
📐 Fibonacci Levels (Swing High to Low):
50%: 103,617 (current price)
61.8%: 103,963
70.5%: 104,800
79%: 105,200
This premium zone (104,400–104,951) overlaps with the OB and FVG — massive confluence.
🧠 Smart Money Playbook:
🔹 Entry Zone:
From 103,963 to 104,951 — OB + FVG + 61.8–70.5% retrace = sniper entry window
🔻 Stop Loss:
Above 105,000 (protect against OB invalidation and final liquidity sweep)
📉 Take Profit:
100,464 — aligned with the low of the full fib swing and prior liquidity pocket
⚖ RRR:
Over 1:4 — clean sniper risk-reward with clear structure validation
📉 Bearish Continuation Expectation:
Price enters OB → taps imbalance → reacts at 70.5% level
Expected move: Sell-off toward the discount zone + full swing completion
Look left — no major support zones until the 100,400–100,600 level, making it a liquidity magnet and realistic TP zone.
💬 Ninja Wisdom:
Structure + Liquidity = Foundation
OB + FVG + Fib = Precision Tools
Trade where Smart Money enters — not where retail hopes. 🥷💸
📍 Save this chart – this setup could play out fast
🔁 Share your thoughts: will BTC respect the OB or break above?
👣 Follow @ChartNinjas88 for daily sniper-level BTC/ETH/Gold trades

XAUUSD Bearish Setup! OB Rejection + FVG + 61.8% Fib PremiumGold (XAUUSD) | 4H Chart – High-Probability Bearish Setup
XAUUSD is setting up for a bearish move as price taps into a premium zone confluence, including an Order Block (OB), Fair Value Gap (FVG), and a 61.8% Fibonacci retracement. Smart Money Concepts (SMC) traders will recognize this setup as a textbook scenario for a bearish continuation toward a Weak Low target.
🔍 SMC Breakdown:
Market Structure:
The market has shifted bearish after breaking the previous low and forming a lower high. The internal structure confirms bearish order flow, giving us confidence in continuation to the downside.
Liquidity & Inefficiency Play:
Recent sweep of buy-side liquidity above minor highs.
Rejection at premium pricing indicates Smart Money has triggered sell programs.
Internal liquidity pools were engineered and swept, confirming manipulation.
Entry Confluence Zone (Kill Zone):
🔴 Order Block (OB):
3,372 – 3,380 — bearish OB formed before strong impulse move.
🟣 Fair Value Gap (FVG):
Perfect overlap with the OB, leaving a gap that price has now rebalanced into.
📐 Fibonacci Levels from Swing Low to High:
61.8% = 3,373
70.5% = 3,377
79% = 3,380
This entire zone aligns with institutional premium pricing — the high-probability reversal range.
📉 Bearish Projection:
Expecting price to reject from OB/FVG zone and move toward the discount zone, targeting unmitigated lows and imbalance fills.
Key Downside Targets:
50% = 3,368
Full Extension = 3,333 (Aligned with Weak Low)
This level also sits near the 0.00% Fib level — a clean liquidity magnet.
🧠 Chart Ninja Entry Plan:
🔹 Entry: 3,373 – 3,380 (OB + FVG + Fib Premium)
🔻 Stop Loss: Above 3,381 (invalidate OB)
📉 Take Profit: 3,333 (Weak Low + Fib Completion)
⚖ RRR: ~1:4+ — high-confluence sniper setup
💬 Ninja Wisdom:
You're not trading random candles — you're trading intentional liquidity shifts.
This setup screams Smart Money footprint: OB rejection + inefficiency fill + premium pricing.
Be the sniper — not the trigger-happy retail trader. 🥷🎯
📍 Save this setup before it plays out — backtest and learn from it!
🔁 Drop your analysis below – agree or see it differently?
👣 Follow @ChartNinjas88 for daily institutional-grade setups on Gold & more!

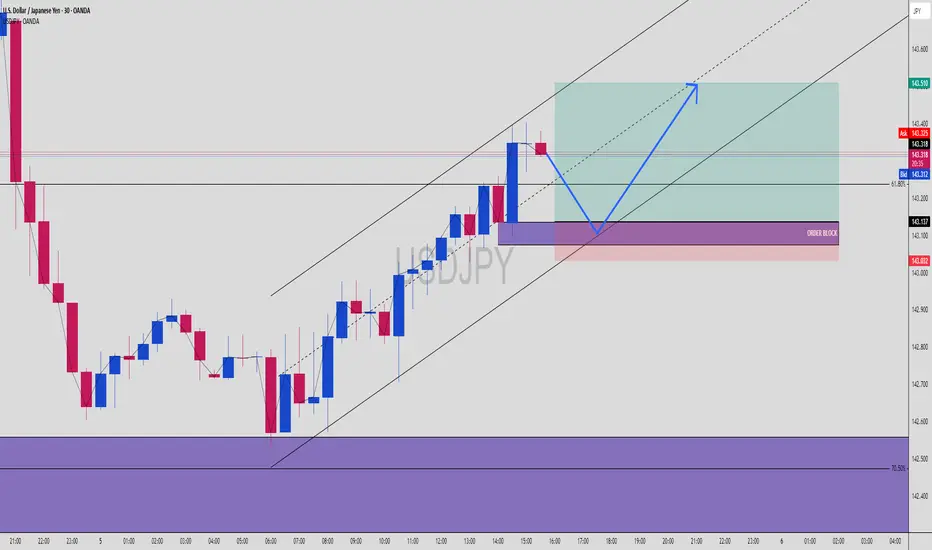
USDJPY Buy Setup! OB + 61.8% Fib + Trend Channel ConfluenceUSDJPY | 30-Min Chart – High Probability Buy Setup in Progress
USDJPY is currently respecting a bullish market structure within a well-defined ascending trend channel. Smart Money Concepts (SMC) traders are watching for a precise reaction at the confluence of a key Order Block (OB), Fibonacci retracement levels, and mid-channel support.
🔍 Trade Breakdown:
Bullish Market Structure
Price has shifted from bearish to bullish after forming a key higher low and continuing with higher highs within the trend channel. The structure is being respected with multiple taps on both upper and lower channel boundaries.
Internal Liquidity & Order Flow:
Price previously swept sell-side liquidity below the recent swing low and sharply reversed, confirming internal liquidity engineering and institutional involvement.
Currently, we’re seeing price stall after rejecting the upper channel and OB zone. A retracement into the discount zone is anticipated before continuation.
🟣 Order Block Zone (OB): 143.032 – 143.137
A clear bullish OB formed after a strong impulsive move, marking the last down candle before the bullish break of structure.
Located just above the 61.8% Fibonacci level — strong confluence.
📐 Fibonacci Levels from Last Swing Low to High:
61.8% = 143.137
70.5% = 143.032
Potential reaction zone aligns perfectly with OB + trendline + psychological round level (143.000 area)
📊 Buy Setup Expectation:
USDJPY is expected to retrace into the OB/Fib confluence zone before a bullish continuation toward the upper boundary of the trend channel and beyond.
🔵 Projected Path:
Price dips into OB → reacts to 61.8–70.5% retracement → bullish reversal → break to fresh highs near 143.510 or higher
🧠 Chart Ninja Entry Plan:
🔹 Entry Zone: 143.032 – 143.137 (OB + 61.8–70.5% Fib)
🔻 SL Below: 143.000 (beneath OB and psychological level)
📈 Target: 143.510 (channel top + previous supply zone)
⚖️ RRR: Approx. 1:3+ — high precision Smart Money entry
💬 Ninja Wisdom:
Patience before profit. Wait for price to return to the zone where institutions left footprints — the OB at equilibrium pricing. Combine OB + Fib + channel and you're trading like the banks.
Retail buys the breakout. Smart Money buys the pullback. 🥷📚
📍 Save this chart before the setup triggers!
🧠 Do you see the same confluence? Comment your entry/TP/SL plans ⬇️
👣 Follow @ChartNinjas88 for more sniper setups on major FX pairs every session!
BTC Short Setup! OB + Fair Value Gap + Trend Channel ConfluenceBitcoin (BTCUSD) | 30-Min Chart – High Probability Sell Setup
Bitcoin continues to respect bearish structure inside a descending trend channel, creating prime opportunities for Smart Money traders to strike at optimal levels.
🔍 Trade Breakdown:
Bearish Market Structure
Price is forming lower highs and lower lows
Channel structure is being respected with multiple taps on both the upper and lower bounds
Liquidity Sweeps & Internal Range
Multiple yellow-highlighted zones show liquidity engineering — both buy-side and sell-side have been swept
Recent sweep + demand failure confirms bearish intent
Premium Entry Zone Setup:
🔴 Order Block Zone (OB): 105,200 – 105,400
🟣 Fair Value Gap (FVG): Overlapping with OB – perfect imbalance correction
📐 Fib Levels:
61.8% = 104,987
70.5% = 105,298
79% = 105,388
🔺 This is the kill zone — premium retracement + inefficiency fill = high confluence
Bearish Continuation Expectation:
BTC likely to react at OB zone and continue bearish leg
Projection into discount fib levels:
-27% = 104,000
-62% = 103,800
-100% = 103,727
Channel Respect = Structure Confidence:
Every key swing is aligning with channel resistance/support
Blue arrow shows expected path: liquidity sweep ➝ OB/FVG tap ➝ drop to channel low
🧠 Chart Ninja Entry Plan:
🔹 Entry Zone 105,280 – 105,388 (OB + FVG + 70.5–79% Fib)
🔻 SL Above 105,400 (above OB)
📉 Target 103,727 (channel + -100% Fib extension)
⚖️ RRR Over 1:4 — sniper-grade RR setup
💬 Ninja Wisdom:
You're not chasing moves — you're waiting where liquidity pools.
Fair Value Gaps + OB + Trend Channels = institutional signature.
Trade like Smart Money. Let retail chase candles. 🥷💸
📍 Save this setup before the market plays out
🔁 Share your thoughts below – entry, TP, SL?
👣 Follow @ChartNinjas88 for more sniper BTC setups daily

$ENS / USDT 1D FAKEOUT ON FLAG? Incoming Pump? 📊 $ENS/USDT Perpetual Contract – Daily Timeframe Analysis
🟢 Bullish Setup
A bullish flag is forming on the daily chart — a continuation pattern indicating potential upward movement.
- Price recently entered into the golden pocket of the Fibonacci retracement tool marked from $16.881 – $25.241 on the third touch of the flag's resistance, triggering a fakeout, it now rests in the first Fair Value Gap.
- The strong wick rejection on the 3rd retest of the resistance/supply indicates bearish strength, momentarily pushing price lower.
- Despite this, the overall pattern remains valid as long as price respects the Golden Pocket and FVG zone below.
✅ If price closes above the golden pocket, it could present an excellent leveraged entry or spot position, with high reward potential off 67%.
🔴 Bearish Scenario
- So far, every test of the **4H supply zone** has resulted in rejection — showing persistent seller control at short-term resistance.
- If buyers fail to defend the golden pocket and recover the bullish trendline, the structure confirms a break. (Downtrend)
The confirmation of bearish pressure is the:
1) Large wick (Creating a shooting start candle pattern)
- Signaling bearish reversal.
2) Large Bearish Marubozu Candle.
- Indicates strong continuation of a downtrend.
3) Candle close below Trend line support.
- Showing Bears were able to successful make a major move.
🔽 In that case, we look to short after FVG confirmation and scalp down toward the daily demand zone.
📌 Patience is key. Let the price show intent before entering.
Please let me know what your thoughts are!

Bitcoin - Reclaim or Reject? Key 4H FVG Levels in FocusAfter an extended move lower, Bitcoin has just swept the major 4H lows and immediately bounced back with strength. This aggressive reaction suggests the sweep was likely a liquidity grab rather than a continuation. Price is now trading back inside a large 4H fair value gap, which could serve as a short-term magnet while market participants reassess direction.
Key Price Reaction and Fair Value Gap Context
The current rebound into the 4H FVG is notable. This zone holds significance because it's the last inefficiency left unfilled before the final leg down. If buyers manage to push through and close above this imbalance, it would indicate a short-term reclaim and open the door to a bullish liquidity sweep higher. The clean highs just above are marked by the $$ label, which align with a key inducement zone and should attract price if bullish momentum sustains.
Upside Scenario – Targeting the Liquidity Sweep
If we do see a clean move and close above the fair value gap, I’ll be looking for price to extend toward the highs just above it. These highs are likely to be the next target for liquidity collection, especially if short-term traders begin chasing strength. However, I’m not expecting price to trade beyond that zone. There’s a protected high resting above, and unless a significant fundamental shift occurs, it’s unlikely we break that structure.
Downside Risk – Failure to Hold Could Lead to 99K
If the market fails to close above the FVG or quickly gets rejected on a wick into it, the bullish scenario becomes invalid. That would confirm the move back up was simply a retracement after the sweep, setting the stage for further downside continuation. In that case, I expect the market to break lower and move toward 99K, which remains my downside target under bearish conditions.
Conclusion
Bitcoin just swept key 4H lows and is now testing a large imbalance. A close above could trigger a run on the $$ liquidity, but I do not expect price to move beyond that due to the presence of protected highs. On the other hand, failure to break and hold above the FVG opens the door for a deeper flush toward 99K.
___________________________________
Thanks for your support!
If you found this idea helpful or learned something new, drop a like 👍 and leave a comment, I’d love to hear your thoughts! 🚀

Is This the Optimal Entry After a PDL Sweep and FVG Retest?A clean structural development on CHFJPY (1H TF)
After sweeping the Previous Day’s Low (PDL), price created a bullish Break of Structure (BOS) to the upside , shifting short-term sentiment. This BOS was followed by a precise retest into a Fair Value Gap (FVG), suggesting possible continuation as liquidity shifts from weak hands to strong.
🧠 Educational Notes :
CRT Sweep Logic: Market often sweeps the previous day's high or low before making its true move. In this case, a clean PDL sweep was followed by a strong bullish reaction.
Break of Structure (BOS): Confirmed bullish intent after the sweep, validating a shift in order flow.
FVG Retest: Institutional pricing inefficiency filled — a classic SMC continuation behavior.
Entry Thesis: Based on reaction from FVG + BOS confirmation, with invalidation below the swept low and TP near the previous swing high.
This setup is not financial advice, but a clear visual case study for traders applying SMC + CRT logic.

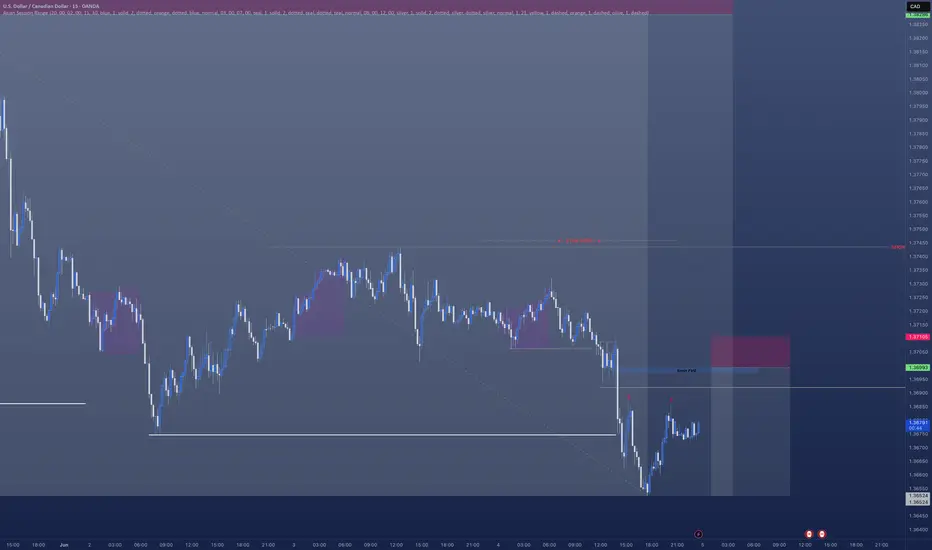
USDCAD - Short ContinuationHave a really nice short currently open on USDCAD
However I am looking to get a further position opened which come in the morning.
There's a clear break of structure.
- A nice FVG left behind.
- We are creating liquidity / inducement
- All pointing towards a nice further sell off in the morning.
Ideal situation is we sweep Asian session highs in the morning in the hope we move lower
EURUSD - Potential Bearish ContinuationEURUSD recently tapped into a 4-hour Fair Value Gap, aligning perfectly with a prior liquidity sweep just above the recent swing high. This zone acted as a magnet for buy-side liquidity, and price reacted sharply once that liquidity was taken out. The rejection confirms this area was used by larger players to offload positions rather than push higher.
Rejection and Structure Shift
After the sweep and tap into the FVG, we saw an immediate and aggressive bearish reaction, signaling a clear rejection of higher prices. Momentum flipped decisively, breaking smaller structural points on the way down. The rejection is not just technical, it’s reactive, showing that the intent was never to sustain the breakout.
Break of Support Zone and Bearish Setup
Price is now testing the critical mid-range structure marked in red. This zone previously held as support multiple times, but it is now under pressure. If we get a clean 4H close below this area, it confirms a market structure shift and opens the door for further downside.
Bearish Target and Liquidity Zone Below
If the break confirms, the next logical move would be a push down into the broader support area below. That zone holds untapped liquidity and marks the base of the recent rally. A sweep of those lows would align perfectly with the narrative of a failed breakout, followed by a deeper correction.
Conclusion
The rejection from the 4H Fair Value Gap, combined with a liquidity sweep and a pending structure break, builds a clean bearish case. A confirmed close below the marked zone would shift this into a continuation setup, with expectations for a move toward the lower support and a potential sweep of the lows.
Disclosure: I am part of Trade Nation's Influencer program and receive a monthly fee for using their TradingView charts in my analysis.
___________________________________
Thanks for your support!
If you found this idea helpful or learned something new, drop a like 👍 and leave a comment, I’d love to hear your thoughts! 🚀

Gold Pullback Entry Opportunity Gold resumed its rally, sparked by recent tarrif news. Price is pulling back at the moment and has entered an sweet spot where we can confidently take our first low risk Buy.
BUYING HERE BECAUSE
1. We're entering into a low volume area, which is also in line with an FVG on the 1hr chart
2. When a new uptrend starts, i like to buy first 2 instances price pullback to bounce from my trend cloud indicator We didn't get a perfect bounce as it has broken below it, but i'am still buying regardless due to my first reason above about the low volume gap.
PROFIT TARGET
Setting my profit target to my trusted Exofade peak. As long as the uptrend continues, Exofade peaks will ALWAYS get taken out. That why i love this indicator, and its free. It's my gift to y'all :) . Just search for it in trading view indicators.

BTC - Will BTC fill the 4H inbalance at $107.400Bitcoin (BTC) is currently exhibiting a clear downtrend on the 4-hour timeframe. During the most recent downward move, it left behind an imbalance, specifically, a 4-hour Fair Value Gap (FVG), which the price is now retracing toward. This area represents a potential zone of interest for entering a short position, given the prevailing bearish structure.
At the same time, BTC is approaching the golden pocket of the Fibonacci retracement, a level often watched by traders for potential reversals. This zone coincides with a former support level that provided multiple bounces in the past, but has now flipped into a potential resistance. The confluence of these factors could add significant selling pressure.
It’s important to note that BTC does not necessarily need to reach the imbalance zone to resume its downward movement. However, the presence of that FVG remains a relevant detail to monitor in case price action does continue higher before reversing.
Thanks for your support.
- Make sure to follow me so you don't miss out on the next analysis!
- Drop a like and leave a comment!

EUR/USD - Sweeping the highs, retracement following?The EUR/USD has experienced a steep and aggressive bullish run today, showing strong upward momentum across multiple timeframes. This impulsive move has led to a sweep of the recent highs, taking out key liquidity levels that were resting above previous swing points. In the context of smart money concepts and institutional trading models, such a move typically signifies the activation of buy-side liquidity, where stop-loss orders and breakout entries are triggered above a well-defined high. This behavior is often engineered by larger market participants to fulfill liquidity objectives before potentially reversing or retracing.
During this strong bullish leg, the EUR/USD left behind a noticeable imbalance, commonly referred to as a Fair Value Gap (FVG), on the lower timeframes. This imbalance reflects an area where price moved too rapidly, leaving behind unfilled orders and creating a price inefficiency. Specifically, an FVG remains open around the 1.13700 level, a zone that was bypassed during the impulsive rally and now stands as a likely magnet for price in the near term. These imbalances are significant because price tends to revisit them to seek equilibrium and fill in the inefficient areas, especially after a major liquidity grab.
The sweep of the highs was a classic liquidity-taking event. When price runs above a prominent high, especially one that's visible on higher timeframes like the 4H or daily, it often signals that buy stops (retail breakout entries or protective stops) have been targeted. Once these stops are taken, there is typically a shift in market behavior. The aggressive buyers have been filled, and institutional players may look to reverse or retrace price toward areas of unfilled orders, such as the aforementioned FVG. The market often transitions from a state of expansion (impulse move) to a state of rebalancing or consolidation, which opens the door for a pullback.
Given that the liquidity above the highs has been taken and that the 1.13700 gap remains unmitigated, it becomes increasingly likely that EUR/USD will begin a retracement. This corrective move would serve to rebalance the price, revisit the inefficiency, and potentially test the validity of any newly-formed demand zones. From a technical standpoint, this area is crucial, not only because of the gap itself but also due to its positioning in relation to prior market structure.
In summary, today’s bullish extension in EUR/USD accomplished a major liquidity objective by sweeping the highs. However, the move left behind a significant imbalance at 1.13700, suggesting that the pair could be due for a corrective pullback to fill the gap. Traders should monitor lower timeframes for signs of distribution, potential shifts in market structure, or bearish order blocks forming after the sweep. All of these could provide clues that the market is preparing to return to the gap and restore price efficiency.
Thanks for your support.
- Make sure to follow me so you don't miss out on the next analysis!
- Drop a like and leave a comment!
