BTCUSD Smart Money Reversal: OB + FVG Trap Targets Weak Lows🚨 BTCUSD Smart Money Concept Alert (30-Min Timeframe)
A classic bearish setup is unfolding on Bitcoin, and it’s screaming trap + reversal for anyone watching closely. Here’s why this could be your high-probability short of the week… 👇
🔍 1. Liquidity Sweep at Key High
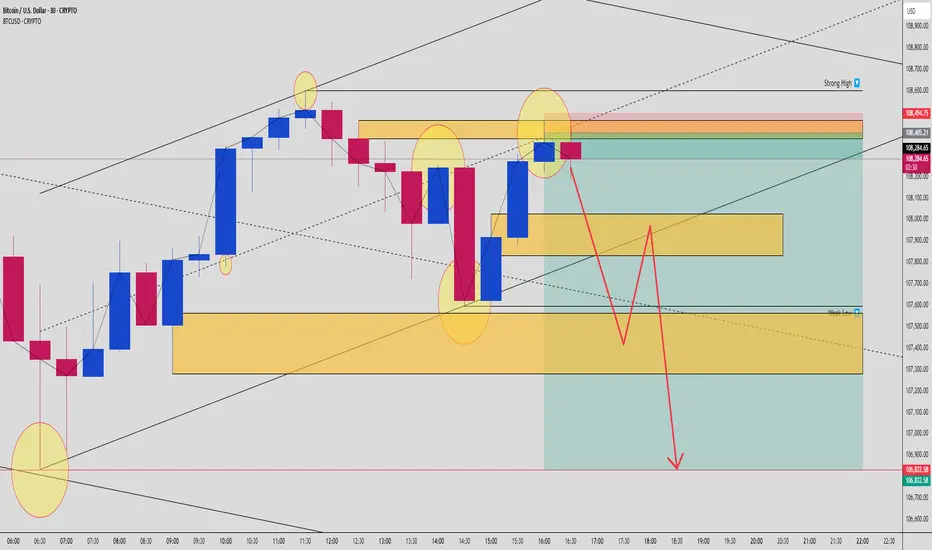
We just saw a clean sweep of prior swing highs near 108,400 – a clear signal that Smart Money has hunted liquidity above weak retail stops. That big push into the premium zone? Not real demand. It’s engineered manipulation. 🔧
📉 2. Premium OB + FVG Confluence
Price has just tapped into a juicy confluence zone:
🔲 Order Block @ ~108,400–108,494
🟦 Fair Value Gap (FVG) imbalance sits right below
🎯 All aligning with 61.8–79% Fib retracement from the prior bearish leg
This is where Smart Money institutions enter the party. Look left: it’s the same game played again and again. Trap the highs, fill the imbalance, then dump.
🔄 3. Reversal Evidence Already In Play
A bearish reaction candle confirms rejection from this OB zone. The wick shows aggression – a clear sign of selling pressure stepping in at the premium.
Expectations now shift from retracement to trend continuation toward unmitigated demand zones below.
🧠 4. Weak Low & Liquidity Engineering
Below current price lies a weak low around 107,300 – that’s your magnet. Price needs to sweep that inefficiency, and the structure suggests liquidity vacuum mode is active.
Key zone targets:
🟨 First TP: 107,800 (FVG base)
🟨 Second TP: 107,300 (weak low sweep)
🔻 Final TP: 106,832 (full mitigation zone = 1400+ pip potential)
🎯 5. Execution Plan
💼 Smart Entry:
Entry zone is anywhere from 108,250 to 108,490 (OB + FVG overlap)
SL above 108,600 (structure invalidation)
📊 Targets:
TP1 – 107,800
TP2 – 107,300
TP3 – 106,832
⚖️ RR: ~1:3 or better if executed precisely
🧩 Market Psychology:
This isn’t just technicals. It’s narrative vs. reality.
Retail sees breakout → Long
Smart Money sees sweep → Sell
Retail buys late → Fuel for Smart Money exits
🛡️ Risk Reminder:
Trade the setup, not emotions. Let price come to your zones. Stay mechanical, not emotional. Partial out and trail stops once TP1 hits. Never chase.
✅ Summary:
BTCUSD is showing a perfect bearish Smart Money setup. OB + FVG confluence, strong premium reaction, engineered weak low, and liquidity zones below. Textbook SMC pattern. Play it right, and this setup could deliver clean, high-RR profits.
⚡ Drop a “BTC READY” in the comments if you're watching this one with sniper focus.
🧠 Tag a trading buddy who still thinks we’re in a breakout!
Fairvaluegap
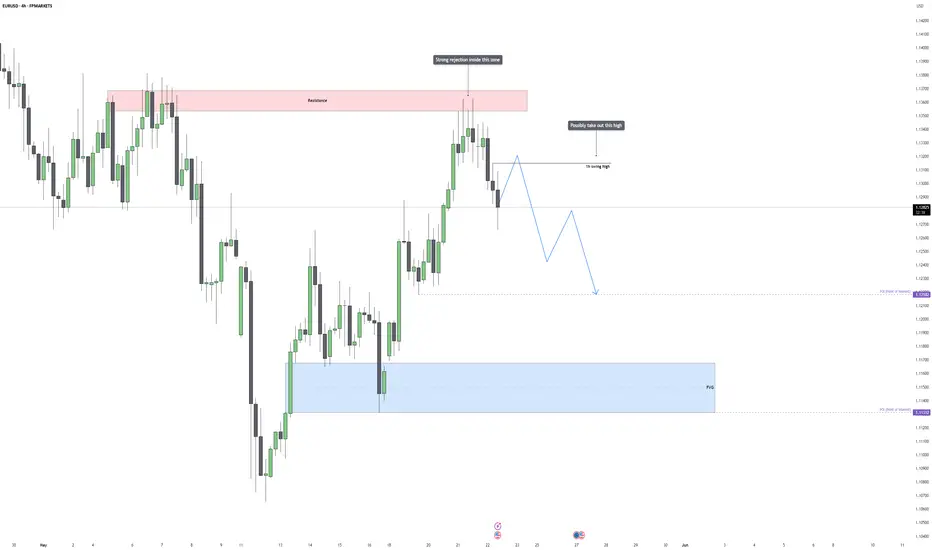
EURUSD – Bearish Outlook After Inducement and RejectionEURUSD recently delivered a sharp rejection from the 1.13700 resistance zone, a level that previously acted as a strong barrier for price. This area had already shown signs of supply in the past, and the latest reaction only strengthens the case for continued bearish interest at that level. The rejection candle was large, clean, and decisive, showing that sellers aggressively stepped in after price entered the premium zone. This shift now places focus on how price navigates lower timeframes in the short term, especially as we approach key liquidity levels and structural points of interest.
Sweep Setup and Liquidity Outlook
Despite the rejection, one notable feature left behind is a 1H swing high just under 1.13400. This high remains untapped and likely holds buy-side liquidity from breakout traders. It’s common to see price sweep such local highs before turning lower, especially after a clear rejection from a major zone like the one above. This potential inducement move, where price runs the high to gather liquidity and trap late buyers, is what I’ll be watching closely next.
The scenario I’m anticipating is a relatively short-lived push higher, just enough to clear the swing high liquidity before price shifts bearish again. This behavior fits within the broader bearish structure and could serve as the final fuel needed before a deeper move to the downside unfolds.
Key Levels and Technical Context
The first point of interest comes in at the 1.12182 level, which is marked on the chart. This level is not rando, it aligns with previous structure, sits near a micro-breaker, and is positioned just above a fair value gap. If we do get the anticipated sweep of the 1H high, this 1.12182 area becomes a highly sensitive zone where the next key reaction could occur.
What makes this POI important is that it serves as a decision point for the market. If the sweep occurs and price aggressively sells off into this level, we can start watching for continuation setups. But if price stalls or consolidates here, we’ll need to evaluate whether the bearish momentum is still intact or if a shift is occurring.
If bearish pressure continues, the next downside target is the POI around 1.11300. This level is nested cleanly inside a higher-timeframe fair value gap, and it also overlaps with a prior demand zone. From a liquidity standpoint, it’s the logical draw, resting sell-side liquidity is likely building beneath those May lows, and the market could easily target that zone once 1.12182 is breached.
Momentum, Structure, and Execution Plan
The current structure is bearish, but short-term strength is still on the table until the sweep of the 1H high plays out. I’m not interested in selling into strength just yet, I’d prefer to see the inducement leg complete, followed by signs of weakness such as bearish engulfing structures, lower timeframe market structure breaks, or clean fair value gap entries forming after the sweep.
Once price breaks below 1.12182 decisively, it opens the path toward the next liquidity pocket at 1.11300. Any signs of continuation post-rejection from that first POI would be used to look for scalable short entries with tight risk and larger reward-to-risk ratios.
Conclusion
EURUSD is setting up for a clean liquidity run above the 1H high, following a strong rejection from higher timeframe resistance. The plan is to let price run that liquidity, then look for bearish signs to engage short down toward 1.12182. If that level fails to hold and bearish pressure continues, the 1.11300 POI becomes the next logical target. The structure is lining up well for this sequence, but execution will depend on how price behaves around the key inducement and reaction zones.
___________________________________
Thanks for your support!
If you found this idea helpful or learned something new, drop a like 👍 and leave a comment, I’d love to hear your thoughts! 🚀
GOLD is About to COLLAPSE from a Fake Pump!📊 GOLD SMC Analysis (XAU/USD 4H)
Gold just tapped into a major Fair Value Gap + Premium OB Zone, aligning with the 79% retracement level. Market structure shows exhaustion, and a perfect short setup is forming.
🔍 Smart Money Narrative:
Strong prior bearish move = institutional sell-off ✅
Clean retrace into FVG (Fair Value Gap) and OB (Order Block) = sell zone 💯
Price tapped into 3,351 – 3,364 range (marked red)
That level aligns with the 79% Fib + channel resistance 🚨
The confluence = Smart Money liquidity grab ➡️ expect dump
📍 Key Confluences:
✅ FVG: clear imbalance filled (great trap zone)
✅ Order Block: bearish origin of last impulse
✅ 79% Fib Level: classic retracement kill zone
✅ Bearish Trendline + Channel Top: dynamic resistance
✅ 3:1+ RRR short idea in play
📉 Trade Plan (Sell Setup):
Entry Zone: 3,351 – 3,364
Stop Loss: 3,442 (above swing high)
Take Profit:
TP1: 3,280 (61.8% level)
TP2: 3,120.76 (full move, 0% Fib)
RRR: 1:3 to 1:4 🤑🔥
🧠 Institutional Logic:
Retail is chasing breakout highs 😬
Smart Money is selling into OB + FVG → trap those late longs
Next? Smash weak lows and rebalance price with a deep pullback
💬 “Gold’s headed for a cliff dive?” Drop a 💰 or ‘XAU’ if you’re riding this wave down!

Bitcoin - History Repeating, 110k Next target?Bitcoin has been ranging tightly on the 4H chart, and the recent price behavior is starting to look very familiar. When you compare the current structure with what happened in the first week of May, there are some striking similarities. Back then, BTC consolidated in a sideways channel, faked a breakout to the upside, returned into the range briefly, tapped a demand zone, and then exploded higher into a strong rally. That move laid the groundwork for a steep continuation and fresh highs.
Right now, we’re seeing a nearly identical flow: a prolonged consolidation followed by an upside breakout, a retrace into the prior range, and a precise reaction off a Fair Value Gap (FVG). These repeat structures often hint at algorithmic behavior or institutional footprints, where similar setups trigger similar outcomes.
Structural Context and Price Behavior
The May 6th move began with a candle close above the range, a retest of the lows and FVG within the previous structure, and then an impulsive breakout that never looked back. This breakout was clean, supported by high volume and conviction. Once the retest held, price surged with minimal drawdown.
Now, we’ve just completed a similar sequence. Price closed above the consolidation range, came back in, filled the imbalance (FVG), and instantly found support. It’s also worth noting that both patterns formed after multi-day compressions, which often result in aggressive expansion phases.
What strengthens this setup is that the recent FVG fill didn’t just find support, it caused an immediate reaction to the upside. That’s a key sign that demand is active in this area and institutions may have used this as a re-entry point. From a structure standpoint, as long as we’re holding above the green zone (prior range high and FVG area), the bias remains bullish.
Liquidity Dynamics and Key Zones
The green support area acts as a clear line in the sand. It represents the upper half of the previous range and the origin of the most recent displacement. As long as price stays above this level, the idea is simple: the market is still in expansion mode. The recent wick into the zone could also be viewed as a liquidity sweep, drawing in shorts or stop losses before the real move begins.
In these kinds of setups, institutions often look for “clean-up” wicks to engineer liquidity, and BTC may have just completed that phase. Now that the liquidity grab has taken place and the imbalance is mitigated, the path of least resistance is likely to be up.
Price Target and Expectations
If history repeats, BTC could be setting up for a continuation leg that pushes toward a new all-time high. The $110,000 level makes sense both technically and psychologically. It would not only be a round number magnet but also a logical target based on the range expansion from the current structure. Once the local high breaks, momentum could accelerate quickly, especially if the market gets squeezed and forced to reprice aggressively.
A clean move toward $110,000 would also align with the broader macro narrative, as BTC continues to show resilience and trend continuation despite periods of consolidation.
Conclusion
Bitcoin is potentially repeating its early-May price structure, where a breakout, retest into a key FVG, and strong bullish reaction led to new highs. We’ve just completed a similar retest and bounce, suggesting we may now be in the early stages of a fresh impulsive move. As long as price remains above the key demand zone, this setup favors continuation, with $110,000 as the next major objective. All eyes on whether the market can break above local highs and maintain bullish momentum into uncharted territory.
___________________________________
Thanks for your support!
If you found this idea helpful or learned something new, drop a like 👍 and leave a comment, I’d love to hear your thoughts! 🚀

BTC Preparing for A Move Towards $110k Are You Ready?Bitcoin Market Update: BTC Preparing for a Move Towards 109,200 and 110,000 Levels
Bitcoin (BTC) appears to be gearing up for a potential upward move targeting the 109,200 to 110,000 price range. Over the past several days, Bitcoin has been consolidating within a tight range, indicating accumulation and market indecision. However, the latest price action has shown a strong bullish breakout, confirmed by a solid bullish candle, followed by a healthy retest of the breakout zone.
This retest suggests that Bitcoin may now be preparing for its next leg upward. The current price area presents a possible buying opportunity, especially as we approach the key black-marked zones on the chart. These levels are significant because they hold pending liquidity from previous days’ highs and also correspond to notable swing highs—areas where the market previously reversed.
Traders should remain alert and not miss this potential opportunity. It's crucial to monitor the market closely for any structural shifts or additional confirmation signals, such as bullish patterns, increased volume, or momentum indicators aligning with the upward trend.
As always, conduct your own research (DYOR) before making any trading decisions. Market conditions can change rapidly, and informed decisions backed by solid analysis are essential for successful trading.

BTCUSD 30M | OB Rejection + FVG Target | Liquidity BelowSmart Money Concept Breakdown | May 18, 2025
This BTC setup is screaming institutional manipulation — and we’re ready to ride the wave. The most recent candle shows another clean rejection from the 30M Order Block, giving high confidence in bearish continuation.
🔍 Key Breakdown:
Entry Confluence:
Bearish OB between 103,569–103,634 tapped with a perfect wick
Candle rejected CRT High (high-probability manipulation zone)
Rejection confirmed with a bearish engulfing candle structure
Target Mapping:
Sell Side Liquidity: 102,643.59
Fair Value Gap: 102,200 zone
Weak Low: 101,420.70 (likely final draw on liquidity)
RR Setup:
Entry: 103,570 zone
SL: Just above CRT High at 103,811
TP1: SSL pool
TP2: FVG
TP3: Weak Low
Risk-Reward Range: From 1:2.5 to 1:5+ 💰
🧠 Institutional Logic:
The rally into the OB was likely a buy-side liquidity grab, faking retail breakout traders before dropping. If price breaks below 102,643 with momentum, expect a sweep of the FVG and weak low.
🎯 Bonus Watch:
If price returns to the OB but fails to break CRT High again = solid re-entry confirmation 📉🧠

BTCUSD 1H | Liquidity Grab + FVG Play Before Bullish Expansion📊 BTC/USD 1-Hour Smart Money Outlook — May 15, 2025
Bitcoin is setting up for a classic SMC combo move — targeting sell-side liquidity before flipping bullish and running for the buy-side liquidity at ~$106K.
Let’s break it down 👇
🧠 1. The Setup
Price broke structure to the downside ✅
Heading into a liquidity sweep of the recent lows around $100,000
Major Fair Value Gap lies between $98,100–$96,800
This gap aligns with the 61.8–70.5% fib zone — a premium rebalance area for smart money
🔍 2. Expectations
Short-Term Bearish into FVG → Sell-side liquidity gets swept
Then strong bullish reversal targeting:
🔹 First target: $103,000
🔹 Final target: $105,787 (Buy-side liquidity + Weak High)
Trade Idea: Long after FVG rejection confirmation
SL below $96,800, TP up to $106K — insane RRR of 1:4+
⚠️ 3. Risk Management
Wait for a bullish reaction inside the FVG zone
Protect capital if price closes below $96,800 → setup invalid
Look out for NY session volatility and CPI/FOMC-driven fakeouts
This is textbook Smart Money behavior: draw liquidity, rebalance price, and expand into inefficient price zones. If you're not trading with liquidity in mind — you're the liquidity. 🧠💸
💬 Comment “🚀” if you're long from the Fair Value Gap zone!
🎯 Follow @ChartNinjas88 for daily sniper setups and smart money breakdowns!

USDCHF 30M | Fair Value Gap Sell Setup Inside Bearish Channel📊 USD/CHF Smart Money Breakdown — May 16, 2025
Here’s a clean SMC-driven setup where price respects the bearish order flow, taps a Fair Value Gap (FVG) and rejects right at liquidity inducement levels.
Let’s break it down 👇
🔍 1. Context
Price is respecting a descending channel structure
Clean internal liquidity run up into:
✅ FVG zone from prior imbalance
✅ Top of bearish channel trendline
This is a classic liquidity sweep before expansion lower
🎯 2. Entry Plan
Entry zone: 0.8375–0.8391 (FVG zone shaded in red)
Stop loss: Just above 0.8391 (invalidates FVG zone)
Target zone:
🟢 TP1 → 0.8340 (minor inefficiency fill)
🟢 TP2 → 0.8327 (liquidity resting at the low)
➡️ RR ratio is about 1:3 on full target — clean sniper range!
📉 3. Smart Money Logic
Retail likely triggered buy orders into that FVG zone
Institutions tap FVG for premium entry
Price already printing rejection wicks — early signs of displacement
Watch for confirmation via:
Bearish engulfing candle close
Break of minor bullish structure on 5m
⚠️ Risk Notes:
Watch out for USD fundamental news that might cause a fakeout spike
Let price confirm breakdown before stacking entries
💬 Do you trust the FVG? Or think price will smash through?
🧠 Drop your confluence in the comments below and follow @ChartNinjas88 for precision setups like this every day.

XAUUSD Hits FVG in Premium Zone — Bearish Setup in Play!📉 XAUUSD (Gold) has just tapped into a key Fair Value Gap (FVG) after a clean, impulsive rally — now we’re watching for Smart Money distribution and a potential reversal from this high-risk premium area.
📊 Chart Insights:
✅ Price retraced into the FVG zone between $3,225 – $3,240
✅ This zone aligns with the 79% Fibonacci retracement, making it a premium zone for shorts
✅ Market structure shows previous bearish impulse → this could be a retracement before continuation
✅ Current PA is reacting to the imbalance left on the drop
✅ Massive downside potential to rebalance price near $3,120
🧠 Smart Money Confluence:
FVGs are often rebalanced after price trades away impulsively
The retrace into this inefficient pricing zone is classic Smart Money mitigation
Price now sits in an area where institutions may look to offload long positions
📍 Potential Play:
Short Entry Zone: $3,225 – $3,240
Targets:
TP1: $3,200
TP2: $3,170 (mid-level liquidity)
TP3: $3,120 (full FVG fill and higher TF draw)
Invalidation: Clean break and hold above $3,240
💡 Pro Tip:
Watch for a lower timeframe structure shift (15m/5m) or confirmation candle to stack entries. The market loves to sweep highs before the real move begins — patience pays. 🧠💰
📈 This setup offers 3:1+ RR and aligns with Smart Money’s tendency to sell into imbalance and hunt liquidity below.
💬 Comment “Gold Setup” if you’re trading this one!
🔁 Share or save if you're watching for the drop.

Bitcoin – Sweep the Highs, Next Target $98kMarket Overview
Bitcoin has been trading sideways for more than 8 days now, forming a tight consolidation range with no real breakout in sight. This kind of price action typically signals accumulation or distribution by larger players. While it may seem indecisive on the surface, this phase is often where the market sets its trap. What looks like inaction is actually a setup in progress. Price is compressing, volume is thinning out, and both bulls and bears are being lured in. That’s a perfect recipe for a sudden, aggressive move that wipes out one side entirely.
Liquidity Structure
The structure of this range is very clean, which in trading terms usually means dangerous. On the top side, we have a lot of liquidity, just above $105,800. This level has been tapped multiple times but never convincingly broken, and it now acts as a magnet for liquidity. On the flip side, the downside holds multiple clean lows, all clustered under the $100,000 mark. Both ends of this range are packed with liquidity. Smart money doesn’t trade in fair value, it trades where the most liquidity sits, and in this case, both the top and bottom of the range are loaded.
Inducement and Manipulation
The real purpose of this kind of range is not balance, it’s inducement. The market is inviting traders to take breakout positions on both sides, knowing full well that it’s unlikely to follow through cleanly. I believe we are currently in the inducement phase of the cycle. The equal highs around $105,800 are baiting breakout longs and short stop-losses alike. A move above that level would act as the stop hunt, triggering the final wave of longs before the rug is pulled. Once that liquidity is taken, I expect a sharp reversal that targets the lows of the range and continues further toward the real pool of liquidity sitting between $98,000 and $97,500.
Scenario Outlook
The most probable sequence from here is a fake breakout to the upside, followed by an impulsive selloff. A wick above $105,800 would serve as the signal, and once that inducement is cleared, the move down should be fast and decisive. This drop would take out the range lows and sweep the stops of everyone who tried to buy the breakout. If price does hold above $105,800 and shows continuation with strong volume and follow-through, that would be an invalidation of this short setup and a shift in structure, in which case I would reassess and wait for a pullback before considering any longs.
Price Target and Expectations
The first key event is the sweep above $105,800. That’s where breakout traders will commit, and that’s where I expect the reversal to begin. From there, downside targets include the low of the range and deeper liquidity near $98,000 to $97,500. This area aligns with a big imbalance zone, inefficiencies and the golden pocket fib level.. The expectation is for a quick drop once the trap is sprung, with a potential for a reaction or even a new bullish setup forming near that demand region.
Conclusion
Bitcoin has been compressing for over a week, and that usually ends with expansion. But expansion is not always trend continuation, especially when the structure suggests manipulation. The current setup looks ideal for a stop run above the range before dumping into deeper liquidity. The key is to wait for the sweep and watch how price reacts. The more obvious the breakout, the more likely it is to fail. Liquidity is king in this environment, and right now, the biggest pockets lie below.
___________________________________
Thanks for your support!
If you found this idea helpful or learned something new, drop a like 👍 and leave a comment, I’d love to hear your thoughts! 🚀
Make sure to follow me for more price action insights, free indicators, and trading strategies. Let’s grow and trade smarter together! 📈

EURUSD – Rebalancing Before Repricing HigherEURUSD is currently trading within a corrective phase after failing to sustain its bullish momentum from the earlier impulsive rally. The market structure on the 1-hour chart shows a clean breakdown from recent highs, with sellers starting to step in more aggressively. This pullback feels more like a calculated retracement than a complete trend reversal, and the market may be seeking out a deeper discount before any continuation higher. With multiple rejections forming at lower highs and downside pressure increasing, it looks like EURUSD wants to drive lower first before making a run for higher levels.
Consolidation Structure
We’ve been consolidating after the last upward push, forming a short-term range with price grinding sideways but gradually bleeding lower. What stands out is the clear cluster of equal lows forming, acting as obvious sell-side liquidity. Just below that area sits a 1-hour fair value gap that remains unmitigated, offering a strong magnet for price. The FVG sits just beneath the golden pocket zone, which adds more confluence for a potential reaction from that area. This range looks designed to draw in early buyers, only to flush them out before price finds real support.
Bearish Scenario – Setup for a Deeper Retracement
Right now, the structure leans bearish in the short term. The market looks like it wants to run the lows and wick into the 1-hour fair value gap sitting below the golden pocket. This area is an unmitigated imbalance that lines up perfectly with the idea of a final liquidity grab. I’m expecting price to reach down into that gap, around the 1.112 region, before any kind of reversal occurs. The goal of this move would be to clear out stops and rebalance the inefficiency from the previous rally, setting the stage for the next leg higher.
Bullish Scenario – Reversal from Discount
Once price trades into the 1.112 zone and sweeps the current lows, the setup for a bullish reversal becomes much cleaner. That area offers a combination of liquidity, inefficiency, and fib confluence, making it a high-probability level for buyers to step back in. If we get a solid rejection or displacement out of that level, the upside potential opens up quickly. The idea is that after this corrective move and stop hunt, the market reclaims momentum and starts driving toward the next key structure zone.
Price Target and Expectations
If price delivers the expected sweep and mitigation into 1.112, I’ll be looking for confirmation of bullish intent and signs of strength to enter long. The target sits much higher, all the way at the 0.28 fib level, which is around 1.20. That level offers a logical take-profit zone based on fib projection and structure alignment. The potential reward-to-risk on this move is excellent if the entry holds and the displacement confirms. This would essentially be a play on manipulation and continuation, classic liquidity run before expansion.
Conclusion
EURUSD is setting up nicely for a textbook sweep-and-reverse play. The market is currently moving lower, and I’m expecting that move to extend into the 1-hour FVG just below the golden pocket, targeting an entry near 1.112. From there, if price reacts cleanly, the next leg should aim for the 0.28 fib level at 1.20. All the ingredients are there: a clean imbalance, obvious liquidity to take, and a higher-timeframe fib target to anchor the move. Just need to wait for price to do its job and follow the plan.
___________________________________
Thanks for your support!
If you found this idea helpful or learned something new, drop a like 👍 and leave a comment, I’d love to hear your thoughts! 🚀
Make sure to follow me for more price action insights, free indicators, and trading strategies. Let’s grow and trade smarter together! 📈

Short Idea EURUSDShorting EURUSD once liquidity is taken probably tomorrow.
I set a Sell limit order and I will scale in once we have a new bearish 15m FVG formed after reaching the 15m OB.

Bitcoin – Respecting $103k FVG, Approaching ATH.Bitcoin failed to fully fill the large 4h and 1h FVG around the $100,000 zone, front-running the level before bouncing sharply. This type of price behavior suggests strong demand, with buyers stepping in aggressively before the inefficiency could be completely mitigated. The market is now shifting back to a more bullish tone after establishing a short-term bottom near the key higher-timeframe FVG.
Consolidation Structure
The price action has been messy and range-bound over the past few days, stuck between the major 1h/4h demand zone around $102,000 and the $105,000 resistance level. Within that broader range, Bitcoin created a new 1h FVG on the push off the lows, which has already been respected intraday around the $103,000 area. That newly formed FVG now acts as short-term support as price grinds upward again toward the prior resistance.
Bullish/Bearish Scenarios
On the bullish side, if Bitcoin flips the $104,500 to $105,000 resistance area cleanly into support with a convincing displacement and consolidation above it, there’s a good chance it will break out and target higher inefficiencies above $106,000. That would confirm buyers are in full control and using each FVG as a stepping stone higher.
However, if price gets rejected again inside the resistance zone without showing signs of strength or accumulation just below it, we could see another rotation lower back to the $100,000 FVG or potentially even a deeper retest of the broader $97,500 area. A rejection at the highs could align with a sweep of local buy-side liquidity and serve as a trigger for a short-term reversal.
Price Target and Expectations
Upside breakout targets sit around $106,200 and higher, based on the previous price inefficiencies and trend structure. On the downside, if we see rejection, price may revisit $100,000 and possibly test the deeper 4h imbalance zone closer to $97,500 again.
Current Stance
For now, price is trading inside the upper portion of the range and grinding into a known resistance area. There’s no clear confirmation yet of either a breakout or rejection, so the next move depends heavily on how price reacts within the $104,500 to $105,000 zone. Watching for either bullish continuation (with a clean flip and hold above) or a strong rejection setup for a possible fade back into the midrange.
Conclusion
Bitcoin continues to respect FVGs both to the downside and upside. The bounce from the 1h/4h demand confirms higher timeframe interest, and the respect of the new 1h FVG around $103,000 shows short-term strength. The next major decision point is the $105,000 resistance. A clean break and flip could signal continuation, while rejection there may trap longs and send price back toward demand.

EURUSD Just Landed in the Killzone — Bounce or Breakdown?🔥 EURUSD 15-Min SMC Precision Play — May 14, 2025
Here’s a sweet Smart Money sniper entry on EURUSD, caught right as price tagged a powerful triple confluence zone:
📊 1. Structure & Momentum
Recent bullish momentum created a weak high around 1.12660
Retracement follows with strong bearish pressure
Price lands exactly at a previous OB, Fair Value Gap, and the 61.8% fib retracement
🧱 2. Confluence Breakdown
🔴 Fair Value Gap (FVG): Unfilled imbalance tapped
🟣 Order Block (OB): The last down candle before bullish rally
🟡 61.8% Fibonacci Level: Price kissed the golden pocket
This stacking creates a high-probability reversal zone
🎯 3. Trade Plan
Entry: Around 1.12160
SL: Below 1.12090 (under 70.5% fib)
TP: At 1.12660 targeting previous weak high
RRR ≈ 1:6 — optimal asymmetric reward play
🔄 4. Management & Outlook
Watch for reaction on the 50% level at 1.12300
Break of market structure above 1.12400 = confirmation
Scaling out advised at midline levels with stop-loss trailed manually
🧠 Smart Money knows this is where the liquidity pools live. You're not late — you're patiently positioned where the institutions hunt.
🎯 Drop a “📍” in the comments if you're watching EURUSD
🎥 Follow for more sniper setups like this one — @ChartNinjas88

Bitcoin - $100k retest before new ATH?Bitcoin has broken out of its 1-hour ascending channel with a sharp bearish displacement, ending the slow grind higher that had been in place since the 9th of May. That channel served as a controlled environment for accumulation and small trend continuation, but the move we just saw confirms that the phase of balance has shifted into a clear retracement. The displacement candle was strong, clean, and aggressive, closing well outside the lower boundary of the channel and taking out multiple internal lows in the process. This wasn’t a weak break, it showed intent.
From a market structure standpoint, this confirms that short-term control has shifted to the downside. That move also left behind a visible Fair Value Gap just above current price, which is likely to act as a draw in the coming sessions. Unless that FVG gets reclaimed impulsively, this looks like the beginning of a deeper retracement.
Consolidation Structure
Prior to the break, BTC was building liquidity inside a clean ascending channel. The highs kept getting swept by small wicks, which hints at repeated inducement and short-term stop hunts. The final push into the top of the channel marked the last bullish attempt, and price immediately reversed after that sweep. The moment it broke structure with a high-volume bearish candle, the entire channel was invalidated and turned into supply.
We now have a clean CISD framework in play, price consolidated inside a channel, created inducement near the highs, triggered a stop hunt into the upper end of the range, and then dropped with strong displacement. That displacement not only broke structure but also left behind an imbalance that has yet to be filled.
Bullish/Bearish Scenarios
Right now, the short-term bias is bearish. The break of structure is confirmed, the Fair Value Gap is still open, and there is a clear inefficiency left behind. I expect price to revisit that gap and then reject to the downside again. That would complete the FVG retest leg and open the door for a move into deeper zones.
The next key area of interest is around the $100,000 mark, slightly below the current trading range. That level holds both technical and psychological weight. It lines up with a previous breakout zone, an unfilled imbalance, and likely a large pool of resting liquidity from retail long stops and institutional bids. If we reach that zone, I’ll be watching for signs of strength to suggest that this pullback was a liquidity grab before the next leg up.
If we do get that tap into $100K and price responds with bullish displacement from there, the bullish narrative would be back in play. That could easily form the base for a new impulse toward all-time highs. However, if $100K fails to hold and price pushes through without a significant reaction, then we’re dealing with a larger correction, and I’d expect continuation toward lower inefficiencies.
Price Target and Expectations
First, I expect a small leg up to fill the Fair Value Gap inside the broken channel structure. That area will act as the first test, and if price shows rejection there, I’m looking for continuation toward the $100,000 to $99,500 region. That zone aligns with a clean 1H imbalance and marks the origin of the last strong bullish expansion.
If BTC taps into that deeper imbalance and confirms a reversal with clear bullish intent, the stage will be set for a potential breakout into new all-time highs. That’s where I would expect stronger hands to step in and take control. The longer price holds above that $99k zone, the higher the odds we break past the previous high.
But if there’s no reaction and price bleeds through $99K, the bullish structure on the higher timeframes would be compromised, and the move could extend toward the mid-$90K range.
Current Stance
Short-term bearish, waiting for price to retest the FVG inside the previous channel. That will be the first key area where I expect a reaction. If the rejection confirms, I’ll be watching for signs of continuation into $100K.
Not interested in chasing price between levels. I’ll either look to short the FVG retest with confirmation or wait for the deeper tap into the $100K zone to look for a long setup. No trades in the middle, only acting at the extremes where the risk-reward makes sense.
Conclusion
This setup fits cleanly into a classic displacement narrative. Bitcoin broke out of structure with a high-volume move, left behind an FVG, and is now likely preparing for a short retrace before continuing lower. The $100K zone is the main area to watch — that’s where the next high-probability trade opportunity is likely to develop. If bulls defend that zone and we get bullish confirmation, the path to new highs is still intact. But if $99K fails, I’ll be sidelined and looking for the next major level.
The structure is clear, the inefficiencies are visible, and the plan is defined. Now it’s just about waiting for price to do its job.
___________________________________
Thanks for your support!
If you found this idea helpful or learned something new, drop a like 👍 and leave a comment, I’d love to hear your thoughts! 🚀
Make sure to follow me for more price action insights, free indicators, and trading strategies. Let’s grow and trade smarter together! 📈

Gold Bulls Are Loading — Don’t Miss the Fair Value Launch Zone🔍 XAUUSD 30M | Smart Money Breakdown
Gold just gave a liquidation + FVG bounce setup with a high-probability bullish reaction.
Let’s break it down like a sniper 🧠👇
🔻 1. Falling Channel Structure
Gold’s been grinding down in a neat descending channel, consistently taking out liquidity beneath swing lows.
This compression usually ends in aggressive expansion — and Smart Money knows it.
🔁 2. FVG Reclaim = Institutional Entry Zone
The chart shows a Fair Value Gap (FVG) perfectly respected around $3,226 – $3,236.
Price dipped into this imbalance and is now reacting — textbook Smart Money entry.
You're seeing clear demand stepping in after a sell-side liquidity sweep.
📈 3. Target = Upper Channel + Imbalance Fill
If momentum holds, Gold likely reaches for the upper channel resistance and fills the imbalance zone up to ~$3,280+.
That’s your primary draw on liquidity.
🎯 4. Trade Plan (RR ~3:1)
📍 Entry: Around FVG zone ($3,226–$3,236)
❌ Stop-Loss: Below the FVG zone
✅ TP: $3,280 (upper channel tap)
Smart Money is entering early while retail waits for confirmation breakouts 👀
🧩 Key Confluences:
✅ Falling Channel
✅ Fair Value Gap Tap
✅ Bullish Engulfing Response
✅ Clean RRR Setup
✅ Liquidity Sweep Prior to Entry
📊 Summary:
This setup screams Smart Money Accumulation. Gold hunts the lows, reclaims the imbalance, and is now gearing up for a bullish run. The reaction off the FVG is your golden ticket.
Let price work — don’t chase, just manage risk like a pro.
💬 Comment “💰 XAU Sniper Setup” if you caught this one early!
⚔️ Follow @ChartNinjas88 for elite Smart Money plays.
👀 Tag a trader still shorting this range 😅

USDCHF 30M Smart Money Entry from Demand — Watch This Level🧠 USDCHF 30M | SMC Precision Entry
Let’s break down this sniper play on USDCHF that’s setting up right from a Smart Money demand zone.
🔻 1. Liquidity Sweep Into Demand
Price broke structure earlier, then pulled back into a clear demand block.
We saw liquidity grabbed beneath multiple swing lows before this sharp rejection.
This is classic Smart Money accumulation — they take out weak hands before pumping it up.
🧱 2. Order Block + FVG Alignment
Price is reacting off a refined OB zone (marked in red) with a Fair Value Gap right above.
That OB was the last down move before the push up, and price just tapped into it clean.
The overlap of these two areas adds confluence for bulls.
📈 3. Entry + TP Setup (RRR ≈ 3:1)
📍 Entry Zone: 0.84070 – 0.84200 (inside OB)
❌ Stop-Loss: Below OB, around 0.84000
✅ Take Profit: 0.84750 (clean imbalance above)
There’s a wide imbalance zone above, which price may be magnetized toward.
🔥 4. Why This Works
✅ Liquidity Grab
✅ OB + FVG Confluence
✅ Bullish Reaction Wicks
✅ Tight SL Below Structure
✅ Clean RRR
This setup is Smart Money 101 — let them sweep, you step in with precision 💯
💬 Drop “📍USDCHF OB Tap” if you saw this coming.
📊 Follow @ChartNinjas88 for SMC setups that work.

EURUSD – Bearish Rejection and Targeting the 4H Imbalance ZoneEURUSD has shifted into a clear bearish tone following multiple rejections from a well-established resistance level. Over the past several weeks, price has struggled to break above that zone, showing consistent signs of selling pressure each time it attempted a push higher. The most notable move came when price briefly spiked above the resistance in what now appears to be a fakeout. That move did not hold, and it’s very likely that it served as a classic liquidity grab engineered to sweep buy stops resting above the range highs before reversing direction.
This kind of behavior is typical in a distribution phase, especially when seen at a high-timeframe resistance zone. The fake breakout essentially confirms that the upside liquidity has been taken, and that smart money is shifting direction. Since that event, price has been making lower highs and lower lows, reinforcing the current bearish structure.
Consolidation Structure
Before the fakeout, EURUSD had been consolidating just under resistance, building up a tight range. This kind of structure tends to lure in breakout traders, and the eventual spike above the range likely cleaned out a lot of stop orders. What followed was an aggressive reversal back into the prior range, which is a strong sign that the breakout was not genuine.
Since then, price pushed down and attempted a retracement, but that retracement got rejected precisely within a fair value gap. This is significant. It tells us that even during a pullback, the market is respecting inefficiencies and continues to deliver bearish reactions rather than signs of strength. That rejection further confirms that bears remain in control and that the earlier break was nothing more than a trap.
Bearish Scenario
With resistance holding and the fair value gap rejection now confirmed, I expect EURUSD to continue its descent and seek out deeper levels of interest. The most obvious draw on liquidity now sits below the current price, the large four-hour imbalance zone. This imbalance was left behind during the impulsive rally that preceded the fakeout, and it has yet to be filled.
Inside that imbalance, there’s also a golden pocket level lining up almost perfectly. That confluence between the imbalance zone and the 0.618–0.65 region adds weight to the idea that this area will act as a magnet for price. Markets seek efficiency, and this entire zone represents a void that price is likely to come back and rebalance.
The move into that zone would also allow the market to engineer sell-side liquidity along the way, particularly under the recent higher lows. Once those are swept, and if price begins to react inside the golden pocket, we may then begin to look for early signs of accumulation or even a bullish displacement, but until then, the short bias remains firmly in play.
Price Target and Expectations
The first key expectation is a clean sweep through the current local lows and a drive into the heart of the 4-hour imbalance. This is where I’ll be watching most closely for a potential change in behavior. Ideally, I want to see price push deep into the imbalance and tap the golden pocket before doing anything significant on the long side.
If price shows a strong reaction there, such as a bullish engulfing or a clear market structure shift that would signal the potential for a reversal. Until then, any bounce is likely to be short-lived and corrective in nature. The structure is still bearish, and the fair value gap rejection reinforces that.
Current Stance
Right now, I remain bearish. I’m not interested in fighting this momentum by jumping into premature longs. As long as price remains under the level it got rejected from, and continues to print lower highs, I’ll maintain a sell-the-rip mindset. If price delivers a deeper pullback from here, it may offer a short-term intra-day bounce, but the core expectation is still a move lower into the imbalance zone.
The area that interests me the most is the combination of the 4-hour imbalance and golden pocket, that’s the zone where I’ll shift from reactive to proactive and start looking for possible long setups. But I won’t consider longs unless price gets there and shows clear intent to reverse.
Conclusion
The market has already swept buy-side liquidity with the fakeout above resistance, and the rejection from the fair value gap confirms that sellers are still in control. Price is now being drawn toward the inefficiency below, and all signs point toward a continued bearish move until that imbalance is filled.
Until price reaches that zone and delivers a reaction worth trading, I’m staying patient and waiting for the setup to complete. Chasing entries in the middle of the range here doesn’t offer the best risk-reward. The focus now is on watching how price interacts with the 4-hour imbalance and the golden pocket, that’s where I’ll reassess the narrative and consider shifting bias if conditions warrant it.
___________________________________
Thanks for your support!
If you found this idea helpful or learned something new, drop a like 👍 and leave a comment, I’d love to hear your thoughts! 🚀
Make sure to follow me for more price action insights, free indicators, and trading strategies. Let’s grow and trade smarter together! 📈

SUI - Leveraging Fibonacci & Elliott for Precision TradesSUI’s movement is rapid, sharp swings—both up and down. In volatile conditions like this, we aim 0.702–0.786 fib retracements (and occasionally 0.886 in harmonic contexts) for high‑probability entries. Below is a clear, Elliott-focused breakdown of the current setup and both long and short trade plans.
Before diving into the charts, let’s cover the basics of Elliott Wave Theory. Elliott Wave Theory provides a roadmap for market psychology by dividing price action into two distinct phases:
1. Impulse Phase (Waves 1–5)
Wave 1: The spark that ignites a new trend as early adopters push prices beyond the prior range.
Wave 2: A corrective pullback that tests the strength of the emerging trend, often retracing 38–61.8%.
Wave 3: The powerhouse wave—typically the longest and most dynamic—driven by broad market participation and often extending to key Fibonacci levels (1.618, 2.618).
Wave 4: A consolidating correction that digests gains and builds the base for the final thrust; it must not overlap Wave 1 territory in a classic impulse.
Wave 5: The final leg of the advance, often fueled by last bursts of optimism and weaker hands.
2. Corrective Phase (Waves A–B–C)
Wave A: Initial counter-trend reaction as profit-taking begins.
Wave B: A deceptive retracement back toward the trend, frequently trapping traders.
Wave C: The concluding leg of the correction, which typically tests or breaks the low of Wave A before the next cycle begins.
Key Points:
Impulse waves showcase momentum and structural clarity, often aligning with Fibonacci extensions.
Corrective waves follow Fibonacci retracements (38.2%, 50%, 61.8%), offering optimal entry points.
Wave 3 is seldom the shortest; Wave 4’s complexity sets the stage for Wave 5’s final push.
In the current SUI structure:
Wave 1 ignited the initial rally.
Wave 2 delivered a healthy retracement, a pullback close to the 0.618 fib, setting the stage for stronger momentum.
Wave 3 roared to a powerful peak topped at the 2.618 extension ($3.875)
Now, we’re deep into Wave 4, likely an ABC corrective pattern. This pause is critical—it gathers energy before the final push of Wave 5. Below is a clear breakdown of each wave, big-picture confluences, and trade setups.
🚀 Elliott Wave Overview
1. Wave 1 & Wave 2
Wave 1: Quick surge from $2.4175 → $2.75, setting initial momentum.
Wave 2: Pulled back close to the 0.618 fib, creating a solid launchpad.
2. Wave 3: The Power Move
Peak: Hit the 2.618 extension of Wave 1→2 and aligned with the –2 extension of Wave 1.
Significance: In strong bull markets, a run to the 2.618 extension often precedes a meaningful pullback. Here, Wave 3’s exhaustion suggests a retrace toward the 38.2% Fib of that advance—our ideal Wave 4 entry zone.
3. Wave 4: The Correction
All eyes on the $3.17 level—the projected 1:1 extension of A→B and 0.382 fib retracement of Wave 3. This confluence zone is yet to be tested and could offer an ideal Wave 4 entry.
ABC Pattern: Currently working on Wave C.
4. Wave 5: The Finale
Target Zone: $4.00–$4.35, with strong focus at $4.31
Extension Levels:
1.133 → $3.9695 aligns with the 0.618 fib retracement.
1.272 → $4.0683 is close to the weekly resistance level.
1.412 → $4.1678 alings with the 0.666 fib retracement.
1.618 → $4.3142 alings with the key swing high.
🔑 Key Confluence Levels
Golden Pocket: $3.9739–$4.1492 (90-day retrace).
Speed Fan 0.618: Support around $3.15.
Fair Value Gap:
Psychological: $3.00 major support.
📈 Long Trade Setup
Entry Ladder: $3.25–$3.111 (stack orders to DCA)
Stop‑Loss: $3.07 (just below the 0.786 Fib low)
Profit Targets:
Fib 1.133 at $3.9795 ($4 psychological & partial take‑profit)
Fib 1.272 at $4.0683
Fib 1.412 at $4.1678
Fib 1.618 at $4.3142
Risk:Reward: ~6:1+ (average entry around $3.20 → SL at $3.07 → TP1 at $3.9795)
📉 Short Trade Setup
Entry Zone: $4.00–$4.35 (sweet spot at weekly level/yearly open)
Confirmation: Bearish reversal candle or volume spike down
Stop‑Loss: Above $4.35
Target: $3.77 (near Wave 3 high turned support)
Risk:Reward: ~2:1 (varies with DCA entry)
⚙️ Summary & Game Plan
Primary Bias: Long in the $3.25–$3.111 zone—stack into the 0.382-0.412 fib retracement entries with tight SL, aiming for the $4.00–$4.30 upside zone.
Alternate Bias: Short on a clear rejection within $4.00–$4.35, targeting $3.77 or lower.
Risk Management: Keep stops tight to maximize R:R.
Patience & Confirmation: Wait for price to reach these zones and show reversal signals (price action, volume, patterns) before committing.
All set—now let SUI’s swings unveil the opportunities. Sit tight, follow your plan, and let patience pay its dividend.
Happy Trading!
____________________________________
If you found this helpful, leave a like and comment below! Got requests for the next technical analysis? Let me know.

USDJPY Smart Money Short Setup | 30m OB + FVG Reaction🧠 USDJPY 30m SMC Setup | May 9, 2025
We’ve got a high-probability short brewing as price taps the premium zone and aligns with multiple Smart Money Concepts. A clear Fair Value Gap (FVG) is sitting inside a bearish Order Block, with price aggressively wicking into it — right where institutions unload.
🔍 KEY CONFLUENCES:
🧱 Bearish Order Block rejection in premium
⚡ Fair Value Gap filled at 145.910
💰 Risk-to-Reward ~1:4+, targeting discounted zone
🧲 Liquidity sweep + FVG fill = SM distribution trigger
⏳ Entry timing aligned with NY session reaction
📊 Setup Specs:
Pair: USDJPY
Timeframe: 30 min
Entry: 145.910 (after FVG fill)
SL: ~146.246
TP: ~144.440
RR: Approx. 1:4.5
💡 Smart Money Logic:
Price filled a clean imbalance zone, ran liquidity from earlier highs, and instantly showed distribution behavior. If momentum confirms with a bearish break, this becomes a high-conviction short.
📈 Chart Ninja Note:
“FVG + OB is where the banks sell while the crowd buys… don’t be the crowd.”

Bitcoin – Price Hits $100K, Will It Hold or Dive Into Demand?Bitcoin has officially reached the long-anticipated $100,000 mark, sweeping the psychological round number and clearing out a major pool of liquidity sitting just above it. This move came off the back of a sharp and impulsive leg, likely fueled by both spot demand and late-stage FOMO-driven breakout longs. At the same time, short liquidations added fuel to the upside, pushing price rapidly through thin areas on the volume profile. This type of vertical movement typically doesn’t last long without some form of corrective structure, and now that the $100K level has been tagged and liquidity taken, we can reasonably expect a period of cooling off, either through time-based consolidation or a more price-based retracement.
Consolidation Structure
The move up left behind two significant fair value gaps (FVGs) on the 4H chart. The first sits just beneath current price and represents the immediate imbalance created by the impulsive breakout candle. This is the shallowest inefficiency and would be the first area to watch for a potential short-term reaction. The second FVG lies deeper and overlaps perfectly with the 0.618 to 0.65 Fibonacci retracement zone, the golden pocket. This deeper zone is structurally more important, not only because it aligns with the golden pocket ratio but also due to its proximity to the high-volume node clearly visible on the Volume Profile (VRVP). Below this zone, there’s a strong base of support built from the previous consolidation area, making it a prime candidate for a bounce if tested.
Bullish/Bearish Scenarios
Scenario 1: In the bullish continuation case, Bitcoin retraces slightly to fill the shallow FVG just beneath $99K. A clean reaction there, especially if backed by strong volume and low timeframe bullish structure, could lead to a resumption of the trend with a fresh leg upward. This scenario assumes that the current breakout is being respected by the market and that participants are eager to front-run deeper entries. If this plays out, we’d expect a relatively quick reclaim of $100K, potentially building a new higher-low formation before continuing into uncharted territory above $102K.
Scenario 2: The second and more complex scenario involves a deeper retracement toward the lower FVG and golden pocket, between roughly $96.2K and $95.2K. This would constitute a cleaner reset of the recent move and allow the market to shake out weak longs who entered during the euphoric breakout. It also opens the door for a possible inducement setup, drawing in early sellers only to reverse at a key confluence zone. The golden pocket, combined with the high-volume node just below, makes this a high-probability demand zone. If we see bullish SFPs, displacement candles, or lower timeframe market structure shifts from there, it would be a strong long entry zone for a reattempt at the highs.
Price Target and Expectations
If Scenario 1 plays out, we can expect price to reclaim the $100K level fairly quickly, with upside potential toward $102K to $103K in the near term. The risk here is limited, given the shallowness of the retracement, but continuation would likely be more gradual and grindy due to the lack of a proper reset. If Scenario 2 plays out, the bounce from the golden pocket could produce a much healthier structure for further upside, and in that case, targets beyond $104K become more viable. The lower retracement would offer a better R/R and allow the market to rebuild momentum organically.
Current Stance
Right now, we remain bullish on the higher timeframes, but recognize the need for a local correction. We’re not interested in chasing the breakout blindly, the move has already cleared a major liquidity level and needs to rebalance before any sustainable continuation. We’re watching both FVGs closely. If the first one fills and holds, we’ll look for signs of strength and continuation. But if price breaks deeper, we’ll shift our focus to the golden pocket and bottom FVG as the more attractive long entry. Below that, the VRVP shows thick support, so our bias remains bullish unless we get a confirmed breakdown beneath that base.
Conclusion
Bitcoin has done its job in tagging $100K and clearing the obvious liquidity pool above. What comes next is all about how the market digests that move. Either we get a shallow retracement into the first imbalance and continue higher from there, or we go deeper into the golden pocket and establish a more meaningful base. Both scenarios still lean bullish, the key is patience and waiting for the right structure to develop. There’s no need to force entries here. Let price come to your levels, wait for confirmation, and take the trade when the setup aligns.
___________________________________
Thanks for your support!
If you found this idea helpful or learned something new, drop a like 👍 and leave a comment, I’d love to hear your thoughts! 🚀
Make sure to follow me for more price action insights, free indicators, and trading strategies. Let’s grow and trade smarter together! 📈

Mastering Fair Value Gaps (FVG) - How to use them in trading?In this guide, I’ll explain the concept of the Fair Value Gap (FVG), how it forms, and how you can use it to identify high-probability trading opportunities. You'll learn how to spot FVGs on a chart, understand their significance in price action, and apply a simple strategy to trade them effectively.
What will be explained:
- What is a FVG?
- How can a FVG occur?
- What is a bullish FVG?
- What is a bearish FVG?
- How to trade a FVG?
-------------------------------
What is a FVG?
A FVG is a technical concept used by traders to identify inefficiencies in price movement on a chart. The idea behind a fair value gap is that during periods of strong momentum, price can move so quickly that it leaves behind a "gap" where not all buy and sell orders were able to be executed efficiently. This gap creates an imbalance in the market, which price may later revisit in an attempt to rebalance supply and demand.
A fair value gap is typically observed within a sequence of three candles (or bars). The first candle marks the beginning of a strong move. The second candle shows a significant directional push, either bullish or bearish, often with a long body indicating strong momentum. The third candle continues in the direction of the move, opening and closing beyond the range of the first candle. The fair value gap itself is defined by the price range between the high of the first candle and the low of the third candle (in the case of a bullish move), or between the low of the first candle and the high of the third (in a bearish move). This range represents the area of imbalance or inefficiency.
-------------------------------
How can a FVG occur?
There are several factors that can trigger a fair value gap
- Economic news and announcements
- Earnings reports
- Market sentiment
- Supply and demand imbalances
-------------------------------
What is a bullish FVG?
A bullish FVG is a specific type of price imbalance that occurs during a strong upward move in the market. It represents a zone where the price moved so aggressively to the upside that it didn’t spend time trading through a particular range, essentially skipping over it.
This gap usually forms over the course of three candles. First, a bullish candle marks the beginning of upward momentum. The second candle is also bullish and typically has a large body, indicating strong buying pressure. The third candle opens higher and continues moving upward, confirming the strength of the move. The bullish fair value gap is the price range between the high of the first candle and the low of the third candle. This area is considered an imbalance zone because the market moved too quickly for all buyers and sellers to interact at those prices.
-------------------------------
What is a bearish FVG?
A bearish FVG is a price imbalance that forms during a strong downward move in the market. It occurs when price drops so rapidly that it leaves behind a section on the chart where little to no trading activity happened.
This gap is identified using a three-candle formation. The first candle typically closes bearish or neutral, marking the start of the move. The second candle is strongly bearish, with a long body indicating aggressive selling pressure. The third candle opens lower and continues the move down. The bearish fair value gap is the price range between the low of the first candle and the high of the third candle. That range is considered the imbalance zone, where price skipped over potential trade interactions.
-------------------------------
How to trade a FVG?
To trade a FVG effectively, wait for price to retrace back into the gap after it has formed. The ideal entry point is around the 50% fill of the FVG, as this often represents a balanced level where price is likely to react.
During the retracement, it’s helpful to see if the FVG zone aligns with other key technical areas such as support or resistance levels, Fibonacci retracement levels, or dynamic indicators like moving averages. These additional confluences can strengthen the validity of the zone and increase the probability of a successful trade.
Enter the trade at the 50% level of the FVG, and place your stop loss just below the most recent swing low (for a bullish setup) or swing high (for a bearish one). From there, manage the trade according to your risk-to-reward preferences—whether that’s 1:1, 1:2, or a higher ratio depending on your strategy and market conditions.
-------------------------------
Thanks for your support.
- Make sure to follow me so you don't miss out on the next analysis!
- Drop a like and leave a comment!

EU SHORTS FOR TODAY___ Mount Olympus Capital says.I am looking for a short on the EURO. Price showing clear signs of bearish orderflow and structure with and signatures (accumulation manipulation and distribution).
Looking to target previous day and Asia session low!
LETS GET IT! and safe trading everyone.
