EU Long IdeaWe are looking at the final stage of accumulation and waiting for FED rate to trigger it. All short sellers have been absorbed and longs are clearly taking place now.
Fairvaluegap

BTCUSD – 30m Precision Entry from FVG & Fib Discount Zone🚀 BTCUSD BUY SETUP | May 8, 2025 | Smart Money Precision Execution
This 30-minute chart screams Smart Money accumulation with a golden entry aligned at the 70.5–78.6% Fib levels AND a bullish Fair Value Gap (FVG) just below.
Here’s the confluence breakdown you need to study:
🔍 KEY CONFLUENCES:
🟣 Fair Value Gap (FVG) between $97,800 and $98,550 – prime liquidity zone
📉 Deep Discount Entry at 70.5%–78.6% Fib retracement ($97,797 – $97,200)
🔁 Breaker Block + Internal BOS confirming upside intent
📈 Target: -27% Extension Zone around $100,920
✅ RR: 1:4+ with tight risk below swing low
🧠 Execution Strategy:
Enter near $97,797 – inside the FVG
SL: Below 100% Fib (~$96,800)
TP: -27% Fib (~$100,920) or scale partials at 0% / -10%
Break-even management once price closes above $99,500
📊 Setup Summary:
Timeframe: 30m
Bias: Bullish
Entry: FVG + Deep Discount
TP: -27% extension
SL: Below 100% Fib
RR: 1:4
Structure: Smart Money Reversal
💡 Chart Ninja Insight:
“Smart money enters where retail panic sells. The FVG is the highway—they’re just waiting to get on.”

GBPUSD – 30m Buy Setup | FVG Entry + ChoCh + -27% Fib Target💷 GBPUSD Long Setup | May 8, 2025 | 30m Smart Money Model
This 30-minute GBPUSD chart shows a perfect Smart Money shift backed by a clean Change of Character (ChoCh), a deep pullback into a Fair Value Gap (FVG), and confirmation via breaker block reentry.
Let’s break it down:
🔍 KEY CONFLUENCES:
🟪 FVG between 1.32909 – 1.33112
🔄 ChoCh confirms structural shift from bearish to bullish
📉 Entry inside 50–79% Fib retracement (Discount Zone)
🧱 Breaker Block confluence with internal BOS
🎯 Target: -27% Fib extension = 1.33737
🛡️ Stop below 100% Fib ~1.32400
📈 Setup Specs:
Timeframe: 30min
Bias: Long
Entry Zone: 1.33090 – 1.33110
TP: 1.33737 (Fib -27%)
SL: ~1.32400
RR: Approx. 1:3.5+
💡 Why It Matters:
Smart Money often accumulates positions in hidden imbalances like this FVG zone. Retail traders get shaken out on the pullback — meanwhile institutions reload just below previous liquidity sweeps. The ChoCh confirms the shift, and boom — the liquidity vacuum fuels a launch to premium levels.
🎯 Chart Ninja Tip:
“ChoCh isn’t just a signal… it’s a signature. It tells you Smart Money is changing sides.”

Bitcoin - Bulls vs Bears: 88k or 100k?Bitcoin has broken through the 4H imbalance zone that also acted as an old resistance area. The break came through a clear displacement candle, which showed strong intent from the market. That same move left behind a new gap just under the previous resistance. Although price already retested that area once, it didn’t fully fill the gap, so we could see one more retest to complete the 50% line before the market chooses direction.
Consolidation Structure
The range before the breakout was clean, with multiple rejections from the resistance zone. That zone was front-run several times, then finally broken with conviction. Now, price is hovering just under that broken level, and the new gap created by the displacement candle is still fresh and technically unfilled.
Below current price, there’s a large inefficiency sitting between 88.2k and 90k. This zone stands out because it’s not only a clean 4H imbalance, but it also aligns with the golden pocket retracement from the last major leg up. That type of confluence usually attracts liquidity, especially if price gets rejected from the gap above and starts moving lower.
Bullish/Bearish Scenarios
The bullish scenario would play out if price manages to reclaim the gap zone, pushes back above the resistance cleanly, and treats the gap as support. That would be a classic structure flip, where the previous resistance becomes a new base, and the gap gets inverted into a continuation zone. If we see that, the next upside targets would sit around the 96k to 97k area, where more liquidity is likely resting.
On the other hand, if price moves into the gap and gets rejected again, that confirms sellers are still active at that level. In that case, I’d expect the market to push down and start filling the inefficiencies below. The 88.2k to 90k area becomes the primary draw. It’s packed with confluence from the 4H imbalance and the golden pocket, and it also lines up with previous demand zones. If price reaches into that area, it could trigger a strong reaction and potentially form the next higher low.
Price Target and Expectations
If we see rejection from the current gap, the target shifts to the 88.2k to 90k zone. That’s where I’ll be watching for bullish signs, since it’s the type of level where buyers often step in. A clean reaction there could be the start of a new leg higher. But if the market doesn’t get that low, and instead pushes up through the resistance, then the bullish breakout scenario is active, and we’d be aiming higher toward the 96k range or even the 100k.
Current Stance
Right now, I’m in reactive mode. The trade will depend on what happens at the gap zone. If we get another rejection from it, I’ll look for a move into the golden pocket below. If we reclaim the gap and break resistance, I’ll be looking to enter on confirmation of the flip. No trade from the middle, only once price gives clear direction from either key level.
Conclusion
This is a clean two-scenario setup. Either price fills the remaining gap and flips resistance, triggering the bullish continuation, or we reject from that area again and drop into the 88.2k to 90k range for a deeper liquidity grab. Both are valid, and both offer high-probability trades once price confirms the path.
___________________________________
Thanks for your support!
If you found this idea helpful or learned something new, drop a like 👍 and leave a comment, I’d love to hear your thoughts! 🚀
Make sure to follow me for more price action insights, free indicators, and trading strategies. Let’s grow and trade smarter together! 📈

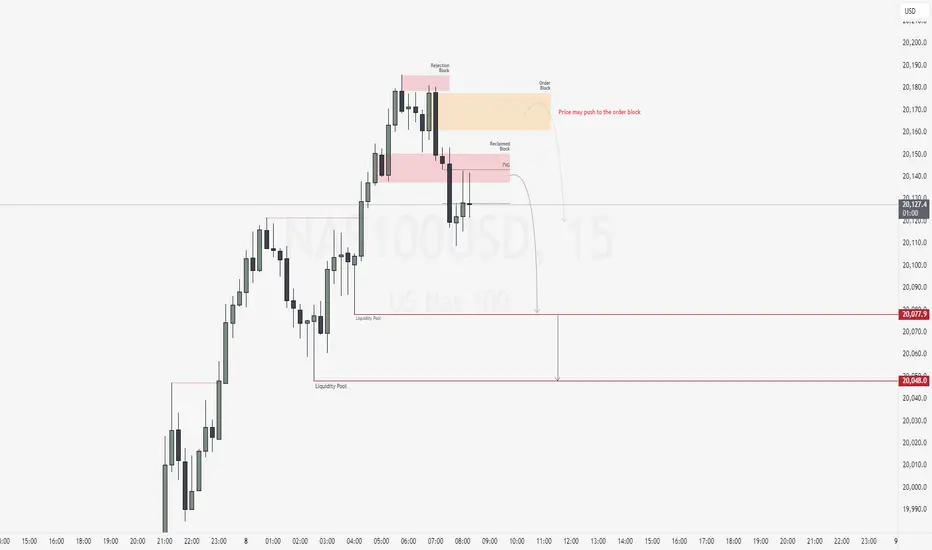
NAS100USD: Bearish Confluence Builds as Market WeakensGreetings Traders,
Despite the broader bullish context on NAS100USD, current confluences suggest a potential short-term move to the downside. As we enter the New York session—with a key news release on the horizon—we anticipate heightened volatility. The critical question now becomes: where is price most likely to draw?
Key Observations:
1. Shift in Market Structure:
Price failed to break above the previous high and instead formed a lower high, signaling weakness and suggesting a possible reversal. This lower high, marked by multiple rejection wicks, forms what we identify as a rejection block—a zone often used by institutions to initiate sell orders.
2. Displacement and Bearish Arrays:
Following this rejection, the market displayed strong displacement to the downside, confirming a market structure shift. This supports the likelihood of bearish continuation and increases the validity of bearish institutional arrays holding as resistance.
3. Current Zone of Interest:
Price is now trading within a fair value gap (FVG) aligned with a reclaimed order block—a strong confluence area for potential bearish continuation. Just above this zone lies a bearish order block and another FVG, which may act as a secondary resistance should price wick higher before moving down.
Trading Plan:
Wait for confirmation at the current resistance zones before considering entries. If validated, look to target the liquidity pools resting at lower, discount price levels.
Stay patient, trade with precision, and let the market confirm your idea.
Kind Regards,
The Architect
FINALLY SOME SENTIMENT AFTER FED FUND RATES!! BULLISH DXY BABY!Want to see the dollar trade higher and all foreign currency Pairs to trade lower. After new release price is really starting to show us its hand making it easier for us to look for a bias.

Bitcoin - Is It Possible to Test the ATH Once More?The weekly structure on Bitcoin remains firmly bullish. After consolidating below major resistance through much of 2024, price finally broke out decisively in November 2024, triggering a clean impulsive move that led to a new all-time high in January 2025. That breakout was significant, not just a short-term spike but a structural shift that confirmed long-term bullish momentum.
Since then, Bitcoin pulled back in a controlled and clean fashion, retesting the same zone that initiated the breakout. This type of price action, revisiting the origin of displacement and holding above it, is classic trending behavior and shows that the market still respects the bullish order flow.
Consolidation Structure
The zone that once acted as resistance has now flipped into support. Price dipped into the weekly candles that caused the breakout and closed above them, showing that buyers are still in control. That area also aligned with a fair value gap, giving additional confluence. The reaction out of this zone was strong, confirming it as a valid demand level.
Since that retest, we’ve seen another leg up, and now a new weekly fair value gap has formed just beneath the current price. I’m watching that imbalance as a potential short-term pullback area, and ideally, I want to see price fill it to around the 50 percent level before continuing higher.
Bullish/Bearish Scenarios
The bullish scenario remains valid as long as Bitcoin continues to hold above the previous breakout zone. I’m expecting a pullback into the newly formed fair value gap, ideally down toward $89,000, which marks the 50 percent line of the imbalance. If price taps that level and begins to bounce, that would be a potential signal for continuation toward the highs.
The bearish scenario only comes into play if price breaks back below the original breakout zone, invalidating the structure and showing weakness across the weekly levels. As long as we stay above that structure, there’s no reason to fade the trend.
Price Target and Expectations
Main expectation is a healthy pullback into the $89,000 zone to partially fill the new weekly imbalance. From there, I’ll be watching for signs of strength such as bullish engulfing candles or strong closes above the midrange of the gap. If buyers show up there, the logical next step is another attempt at the all-time high.
The ATH remains the key target for this leg, and that’s where I’ll be looking to take partial profits or reduce risk depending on how price behaves near that zone.
Current Stance
Still leaning bullish. Structure is clean, key levels are being respected, and the market has shown a clear tendency to react from weekly imbalances. I’m not chasing price into highs, but I am interested in the 89K region as a potential re-entry zone. If price gives a clean reaction there, I’ll be looking to scale in or add to existing positions.
NEWS TOMORROW
Keep in mind that FOMC is scheduled for tomorrow, which could bring a wave of volatility across all risk assets. That might trigger wicks or erratic price action even if the higher timeframe trend remains intact. Manage risk accordingly, don’t overreact to the first move, and stay focused on the weekly structure. As long as the market respects it, this still looks like a setup that wants to reach for the ATH once more.
Conclusion
Bitcoin broke out in November 2024, reached a new ATH in January 2025, and has since pulled back to retest the zone that caused the breakout. That retest held perfectly and has now led to another move higher. With a new weekly gap in play, I’m watching for a 50 percent fill around 89K before the market potentially gears up for another attempt at the highs.
___________________________________
Thanks for your support!
If you found this idea helpful or learned something new, drop a like 👍 and leave a comment, I’d love to hear your thoughts! 🚀
Make sure to follow me for more price action insights, free indicators, and trading strategies. Let’s grow and trade smarter together! 📈

XAUUSD – 30m Precision Buy from 79% Fib + Liquidity Grab📈 GOLD LONG CONTINUATION – May 7, 2025 | Smart Money Masterclass
Here’s a 🔥 textbook entry on XAUUSD, showing exactly how Smart Money engineered liquidity, tapped into the Fair Value Gap, and launched the price from deep Fib levels.
Let’s break this down like a true Chart Ninja:
🔍 KEY CONFLUENCES IN THIS SETUP:
🧠 FVG Respect: Perfect reaction from the imbalance zone (gray box)
💰 Liquidity Sweep: Triple low fake-out → "Buy-side Engineered Liquidity" ($ symbols)
📉 Descending Trendline Break: Acting as a final bear trap
🧲 Fib Retracement: Entry from deep golden pocket zone (between 70.5% and 79%)
📊 50% EQ Magnet Above: Price reacting towards premium inefficiency
🚀 Risk-Reward Setup: ~1:6 RR targeting imbalance fill around $3435
🏗️ Structure: Price built a base with multiple accumulation candles before break
📈 Trade Details:
🟢 Entry Zone: $3,388 – $3,393 (limit filled within FVG + Fib zone)
❌ SL: Just below 79% zone at $3,386
✅ TP: $3,435 (0% Fib level / top of the range + inefficiency)
📈 RRR: ~1:6 sniper level precision
⚙️ Execution Strategy:
Confirmation entry after inducement wick
FVG + Fib overlap = High probability zone
Optional scaling in across zone: 70.5%, 75%, 79%
First partials around $3,412, full TP at $3,435 zone
💬 Chart Ninja Quote of the Day:
"The best trades don’t chase price—they wait for price to chase them."
🔒 SETUP SUMMARY:
Timeframe: 30m
Bias: Bullish
Entry Type: Limit
Confluences: FVG + Fib + Liquidity Sweep
Trade Type: Reversal from Demand
Confirmation: Structure shift + Clean W bottom
💾 Save this setup and study it frame-by-frame.
📲 Share it with your trading crew who still think breakouts are reliable 😉

XAUUSD – 30m Buy Setup | Fair Value Gap + Fib + Liquidity Sweep📈 GOLD LONG – May 6, 2025 | Smart Money Trade Setup
We're seeing an incredibly clean bullish setup form on Gold (XAUUSD) with textbook Smart Money Confluences:
🔍 KEY CONFLUENCES:
🟥 FVG (Fair Value Gap): Price tapped the FVG perfectly and respected it
📐 Fib Zone: Confluence of 70.5–79% retracement with demand reaction
💧 Liquidity Grab: Below short-term equal lows before bullish push
📉 Divergence: Internal lower highs vs external equal lows = engineered setup
🧱 Structure: Short-term bullish BOS (Break of Structure) above recent swing
📊 Trade Plan (Long Setup):
🎯 Entry: ~$3,325.6 (FVG zone base)
⛑️ SL: Below FVG at ~$3,323
🚀 TP: $3,404 zone (clean inefficiency magnet)
💥 RRR: 1:5+ sniper trade
🧠 Execution Notes:
Wait for LTF bullish structure shift confirmation (5m BOS)
Add confluence with volume divergence or SMT (Smart Money Toolkits)
Manage the trade once it reaches 3,350 zone
Break-even and partials at mid-Fib zone (around 3,352–3,360)
💬 Chart Ninja Wisdom:
"Price doesn’t lie—liquidity does. When price leaves a gap, Smart Money’s coming back for it."
📌 SETUP OVERVIEW:
Timeframe: 30m
Entry Type: Limit (FVG tap zone)
Bias: Bullish
Target: Clean inefficiency above
Type: High-probability setup with strong RR and structure support
💥 Tap 💾 to save this sniper setup.
📣 Tag your gold-trading crew & get ready for that pump!
📆 Watch how this plays out live—discipline > hype.

NAS100USD: Bearish Setup Builds as Price Retests Key Supply ZoneGreetings Traders,
In today’s analysis on NAS100USD, we continue to observe bearish institutional order flow, and as such, our objective is to align our trading opportunities with this directional bias.
Key Observations:
1. Bearish Break of Structure and Retracement:
Following a clear bearish break of structure, price has retraced into a mitigation block. This zone represents an area where institutional buying previously occurred. As price trades back into it, institutions often mitigate those earlier positions and reintroduce sell-side interest—offering us an opportunity to follow their lead.
2. Confluence at the Mitigation Block:
The mitigation block is further reinforced by the presence of a bearish order block, adding strength to the resistance zone. This alignment suggests the area may serve as a high-probability reversal point for bearish continuation.
Liquidity Sweep Scenario:
There remains a possibility that price may take out nearby buy-side liquidity (buy stops) before continuing downward. If this occurs, we will wait for confirmation before entering short positions, maintaining alignment with the overall bearish narrative.
Trading Plan:
Upon confirmation of rejection at the mitigation zone, we will seek to engage in short setups targeting liquidity pools in discount pricing zones.
Remain patient, disciplined, and ensure each trade aligns with your strategy.
Kind Regards,
The Architect

US100 – Bullish Continuation Setting Up Inside the ChannelUS100 remains firmly bullish, showing consistent strength after breaking out from the prior consolidation range in mid-April. Price action has been moving cleanly within a well-defined ascending channel, supported by strong impulsive moves followed by shallow retracements. Each pullback so far has been relatively controlled, and buyers have been stepping in aggressively from clearly defined zones, which aligns with the current risk-on sentiment across tech-heavy indices.
Consolidation Structure
We’ve now had two solid retests of prior fair value gaps (FVGs), both of which acted as demand zones and helped fuel continuation. The first pullback dropped into a previously formed imbalance, consolidated briefly, and then launched a strong bullish leg. The second did the same, creating a layered structure of bullish continuation through efficient retracements. Each of these reactions confirms that price is respecting areas where institutional orders may have been left behind, which adds confluence to the trend’s strength.
Currently, price is working on forming a third FVG within the upper half of the channel. This is developing just below recent highs and has not yet been retested, which makes it a key area of interest. If the market pulls back into that imbalance with proper structure, it could offer the next high-probability opportunity to join the trend.
Bullish Scenario
If price retraces into this newly forming FVG and holds, especially with a wick or lower timeframe rejection candle inside the zone, it could mark the start of the next impulse. The overall trend remains intact as long as we stay within the channel and each FVG continues to serve as valid support. Given the strength of the previous bounces and the orderly nature of this structure, any retest into this new FVG would likely lead to another push into fresh highs and a move toward the upper boundary of the channel.
Bearish Scenario
On the flip side, if price fails to respect this new FVG and breaks below with momentum, especially if the channel support fails at the same time, it would be a sign that buyers are losing control. In that case, we’d want to see how price interacts with the last confirmed FVG below before making any bearish assumptions. A deeper pullback into that area could still provide another long opportunity if structure holds, but any sharp momentum break through both imbalances would put the bullish trend on pause and shift focus to downside levels.
Price Target and Expectations
Assuming the bullish structure continues to play out, the next projected move would be a clean rally toward the top of the channel. There’s enough space left between current levels and the upper trendline to justify an entry on the next pullback, provided it lands inside the newly created FVG. The setup is fairly straightforward, let price come back into the imbalance, confirm with lower timeframe strength, and ride the continuation leg.
Current Stance
There’s no need to chase price here. The best scenario is waiting for a patient retest of the fresh FVG forming now. If it pulls back cleanly, holds the zone, and gives confirmation, that would be the entry. Momentum, structure, and market context are all aligned for continuation, but the trade needs to be built off a level that shows actual commitment from buyers.
Conclusion
US100 is holding its bullish structure well, forming clean legs within an ascending channel, and repeatedly respecting fair value gaps as demand zones. With a new imbalance forming beneath the most recent high, the setup is shaping up for another continuation play if price rotates back and holds. It’s a wait-and-see moment for now, but if the FVG gets tagged and buyers show up, this could be the next leg higher in an already strong trend.
___________________________________
Thanks for your support!
If you found this idea helpful or learned something new, drop a like 👍 and leave a comment, I’d love to hear your thoughts! 🚀
Make sure to follow me for more price action insights, free indicators, and trading strategies. Let’s grow and trade smarter together! 📈

"BTCUSD | FVG + Order Block Alignment | High Probability Play"⚡ BTCUSD Analysis - 1H Timeframe | April 28, 2025
📊 Price Action Breakdown:
BTC printed a textbook liquidity sweep earlier today, tapping into the Discount Zone perfectly.
Now, the market is pushing up into a high-probability reaction zone where Fair Value Gap overlaps with an Order Block.
🔥 Confluences:
Fair Value Gap (FVG) = Imbalance zone needing filling.
Order Block = Institutional demand/supply where Smart Money left a footprint.
Fibonacci 79% retracement = Sweet retracement level for low-risk entries.
🧠 Why It's Exciting:
The more confluences, the more Smart Money interest.
Price is currently kissing the edge of the FVG, teasing a deeper tap into the OB. This overlap stacks probability heavily for a reaction — either a quick scalp rejection or a full-on move downward.
🎯 Potential Play:
Entry: Inside the FVG or deep into the Order Block for premium entries.
Stop Loss: Just above the Strong High (~94,629) to avoid wicks.
Targets:
Partial at 50% retracement for safer players 🛡️
Full send toward Weak Low zone (~92,839) for maximum RRR hunters 🏹
💬 Pro Tip:
"Always let price show its hand first. Don’t assume, confirm."
🚀 Summary:
✅ Liquidity swept
✅ FVG + OB stacked
✅ 79% Fib lining up
✅ Smart Money trap possibly setting
🧘♂️ Play it with patience. The sniper eats last... but he eats the most.
✍️ Save this chart, tag your trading buddy, and prepare to strike when the premium entry triggers!
➡️ Comment "SETUP LOADING" if you’re stalking this with me!
➡️ Share this with someone who’s tired of guessing entries.

"EURJPY Rejecting Premium FVG | Smart Money Trap in Play!"EURJPY Analysis 🧠 | 15M Timeframe
Price has tapped into the Premium Area, reacting off a high-probability Fair Value Gap (FVG) and Order Block confluence.
Signs of rejection are starting to show, but momentum wasn't strong enough to push lower before hitting breakeven.
Key Observations:
Price aggressively tapped the Premium zone (around 79% retracement).
Reaction from the embedded Fair Value Gap inside the premium zone.
Possible minor liquidity sweep above recent highs (Strong High marked).
Discounted zone below remains wide open as a potential future target.
🧠 Smart Money Concept Insight:
Big players often drive price into a Premium Area, triggering breakout trades and trapping liquidity.
After the liquidity is harvested, price tends to rebalance into the Discount Area.
Today, price showed initial bearish reaction but lacked immediate continuation strength — resulting in breakeven protection hit.
Current Trading Plan:
Continue monitoring EURJPY for renewed bearish order flow signs.
TP1 (if re-entry occurs): Mid Discount Area
TP2: Weak Low liquidity sweep below
SL (for any re-entries): Above Strong High
Remember:
📚 Premium = Look for Sell Opportunities
📚 Discount = Look for Buy Opportunities
Stay patient, protect your capital, and wait for price to confirm the next move.
📉 Focus on Smart Money footprints, not emotions.

"USDJPY Crashing from Premium FVG | Liquidity Grab Confirmed!"USDJPY Analysis 🧠 | 15M Timeframe
Price tapped deep into the Premium Area, perfectly aligning with a high-probability Fair Value Gap (FVG) and Order Block confluence.
We witnessed a strong bearish reaction — classic Smart Money move in action.
Key Observations:
Price surged aggressively into the Premium Zone (~79% retracement area).
Immediate bearish reaction from the red Fair Value Gap zone.
Liquidity sweep confirmed above the previous Strong High.
Discount Area below remains unfilled, offering juicy targets.
🧠 Smart Money Concept Insight:
Institutions love to bait breakout traders by pumping into Premium Zones.
After collecting stop orders and liquidity above highs, they aggressively reverse, aiming to rebalance into the Discount Area.
USDJPY delivered a textbook liquidity grab before the sharp drop!
Current Trading Plan:
Bearish bias remains intact after the strong reaction.
TP1: Mid Discount Area
TP2: Weak Low liquidity sweep zone
SL (for any new shorts): Above the Strong High
Remember:
📚 Premium = Look for Sell Opportunities
📚 Discount = Look for Buy Opportunities
Stay laser-focused on Smart Money footprints, not noise.
📉 Emotions out, execution sharp!

"USDJPY | Smart Money Premium Trap | Mitigation Block Rejection"⚡ USDJPY Analysis – 30M Timeframe | April 30, 2025
📊 Price Action Summary:
USDJPY has aggressively tapped into the Premium Zone, aligning perfectly with a Mitigation Block and Fibonacci 61.8% golden pocket.
We’re seeing early signs of Smart Money rejection — time to stay sharp! 🧐
🔥 Key Moves:
Premium Zone Entry: Price retraced right into the 61.8–70.5% fib region.
Mitigation Block respected: A known Smart Money zone where trapped sellers from previous moves get wrecked.
Liquidity Build-Up Below: Eyes on the unprotected lows — Smart Money LOVES to grab those.
🧠 What’s Really Going On Behind the Scenes:
Retail traders: "It’s bouncing! Let’s go long!" 🟢💸
Smart Money: "Perfect… let’s trap them for liquidity." 🧊📉
This move screams classic Premium Trap — draw them in, then nuke it. ☠️
🧩 Why This Setup Matters:
Mitigation Block + FVG combo = High-probability rejection zone
Sellers are likely reloading positions here
The Strong High has been established — room to target Weak Lows below
🎯 Trade Setup Idea:
Entry: Inside or just below the Mitigation Block (confirmation from bearish rejection)
Stop Loss: Just above the Strong High (~142.813)
Take Profit Zones:
TP1: Mid-discount (~141.400)
TP2: Weak Low (~139.899) — the real liquidity target 🎯
💬 Pro Tip:
"Mitigation blocks are the sniper’s nest for Smart Money. Get in, get out, get paid." 🎯
Watch the reaction closely inside the purple zone. It’s not just a block — it’s a liquidity recycling station.
🚀 Summary:
✅ Price entered Premium
✅ Mitigation Block tested
✅ Liquidity below waiting
✅ High RRR bearish setup aligning
🧘♂️ Be patient. Wait for confirmation. Let Smart Money leave the trail — then follow.
✍️ Save this chart and study how Mitigation Blocks get respected over and over. It’s not magic — it’s mechanics.
➡️ Comment "SNEAKY SHORT" if you're watching the block trap unfold!
➡️ Tag a trader who still doesn’t believe in Premium/Discount theory. 😂📉📈

Bitcoin - Repeating History: 100k Next Target?Bitcoin is continuing to move with clean structure, driven by demand imbalances and breakout continuation setups. After the initial breakout from the mid-April range, price moved in a highly technical fashion, consolidating, breaking out, forming a fair value gap, and then retesting it before continuation. That exact structure looks like it's playing out again. Bitcoin just broke out of another multi-day consolidation and left behind a fresh 4h imbalance, suggesting the potential for another leg higher if it respects that zone on a pullback.
Consolidation Structure
The prior breakout came from a tight range just below $86,000. BTC spent several days compressing in that area, then broke out impulsively, creating a 4h FVG and retesting it cleanly. That retest held perfectly and launched a rally of nearly $10,000.
The current setup is structurally the same. BTC spent 8 days consolidating under $95,000, repeatedly testing the resistance without breaking it. It finally closed decisively above, leaving behind another fair value gap. The sequence is familiar, sideways accumulation, breakout, FVG left behind, and now a setup for retest.
Bullish/Bearish Scenarios
The bullish scenario is centered on a retest of the new 4h FVG, located between roughly $94,200 and $95,000. If price pulls back into that imbalance and buyers defend it, the setup for continuation is clean. Based on recent behavior, a successful retest here could easily carry BTC toward the $100,000 level.
If price instead breaks back below $94,000 and falls into the previous consolidation range, that invalidates the breakout structure. In that case, Bitcoin could either enter another range-bound phase or trap longs with a deviation. That would shift the focus to reassessing structure instead of chasing continuation.
Price Target and Expectations
The short-term upside target is $100,000. That level is both a psychological milestone and a likely liquidity magnet. From a structural perspective, it aligns with the last breakout leg, which moved over $9,000 after a similar retest setup. If buyers defend the FVG, there is not much in the way until $100,000.
The momentum behind the breakout supports that expectation. The move was impulsive, clear, and not showing signs of exhaustion. As long as structure holds, price is in a strong position to continue toward that key round number level.
Current Stance
This setup is not a breakout chase, it’s a retest setup. The breakout already happened, and the market left behind a fair value gap that now needs to be tested. If price pulls into the $94K to $95K zone and reacts strongly, that would confirm demand. That’s the moment to step in, with invalidation placed below the FVG and former resistance.
Until then, it's about staying patient and letting price come to the key level. The structure is clear, the plan is defined, and there’s no need to force a trade in the middle of the range.
Conclusion
Bitcoin looks like it’s repeating the exact same structure we saw earlier this month. Range, breakout, FVG, retest, that sequence played out before and led to a major leg higher. It’s playing out again now with nearly identical timing and behavior.
If the 4h imbalance holds, the next phase of this rally likely targets $100,000. The structure is clean, the behavior is technical, and there’s no reason to overcomplicate it. Let price do its thing, wait for the retest, and if the reaction is strong, follow the same playbook that’s already worked once this month.
___________________________________
Thanks for your support!
If you found this idea helpful or learned something new, drop a like 👍 and leave a comment, I’d love to hear your thoughts! 🚀
Make sure to follow me for more price action insights, free indicators, and trading strategies. Let’s grow and trade smarter together! 📈

Bitcoin - Gearing Up for a Break Above Key ResistanceBitcoin has been grinding just below a key resistance zone, marked clearly around the 95,400–95,800 region. This area has seen multiple rejections in the past, making it a strong level where sellers are actively defending. Despite this, the broader trend structure remains intact to the upside, with price respecting a higher-timeframe ascending trendline and forming higher lows.
Consolidation Structure
Current price action shows a range developing just under resistance, with signs of weakening bullish momentum in the short term. We’ve had multiple wicks into the highs, but no convincing close above. On the flip side, there’s a visible support zone around 93,000–93,800, which has previously been used to absorb liquidity and fuel moves higher. This zone is confluenced by the ascending trendline from previous swing lows, offering a clear area for a liquidity sweep.
Bullish/Bearish Scenarios
In the short term, a pullback into the green support block looks likely. This would serve two purposes: sweep out late longs and provide fresh liquidity for a stronger bullish push. A dip into this level that still respects the trendline would maintain bullish structure despite violating the local higher low.
If price holds this zone and begins forming higher lows again, we could see an impulsive move into and possibly through the resistance. A clean break and close above 95,800 would likely open the door for much higher prices, as the level has capped upside multiple times and a breakout would likely trigger stop orders and breakout buying.
Failure to hold the green zone and the trendline, however, would break the short-term bullish structure and increase the probability of a deeper retracement, possibly invalidating the breakout thesis temporarily.
Price Target and Expectations
If the resistance breaks, the path toward 105,000 remains in play. That target aligns with the macro breakout structure and continuation from the trendline, supported by higher timeframe bullish sentiment.
What do do now
Watching for a pullback into 93,000–93,800 to see if liquidity is swept and support holds. No interest in chasing price into resistance. The key is to see how price reacts at the next low and then again at 95,800. If the pullback unfolds and buyers step in with momentum, that would provide the cleanest long opportunity into new highs.
Conclusion
The market looks poised for a short-term dip to rebalance liquidity before mounting a serious attempt to break a long-standing resistance zone. As long as the trendline is respected, the bullish structure is intact, and any sweep of local lows may offer a strong risk-reward entry for continuation toward 105k.
___________________________________
Thanks for your support!
If you found this idea helpful or learned something new, drop a like 👍 and leave a comment, I’d love to hear your thoughts! 🚀
Make sure to follow me for more price action insights, free indicators, and trading strategies. Let’s grow and trade smarter together! 📈

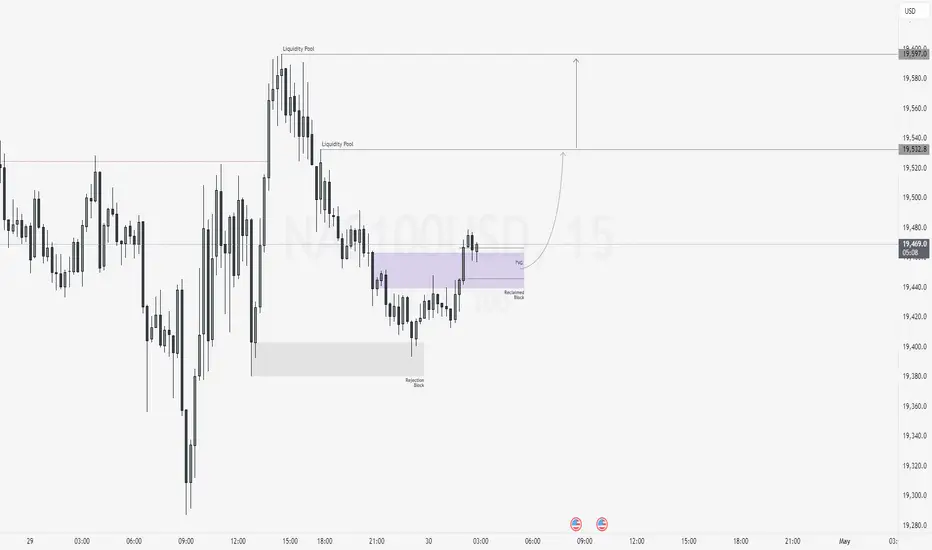
NAS100USD: Bullish Continuation from Reclaimed SupportGreetings Traders,
In today’s analysis on NAS100USD, we identify ongoing bullish institutional order flow, and as such, we aim to align our trading opportunities with this upward bias.
Key Observations:
1. Retracement and Institutional Support:
Recent price action shows a healthy retracement, with price finding institutional support at the rejection block. This was followed by strong displacement to the upside, resulting in a bullish market structure shift. This suggests the retracement may be complete, with further bullish continuation likely.
2. Reclaimed Order Block as Key Support Zone:
Currently, price is approaching a reclaimed order block—a zone where institutions previously initiated buying before price traded higher. When price returns to this area, institutions often reclaim the zone to initiate new long positions. This reclaimed block is further strengthened by the alignment with a fair value gap (FVG), enhancing the zone’s validity as institutional support.
Trading Plan:
We will monitor this reclaimed FVG zone for confirmation of bullish intent. Upon confirmation, we will look to enter long positions targeting liquidity pools in premium pricing zones, where buy-side liquidity is likely to reside.
Stay disciplined, wait for confirmation, and ensure the idea aligns with your broader strategy.
Kind Regards,
The Architect
"EURUSD | FVG + Discount Zone Confluence | Long Setup Brewing"⚡ EURUSD Analysis – 1H Timeframe | April 30, 2025
📊 Price Action Recap:
After a sharp decline, EURUSD has stabilized in a classic accumulation range, and now it’s dipping into a juicy confluence zone that screams Smart Money re-entry.
🎯 Key Zones Identified:
Fair Value Gap (FVG)
Price is currently balancing a recent inefficiency — Smart Money loves to reload here.
Discount Zone 50–100%
We’re deep in the BUY SIDE real estate. Institutions shop here. Do you?
Strong Demand Candles have printed around this zone — with wicks showing absorption of sell pressure.
🧠 Smart Money Logic:
Retail: "It’s breaking support… SHORT!"
Smart Money: "Perfect discount — let’s BUY what they’re selling." 💸📈
This is how liquidity gets transferred — one trapped seller at a time.
🧩 High-Probability Entry Checklist:
✅ Price inside Discount
✅ FVG touched
✅ Accumulation range forming
✅ Bearish momentum slowing down
✅ Entries aligning with Fibonacci golden pocket
🚀 Trade Idea Setup:
Entry: Inside Discount Zone (1.13980 to 1.13750)
SL: Just below 1.13750 (the low of the block)
TP Zones:
TP1: 1.14400 (Recent High)
TP2: 1.15000+ (Premium Area near -161.8%)
TP3: 1.15740 (Final Exhaustion Point at -400%)
📚 Smart Money Quote:
“You don’t buy at value, you buy at imbalance — where retail hesitates, Smart Money executes.” 🔥
📌 Final Take:
This is not a guessing game. It’s a blueprint.
EURUSD is setting up a possible Low-Risk, High RRR long — IF we follow structure, not emotion.
Wait for bullish reaction from the FVG zone and trail up using internal structure shifts. 📈
📸 Save this chart — this is how sniper setups are built.
💬 Comment "BUY THE DIP" if you’re watching this zone too.
📲 Tag your trading buddy who always hesitates at entries. 😂

Bitcoin - Major Daily Imbalance and Possible Move to $105k?Bitcoin already broke out of the bearish structure a while back, and honestly, that was the first major shift everyone should have been paying attention to. Ever since that breakout, we have been building bullish structure on the higher timeframes, higher highs, higher lows, and overall strong momentum to the upside. This gave the bulls a clear advantage, and so far, nothing has really changed that bigger picture.
Consolidation Structure
Now, looking at the current price action, something important stands out. During the last big push up, Bitcoin left behind a massive daily imbalance zone. It is way too big to just leave open like that. Markets hate inefficiencies, especially ones of that size, and more often than not, these kinds of imbalance zones get filled at some point.
Because of that, I am fully expecting price to come down, revisit this imbalance area, and fill it properly before making any serious move higher. It is a natural thing for the market to do, clean up inefficiencies, grab liquidity, and then continue the main trend if the structure holds.
Bullish/Bearish Scenarios
The most important thing to watch here is how Bitcoin reacts once it gets into the imbalance zone. If we dip into it and then start seeing bullish reactions, I will be looking for confirmation that the bullish structure is still intact. Specifically, if we can avoid a daily candle close below the bottom of that imbalance, the bullish case remains valid.
However, if we get a full daily close below the imbalance, that would be a strong warning sign. That would tell me that the bulls lost control and we could be looking at deeper downside or a shift back into bearish conditions.
But as long as that does not happen, I am still looking for the market to respect the structure. A dip into the imbalance, hold, and then continuation higher, that is the ideal scenario.
Price Target and Expectations
If we get the reaction I am looking for after filling the imbalance, I think Bitcoin has a real shot at rallying towards $105,000. That level lines up perfectly with a strong resistance area on the chart, and it would make sense for price to reach for it if the momentum stays bullish.
Now, reaching $105,000 will not be easy. That is going to be a major test for the market. There will likely be heavy selling pressure around there. But if the trend stays strong and we keep putting in bullish structures even as we approach that resistance, it is definitely possible to break through eventually.
Current Stance
Right now, I am being patient. I am not chasing the current move higher. I am waiting for price to come back down into the imbalance zone. If we get a proper retest and hold, that is where I will be looking for my entries, targeting the move towards $105,000.
No daily close below the imbalance zone = bullish continuation plan still in play,
Daily close below = reassess everything and possibly step aside.
Conclusion
To sum it up, Bitcoin already shifted bullish a while ago with the structure break. Now it is just about cleaning up the inefficiencies it left behind during the move up. If the market does what it usually does, fill the imbalance and maintain bullish structure, then the setup towards $105,000 is very much alive.
Patience is key here. Let the market come to us. No need to force anything.
___________________________________
Thanks for your support!
If you found this idea helpful or learned something new, drop a like 👍 and leave a comment, I’d love to hear your thoughts! 🚀
Make sure to follow me for more price action insights, free indicators, and trading strategies. Let’s grow and trade smarter together! 📈

"BTC Just Triggered ChoCh! Are You Ready For The Next Big Play?"⚡ BTCUSD Analysis - 15M Timeframe | April 28, 2025
📈 What's Happening:
BTC hunted liquidity above the previous highs (notice those $$$ grabs 🔥).
A sharp sell-off followed = Clear ChoCh (Change of Character) printed.
Price is now marching back into the Fair Value Gap sitting right inside the Premium Zone.
🚨 Critical Levels Highlighted:
Strong High = Ultimate invalidation for bears if price closes above.
Fair Value Gap (FVG) = First supply area.
Order Block (OB) = Deeper, higher probability short zone.
🧠 Key Observations:
Smart Money grabbed liquidity to trap breakout buyers.
Now price retraces into the imbalance = prime sniper setup.
🎯 2-SCENARIO PLAN:
Plan A — Short Setup (Main Bias):
✅ Wait for rejection signs inside FVG or OB.
✅ Trigger short entries only after bearish structure forms (M5 or M1 timeframe).
✅ TP1 = Previous minor low. TP2 = Weak Low (~92,800 zone).
✅ SL = Above Strong High (~95,400).
Plan B — Breaker Play (Alternative):
✅ If price smashes through OB + Strong High with strength, flip bias.
✅ Look for bullish Breaker structure (retest + continuation).
✅ Target fresh liquidity zones above.
📊 Risk Management Tip:
"React to confirmation, not prediction. Let price prove itself before you jump."
🧘♂️ Summary:
✅ Liquidity swept
✅ ChoCh confirmed
✅ Premium Zone retest incoming
✅ High Risk-Reward opportunity forming
🔥 This is where patience = profits.
➡️ Mark this setup, and let's trade like Smart Money, not like retailers.
➡️ Comment "PATIENT SNIPER" if you’re waiting for the perfect trigger!

XRP - Bulls Preparing to Push Towards $2.50XRP has maintained a bullish tone after completing a significant gap fill, currently consolidating around $2.18. The previous impulsive move left behind an unmitigated imbalance below, suggesting that the market could be preparing for a controlled retracement. The overall structure remains bullish, but a corrective dip into key demand zones would align with healthy price development before the next leg higher.
Imbalance Structure and Retest Expectation
During the rally from the sub-$2.00 range, XRP formed a sharp move that created an inefficiency between approximately $2.05 and $2.12. This gap between buyers and sellers indicates that liquidity was left behind, often acting as a magnet for price.
Currently, XRP appears to be positioning itself to retest this imbalance, refilling orders and potentially gathering the momentum needed for a stronger continuation. I expect price to sweep into this zone, likely finding responsive buyers as it rebalances the inefficiency and revisits previous structural points of interest.
Reaction Zone and Bullish Confirmation
The primary area of interest lies firmly within the $2.05 to $2.12 range. A reaction from this zone, confirmed by strong bullish price action such as a higher low formation or a bullish engulfing candle, would validate the setup for further upside.
Following the retracement and bounce, the immediate objective will be a clean break above the $2.30 resistance. This level has acted as a cap on recent price action and represents a key liquidity threshold. A decisive move through this resistance would open the path toward higher targets, confirming the strength of the new impulsive phase.
Upside Target Projection
My upside target for this trade idea is located at $2.47. This level coincides with a previous high and clusters near the upper boundary of visible supply zones on the higher timeframes. Reaching this target would represent a continuation of the broader bullish structure while also completing a logical expansion leg relative to the recent price range.
Risk Management and Invalidation
The bullish bias remains valid as long as XRP holds above the lower boundary of the imbalance zone, around $2.05. A sustained breakdown below this level, particularly if accompanied by strong bearish momentum, would invalidate the idea, signaling that a deeper retracement is unfolding.
Until such invalidation occurs, the approach remains to monitor the retracement into the key demand zone and assess the strength of the subsequent reaction for potential long entries.
Conclusion
XRP is showing strong structural signs of bullish continuation but may first revisit the unfilled imbalance below. A clean reaction from this zone, followed by a break above $2.30, would likely set the stage for a rally into the $2.47 target. Patience is key in awaiting the retest and confirming bullish intent before execution.
___________________________________
Thanks for your support!
If you found this idea helpful or learned something new, drop a like 👍 and leave a comment, I’d love to hear your thoughts! 🚀
Make sure to follow me for more price action insights, free indicators, and trading strategies. Let’s grow and trade smarter together! 📈

Bitcoin - Trap the Breakouts, Ride the PullbackBitcoin has been trading in a clearly impulsive structure, showing bullish intent after reclaiming previous consolidation zones. Recently, price action has driven into a significant area of interest, approaching the highs set on the 4-hour timeframe. These highs have not yet been swept, making them a likely target for liquidity grabs. Given the market's recent strength, it's reasonable to anticipate that market makers and larger participants may aim to run these stops to fuel a deeper retracement or set the stage for further upside.
The higher timeframes continue to favor bullish structure overall, with price making higher highs and higher lows. However, within this bullish context, the market has left behind notable inefficiencies, particularly an untapped imbalance zone just below current price levels. These inefficiencies typically act as magnets, especially when preceded by strong directional moves, making them key zones of interest for potential pullbacks.
Consolidation Structure and Key Zones
After bottoming out near the $77,000 to $78,000 area in early April, Bitcoin has steadily climbed, forming intermediate accumulation structures and minor consolidations before each breakout leg. During the recent surge, price left behind a unified imbalance zone roughly between $89,000 and $91,000, which remains untouched. This area is highly relevant, as price has not yet returned to rebalance it.
Just below that sits a previous strong support zone in the $82,000 to $84,000 region, which provided a solid base for the current leg higher. An additional lower imbalance zone lies slightly above $80,000, offering a potential secondary demand area in case the primary zone fails.
Liquidity and Imbalance Zone
The current expectation is for Bitcoin to complete a sweep of the 4H swing high, tapping into the resting buy stops above. These types of moves often serve as traps for breakout buyers, allowing institutions to offload positions into demand and prepare for a retracement. Once the liquidity is taken, the next logical move would be a return toward the unfilled imbalance zone highlighted on the chart.
This zone not only represents technical inefficiency, but also aligns with the concept of fair value. Price often returns to these areas to find willing buyers, rebalance supply-demand discrepancies, and establish a base before continuing in the prevailing direction. Given the strength of the previous rally, a healthy retracement into this zone would still maintain overall bullish market structure.
Bullish Scenario
If the price sweeps the high and retraces into the $89,000 to $91,000 zone, we want to see signs of absorption and bullish structure forming within this region. Confirmation may come in the form of bullish order blocks, internal BOS (break of structure), or a clear rejection wick indicating buyers are stepping in. Should these conditions be met, this zone provides a compelling long opportunity, with upside targets set toward previous highs and potential extension levels above $96,000.
Bearish Contingency Plan
In the event that the unified imbalance fails to hold, attention shifts to the next key zones. The first is the minor imbalance closer to $85,000, which could offer a short-term bounce. Failing that, the broader support zone at $83,000 highlighted on the chart, becomes a more significant area to watch. This zone previously acted as the springboard for the current rally and may provide the structural support necessary for a larger bullish continuation.
Conclusion
This setup reflects a classic smart money concept, liquidity engineering followed by a return to inefficiency. The trade idea rests on the premise that markets rarely move in a straight line and often seek to rebalance themselves after aggressive trends. By allowing price to sweep the highs, fill the imbalance, and re-establish support, we can position ourselves with the trend in a favorable risk-reward context. The bias remains bullish, but execution depends on price reaction at key levels and confirmation of intent.
__________________________________________
Thanks for your support!
If you found this idea helpful or learned something new, drop a like 👍 and leave a comment, I’d love to hear your thoughts! 🚀
Make sure to follow me for more price action insights, free indicators, and trading strategies. Let’s grow and trade smarter together! 📈
