Bitcoin – Testing Major Resistance: 95k next target?Bitcoin is currently trading inside a significant resistance zone between $88,000 and $89,000. This area has acted as a strong supply zone in the past, evidenced by multiple rejections that led to notable sell-offs. The recent upward momentum that brought price back into this area was backed by a strong rally off the April lows, pushing through local structure and recovering critical levels. However, despite the strength of this move, price is now approaching a decision point where bulls need to prove continuation capacity or risk triggering another corrective leg.
Consolidation Structure
The current structure reflects a potential accumulation base forming below resistance, marked by a series of higher lows and a compression of volatility. This typically precedes a breakout, though it also heightens the risk of a sharp rejection should buyers fail to sustain pressure. The local trend remains bullish on the 4H timeframe, but the lack of follow-through above resistance so far suggests hesitation. Price is essentially coiling beneath a ceiling, building pressure for a breakout or breakdown move in the coming sessions.
Bullish Scenario
If Bitcoin is able to cleanly break above the $89,000 resistance level, the key confirmation will be a successful retest of this zone from above. This area, once flipped into support, would offer a strong launchpad for continuation toward the next key target at $95,000. This target aligns with the measured move projection from the recent range and also represents a psychological milestone that may attract momentum buyers. A confirmed breakout and retest would signal strength from bulls and invalidate the prior resistance structure, transitioning it into new support.
Bearish Scenario
Alternatively, if price fails to break above the resistance zone and prints another rejection, I expect a retracement to follow. The first major area of interest on the downside is the imbalance zone between approximately $84,000 and $85,500. This level also aligns with the 0.236 Fibonacci retracement, and given the inefficiency left behind from the recent rally, it serves as a logical short-term support area. A bounce here would not be surprising, particularly on the first touch. However, should price break below and close beneath this zone, it would indicate weakness and open the door for a deeper corrective move.
The next major downside target in that case would be the golden pocket between $79,500 and $80,500. This zone carries strong confluence: it’s formed by the 0.618–0.65 Fibonacci retracement, a previously unfilled price void (PVG), and the base of the recent rally. Price reaching this area would likely attract interest from both buyers looking for re-entry and shorts looking to cover. A reaction from this level could set the stage for a medium-term bounce or even a new accumulation phase.
Current Stance
At the moment, my stance is neutral-to-bullish while price remains within the resistance zone. I'm closely monitoring for a clean breakout and retest, which would trigger a long setup targeting the $95K area. Until that breakout occurs, caution is warranted due to the risk of rejection and retracement. If price breaks down from the current level, I will shift my focus to lower support zones, particularly the imbalance region and the golden pocket, for potential long opportunities or further confirmation of bearish momentum.
Conclusion
Bitcoin is at a pivotal point technically. The structure and momentum suggest the possibility of a bullish continuation, but confirmation through breakout and retest is essential. A failure to break and hold above resistance will likely initiate a retracement, with the imbalance zone serving as the first major test. If that zone fails, a trip toward the golden pocket at $80K becomes increasingly probable. This is a reactive zone-to-zone environment, and both breakout and breakdown scenarios offer actionable setups based on confirmation.
__________________________________________
Thanks for your support!
If you found this idea helpful or learned something new, drop a like 👍 and leave a comment, I’d love to hear your thoughts! 🚀
Make sure to follow me for more price action insights, free indicators, and trading strategies. Let’s grow and trade smarter together! 📈
Fairvaluegap

NAS100USD: Bearish Momentum Likely to Extend in NY SessionGreetings Traders!
At present, NAS100USD continues to reflect clear bearish institutional order flow. This is evidenced by the consistent formation of lower lows and the way bearish arrays—such as fair value gaps and order blocks—continue to hold as effective resistance zones.
Key Observations:
Sustained Bearish Structure:
The market has maintained a downward trajectory, with each rally being absorbed by bearish arrays. This behavior reinforces the dominance of institutional selling pressure.
High Volatility Window – New York Session:
With the New York session now underway, heightened volatility is expected. This presents a favorable environment for bearish continuation trades, particularly if price respects the key supply zones.
Trading Strategy:
Entry Consideration:
I am awaiting a retracement into a key bearish array—either a fair value gap or a bearish order block. Upon confirmation of rejection from these zones, I will seek to enter short positions.
Profit Targets:
The primary objective will be to target liquidity pools residing at lower discount levels. These areas represent external liquidity where institutional participants are likely to complete order execution.
By aligning with the prevailing bearish institutional narrative and waiting for high-probability confirmations within premium zones, we can strategically position ourselves to benefit from further downside momentum during this high-impact session.
Kind Regards,
The Architect

NAS100USD: Bearish Continuation After FVG RebalanceGreetings Traders!
In today’s analysis of NAS100USD, the institutional order flow remains bearish, continuing the momentum established during last week’s trading sessions. In alignment with this directional bias, we are strategically focused on identifying high-probability bearish opportunities.
KEY OBSERVATIONS:
Sustained Bearish Order Flow:
Institutional behavior continues to reflect a bearish narrative, suggesting that smart money remains committed to driving price lower.
Rebalancing a Fair Value Gap (FVG):
Price is currently rebalancing a notable fair value gap—an internal range inefficiency—providing the perfect confluence zone for bearish setups. This rebalancing typically precedes a draw on external liquidity.
Targeting External Range Liquidity:
As the market rebalances internal inefficiencies (FVGs, order blocks), it subsequently seeks external range liquidity such as sell stops, liquidity pools, and engineered lows. This is a fundamental principle of institutional price delivery.
TRADING PLAN:
Entry Consideration:
Monitor price action within the fair value gap for confirmation of bearish intent. This zone serves as an internal liquidity area, optimal for institutional order execution.
Profit Targets:
Focus on external liquidity resting below previous lows—particularly sell stops and liquidity pools. These levels represent the logical draw where institutions aim to finalize order pairing and take profit.
By following the institutional flow, we align ourselves with smart money practices, improving our precision and probability of success. Stay patient and disciplined—confirmation is key!
Its good to be back,
The_Architect

Bitcoin - Who Will Take Control: Bulls or Bears?Bitcoin is currently exhibiting a prolonged phase of sideways movement, trading within a clearly defined consolidation range. After a sharp move to the upside earlier this month, price has stalled and started to range between the resistance zone near $86,000 and support around $82,000. This type of price action typically suggests indecision in the market, where neither buyers nor sellers are in full control.
The candles within this range are relatively choppy, with many wicks on both sides, further reinforcing the idea that this is a low-conviction environment. It reflects a battle between opposing market participants, and historically, such consolidations often precede strong directional moves. Until this range is broken, price is likely to continue moving sideways with potential for false breakouts and low-probability trade setups.
The Consolidation Range
The current consolidation is outlined with clear visual zones. The upper boundary acts as resistance and is highlighted in red, while the lower boundary, acting as support, is marked in green. The range itself is filled in blue, representing the broader area of indecision and price balance.
This consolidation is not minor—it has held for several days with multiple rejections from both the resistance and support levels. The more time price spends within a range like this, the more significant the breakout is likely to be. Liquidity builds up at the highs and lows of these ranges, and eventually one side will be taken out, leading to an expansion move.
Bullish Breakout Scenario
If Bitcoin manages to break and close decisively above the resistance zone, this would signal a potential shift in market sentiment toward the upside. A breakout above this level is likely to trigger stop-loss orders from short-sellers and attract breakout traders entering long positions.
The chart suggests that if this bullish breakout occurs, price will likely target the liquidity resting above recent swing highs, which are marked by the black horizontal lines. These levels represent areas where traders may have placed their stop orders, making them attractive targets for a price sweep. Following this, Bitcoin could enter a new trend phase, potentially setting up a continuation of the larger bullish structure that preceded the consolidation.
It is important, however, to wait for confirmation. A clean breakout followed by a retest or strong follow-through volume would provide greater confidence in a bullish continuation. Entering prematurely could result in being caught in a false breakout, especially in a ranging market like this.
Bearish Breakdown Scenario
Alternatively, if price breaks below the support zone with conviction, this would be a clear bearish signal. A move below the lower boundary of the range would imply that the buyers have been exhausted and that sellers have regained control.
In this scenario, the expectation is that price will seek out the inefficiencies and untested price action below, particularly the yellow zone marked on the chart. This area likely represents a previous gap or imbalance—zones where price moved rapidly in the past and did not spend much time. Such zones often act as magnets for price once a breakdown occurs, as the market seeks to fill in that inefficiency.
This bearish move could lead to a significant drop, potentially targeting levels as low as the upper $70,000s or even lower, depending on how strong the selling pressure becomes. Much like the bullish scenario, it's critical to watch for confirmation. A candle close below support with strong volume would be an ideal trigger for this bearish thesis.
No-Trade Zone and Strategy
Until Bitcoin breaks out of this range in either direction, there are no clear high-probability trades. Entering within the range is inherently risky due to the lack of momentum and high chance of reversals. Whipsawing price action can easily trigger stop-losses and create frustration for traders trying to anticipate moves before confirmation.
The most prudent approach in this situation is patience. Let the market show its hand. Once a breakout occurs, whether to the upside or downside, the path forward becomes more defined and trade setups with favorable risk-to-reward ratios will emerge. For now, this is a textbook no-trade zone—ideal for observing and planning, not for forcing entries.
Conclusion
Bitcoin is currently at a critical juncture. The ongoing consolidation is a precursor to a larger move, and while the direction is not yet confirmed, the zones of interest are clearly mapped out. A breakout above resistance will suggest a bullish continuation, targeting liquidity above recent highs. A breakdown below support will imply a bearish move toward the inefficiencies and untested price areas below.
In markets like this, discipline is key. The goal is to avoid getting chopped up in the range and instead position yourself on the right side once momentum returns. The next breakout will likely set the tone for the coming days or even weeks—so patience now could lead to greater reward later.
__________________________________________
Thanks for your support!
If you found this idea helpful or learned something new, drop a like 👍 and leave a comment, I’d love to hear your thoughts! 🚀
Make sure to follow me for more price action insights, free indicators, and trading strategies. Let’s grow and trade smarter together! 📈

US30 Long 15 & 5 min
BLACKBULL:US30
We can see 2 relatively equal lows, which to my opinion may get swept to fill the fair value gap below, and then react to the point that we sweep the swing high
XAUUSD Long after FVG
Waiting for this FVG to get hit and sweeping the minor liquidity, then putting long. Thoughts?
OANDA:XAUUSD

EURUSD – Pullback before a new move?EURUSD has been consolidating for several sessions now after making a strong impulsive move to the upside earlier this month. Since breaking above the 1.1150 level, momentum has started to slow down and price is beginning to range near the recent highs. That alone isn’t surprising strong impulsive moves are almost always followed by periods of consolidation or retracement as the market pauses, takes profits, and reevaluates.
What catches my attention now is how weak the price action looks during this consolidation. The candles are getting smaller, wicks are getting longer, and there’s not much follow-through on the bullish side anymore. This kind of price behavior typically shows indecision or exhaustion buyers are no longer driving price with the same force and sellers are starting to creep back in.
So instead of chasing this move higher, I’m positioning myself for a pullback into a key demand zone that I think will offer a much higher probability long setup.
The Level I’m Watching – Golden Pocket with Imbalance Confluence
The zone I’m targeting for a potential entry sits in the 1.1070 to 1.1170 area. This range covers the golden pocket retracement zone, between the 61.8% and 65% Fibonacci levels measured from the recent impulse low to high, and overlaps with multiple technical factors that make it extremely attractive.
First off, this zone contains three separate unfilled imbalance areas (or fair value gaps), created by aggressive bullish candles on the way up. These are areas where price moved too quickly to fill all orders on both sides, which leaves inefficiencies in the market. The market tends to revisit these areas to rebalance before continuing in the prevailing direction. So from a pure price action perspective, the unfilled imbalances create a natural magnet for price to retrace into.
Second, we’ve got historical resistance right in this same zone. If you look back a few sessions, price rejected this level multiple times before finally breaking through. Now that we’re above it, there’s a strong chance this area flips into support. This concept resistance turning into support is a classic and reliable price action behavior, especially when it lines up with other tools like fibs and imbalances.
Trend Structure Still Intact
What’s crucial to me here is that a pullback into this zone will not break the overall bullish market structure. We’re still printing higher highs and higher lows, and a retracement into the golden pocket would simply be another higher low within the current uptrend.
There’s also a clean ascending trendline from early April that hasn’t been breached. If price respects that trendline again while dipping into this demand zone, that would add further confluence to the setup. It would mean the trendline, golden pocket, unfilled imbalances, and historical support are all lining up at the same point that’s a textbook area where I want to be a buyer.
Entry Triggers and Execution Plan
I’m not looking to blindly set a limit order in this zone. I want confirmation that buyers are stepping in and that we’re getting a shift in momentum. Ideally, I’ll drop to a lower timeframe like the 1H or even the 15M and wait for a clear change of character — something like:
A break of a local lower high
A bullish engulfing candle at the base
A sweep of liquidity below recent lows followed by a strong push back above structure
Once I see that kind of reaction, I’ll consider entering a long position. My stop will go just below the structure low or the lowest point of the zone, depending on the entry signal. I’ll give it enough room to avoid getting wicked out on a false break.
As for targets the first obvious one is the current range high around 1.1350. If we get a strong reaction, I’ll trail part of the position and look for continuation into new highs. This pullback could set the stage for the next leg of the broader bullish trend, especially if DXY starts showing weakness again.
Why I’m Not Shorting Here
Even though price looks weak and a retracement seems likely, I’m not interested in shorting this setup. We’re still firmly in bullish structure and shorting into a healthy uptrend just doesn’t make sense to me unless I’m scalping. The risk to reward just isn’t favorable on the short side right now I’d rather wait for price to come to my zone and then look for confirmation to go with the trend.
Final Thoughts
EURUSD is consolidating after a strong move up and I’m expecting a pullback. The golden pocket zone, stacked with unfilled imbalances and previous resistance, looks like the ideal place for a bullish reaction. As long as we stay above that zone, structure stays bullish and I’ll be looking for long opportunities once price confirms the bounce.
Patience is key here. I’m not rushing into anything, but if price gives me the reaction I’m looking for in that zone, I’ll be ready to execute. The setup aligns well with both technical structure and market behavior and I’ll continue to monitor price action closely over the next few sessions.
__________________________________________
Thanks for your support!
If you found this idea helpful or learned something new, drop a like 👍 and leave a comment, I’d love to hear your thoughts! 🚀
Make sure to follow me for more price action insights, free indicators, and trading strategies. Let’s grow and trade smarter together! 📈

Bitcoin - Rejection at Resistance: Watching $80K and BelowBitcoin is currently trading within a tight range between $84,000 and $85,000, a region that has acted as a strong resistance multiple times in the recent past. Bulls have tried to break through this level, but we’re starting to see some clear signs of exhaustion. Price is struggling to create a new higher high, and unless we see a clean breakout above this resistance, this could be the early signs of a lower high formation.
A failure to break out here would indicate that bullish momentum is starting to fade, and that sellers are gaining control again in this zone. This could open the door for a short-term pullback before we see any renewed upside.
Major Resistance Holding Price Down
The red zone on the chart marks a key supply area, where sellers continue to step in aggressively. Multiple rejections have formed here, which gives this level more weight. Unless Bitcoin sees a strong breakout above $85,000 with volume, this area will likely hold price down.
What we want to watch now is whether price can push through this resistance or whether it will roll over and confirm the rejection.
Short-Term Bearish Bias – Eyes on Imbalance Zone
If Bitcoin fails to break above this resistance, the most logical target on the downside becomes the $80,000 range. This level is interesting for two reasons:
It lines up with an unfilled imbalance zone on the 4H chart.
There’s also the 0.5 Fibonacci retracement level in the same area.
This imbalance acts like a magnet for price, pulling price back into it to rebalance the inefficiency in the market. If momentum shifts to the downside, this is a very likely level for price to revisit. I’ll be watching this area closely for potential bullish reactions or continuation setups depending on how price behaves once we tap into it.
Strong Support and Golden Pocket Below
If the $80K zone doesn’t hold, I’ll be turning my attention towards the next major area of interest — the $78,500 level. This is where we have two very strong factors aligning:
The 0.618 Fibonacci retracement level (also known as the golden pocket).
A key historical support zone that has held well in previous pullbacks.
This level has a lot of confluence, which increases the chances of seeing a reaction or reversal from here if we drop that far. In my opinion, this is one of the strongest zones currently sitting below us. If price gets here, I’ll be watching closely for a solid long setup.
What Comes Next?
For now, I remain cautiously bearish in the short term. Price has been rejected at resistance and hasn’t shown the strength to break out just yet. If we start forming more lower highs and lose the support structure at $84K, I think we’ll make our way back down toward $80K.
What happens at that point will be key:
Bounce from $80K? We could get a short-term relief rally and retest the resistance.
Fail to hold $80K? Then I’m expecting price to dig deeper into the golden pocket and potentially find strong support at $78.5K.
At this stage, I’m not looking for longs unless price gives a clear reaction from one of the key levels below. The risk-to-reward on shorts looks more attractive while we remain under resistance.
Summary
Resistance at $85K–$84K is still holding strong.
If rejected here, I’m targeting $80K (imbalance zone).
Below that, $78.5K is a major support with golden pocket confluence.
Short-term bias is bearish unless we break above resistance with volume.
Watching for clean setups around these levels before taking action.
__________________________________________
Thanks for your support!
If you found this idea helpful or learned something new, drop a like 👍 and leave a comment, I’d love to hear your thoughts! 🚀
Make sure to follow me for more price action insights, free indicators, and trading strategies. Let’s grow and trade smarter together! 📈

Bitcoin - Bulls Took Control: 85k Next?Bitcoin continues to show signs of strength as the previously formed double bottom structure remains valid. This pattern, commonly associated with a bullish reversal, suggests that buyers have successfully defended a key support area and are now regaining control. The second bottom reinforced the significance of this level, confirming the presence of demand and a potential shift in momentum.
Unlike the previous scenario where bearish pressure threatened to invalidate the pattern, this time the market has respected the formation. The double bottom is holding firm, and price has begun to move higher, offering further confirmation of short-term bullish intent.
Support Found Within the 4-Hour Imbalance
A critical turning point in the current price action came as Bitcoin dipped into a 4-hour imbalance zone and found strong support. This area, marked by a sharp displacement in price, often acts as a magnet for liquidity before the market continues in its intended direction. The bounce from this imbalance not only held but was followed by a decisive move above the zone.
This development is important because it confirms that buyers were waiting in this inefficiency to accumulate, and the resulting upward movement reinforces the idea that this was a high-probability support level. The break above the imbalance now positions Bitcoin to potentially pursue higher liquidity areas.
Potential Move Toward the 4-Hour Fair Value Gap
With the imbalance zone now acting as support, price appears poised to push higher into the next key area: the 4-hour fair value gap located above. This FVG has not yet been fully filled, and Bitcoin has historically shown sensitivity to this zone, rejecting multiple times from it without managing to reclaim or fill even 50% of the gap.
Given the current bullish structure and momentum, there is now a real possibility that price could seek to fill this fair value gap more substantially—potentially up to the 85,000 region. This would align with the typical behavior of price returning to inefficiencies in the market, especially when backed by a valid reversal pattern such as the double bottom.
The 85,000 area also overlaps with a previously defined resistance, so while this presents a logical target for bulls, it may also be where sellers attempt to reassert themselves. Watching price behavior as it approaches this zone will be crucial for managing risk and spotting any early signs of reversal.
Conclusion
Bitcoin is currently respecting the double bottom structure and has found renewed strength after bouncing from the 4-hour imbalance zone. With price now above this key support, the path of least resistance appears to be to the upside, targeting the fair value gap near 85,000. This zone remains unfilled and represents a likely draw for price in the short term.
Unless we see a strong rejection or sudden weakness, the current setup supports a bullish continuation scenario, with eyes on a partial or full fill of the FVG. Traders should continue to monitor the strength of this move and look for reactions near the 85,000 level to determine whether momentum will sustain or fade.
__________________________________________
Thanks for your support!
If you found this idea helpful or learned something new, drop a like 👍 and leave a comment, I’d love to hear your thoughts! 🚀
Make sure to follow me for more price action insights, free indicators, and trading strategies. Let’s grow and trade smarter together! 📈

Bitcoin – Double Bottom at Risk as Fair Value Gap Rejects PriceBitcoin recently formed a potential double bottom pattern, a classical bullish reversal formation that often signals a shift in market sentiment from bearish to bullish. This pattern is typically interpreted as a sign that the market has found a significant support level, where buying interest is strong enough to halt the prior downtrend. The structure is generally confirmed when price breaks above the neckline, leading to a continuation move to the upside.
In this case, the double bottom suggests buyers are attempting to establish control and potentially drive price higher. However, while this pattern often results in upward movement, it should not be taken in isolation. The context surrounding this pattern is critical, especially when factoring in additional technical elements currently influencing Bitcoin’s price action.
Fair Value Gap on the 1-Hour and 4-Hour Timeframes
Despite the bullish implications of the double bottom, Bitcoin is currently trading within a fair value gap (FVG) on both the 1-hour and 4-hour charts. Fair value gaps represent zones of inefficiency created when price moves too quickly in one direction, leaving behind an unbalanced area in the market. These gaps often act as magnets for price to return and rebalance before a continuation or reversal.
As of now, Bitcoin has not demonstrated strong acceptance above this fair value gap. Instead, price is consolidating or slightly pulling back within this region, signaling that the move higher might be losing momentum. If the current candle closes below this FVG zone, especially on the 4-hour timeframe, it could indicate that bulls are running out of steam. Such a development would weaken the bullish case and suggest that the earlier double bottom may be invalidated.
This would shift the narrative toward a more bearish outlook, potentially opening the door for a deeper retracement or even a new leg down. It’s crucial to watch how price behaves around the FVG, as a decisive close below it would highlight weak demand and the possible presence of distribution rather than accumulation.
Rejection from a Key Resistance Level
Adding further weight to the bearish risk is the recent strong rejection from a significant resistance level. This area has acted as resistance in the past and once again proved formidable as Bitcoin failed to break through with conviction. The rejection was sharp and occurred precisely as price entered the fair value gap, reinforcing the idea that this zone may be acting as a trap for longs rather than a springboard for further gains.
This resistance area may now serve as a local high. Unless bulls can reclaim this level with strong momentum and volume, the path of least resistance appears to be to the downside. The inability to break through this resistance while trading within a fair value gap further suggests that current market strength may be overstated.
Critical Levels to Watch
The lower boundary of the fair value gap is the most immediate level of interest. A 1-hour or 4-hour close below this area would be a clear sign of weakness.
The support zone formed by the double bottom must hold to keep the bullish thesis intact. A break below this level would fully invalidate the pattern.
On the upside, the resistance that caused the recent rejection needs to be reclaimed decisively to confirm renewed bullish strength.
Conclusion
In summary, while Bitcoin initially showed signs of bullish reversal via a double bottom formation, the surrounding market context introduces significant doubt. Price is currently stalled within a fair value gap on the 1H and 4H timeframes, and the failure to maintain strength within this zone could invalidate the double bottom entirely. Furthermore, a strong rejection from key resistance suggests that sellers are still present and actively defending higher levels.
A close below the FVG zone would signal that bulls are losing control, and downside continuation becomes more likely. Traders should remain cautious here, avoiding premature bullish entries unless there is clear evidence of strength, such as a reclaim of the FVG and a strong move above resistance. Until then, the risk of a deeper drop remains very real.
__________________________________________
Thanks for your support!
If you found this idea helpful or learned something new, drop a like 👍 and leave a comment, I’d love to hear your thoughts! 🚀
Make sure to follow me for more price action insights, free indicators, and trading strategies. Let’s grow and trade smarter together! 📈

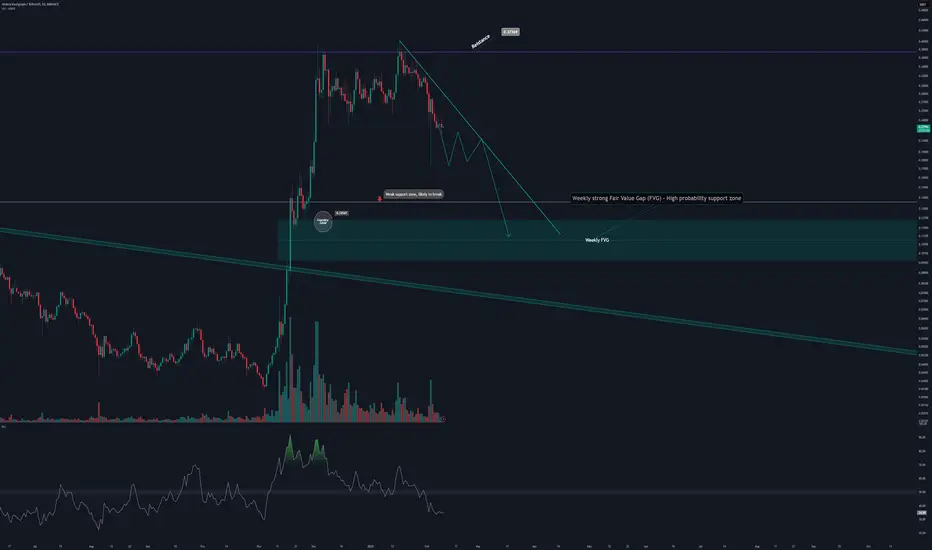
HBARUSDT Approaching Key Weekly Zone with Potential Reversal SetBINANCE:HBARUSDT HBARUSDT is approaching a weak support zone, which shows a higher probability of breaking due to insufficient strength. Below this lies a weekly strong Fair Value Gap (FVG), which is a critical level for potential price reversal and continuation of the bullish trend.
If the price enters this weekly FVG zone, it could signal a high-probability buying opportunity for traders anticipating a rebound. On the other hand, failure to hold this zone could lead to further downside.
Keep an eye on price action near the key levels for confirmation of potential entries. Always ensure to have clear stop-loss levels and realistic profit targets in place.
Best regards,
Happy trading!
Ultimate Guide to Smart Money ConceptsWhat Are Smart Money Concepts?
Introduction:
If you’ve been trading for a while, you’ve probably noticed that sometimes the market moves in ways that just don’t make sense. You’ve got your technical analysis all set, but the market seems to go in the opposite direction. That’s where Smart Money Concepts (SMC) come in.
At its core, SMC is all about understanding how big players in the market (think hedge funds, institutions, and banks) move prices. These players have massive amounts of capital and information, and they don’t trade like the average retail trader. Understanding their behavior can help you see where the market is going next before it happens.
What is Smart Money?
In the world of trading, smart money refers to the institutional investors who move markets with their huge orders. Unlike retail traders, who might be relying on indicators or patterns, smart money trades based on liquidity, market structure, and order flow.
While retail traders are typically reacting to price movements, smart money is the one causing those moves. They’re out there seeking out places where they can accumulate positions or distribute them. The tricky part is that they’ll often make the market go in one direction just to trap retail traders and get them to take positions before flipping it back to where they wanted it to go in the first place.
Key Concepts in Smart Money Trading
1. Market Structure
Market structure refers to the way price moves in a trend. It’s essentially a pattern of higher highs and higher lows for an uptrend, or lower highs and lower lows for a downtrend.
Smart money uses these patterns to their advantage. When they see the market creating a series of higher highs and higher lows, they’ll take advantage of that momentum to push prices further, knowing retail traders will follow along.
But when they want to reverse the market, they’ll push it in the opposite direction, creating a market structure shift or a break of structure, which signals that the trend is over and a new one is starting.
2. Liquidity
Liquidity refers to the amount of orders available to be filled at different price levels. Smart money knows exactly where retail traders are likely to place their stops or buy orders.
They’ll often push the price to these levels, triggering those stops and collecting the liquidity. Once that liquidity is grabbed, they’ll reverse the price and move it in the intended direction.
A common way to spot liquidity is by looking for equal highs or equal lows, where traders often place their stop-loss orders. These are often areas smart money will target.
3. Order Blocks
Order blocks are areas on the chart where institutions have placed big orders. These are key levels that represent where price might return to later, and they can act as areas of support or resistance.
Order blocks are usually found after big price moves. Institutions place these orders to either accumulate positions or offload them, and price often comes back to these levels to fill orders that were left behind.
4. Fair Value Gaps (FVG)
Fair value gaps, or imbalances, are price areas where the market moves quickly, leaving gaps between candlesticks. These gaps represent areas where the market has moved too fast for regular orders to fill, and price tends to return to these levels to fill the gaps.
Smart money knows that these imbalances are critical areas for future price action, and they’ll use them to re-enter the market after a move has been completed.
Why Does Smart Money Matter?
Understanding smart money concepts is like learning to think like an institution. Instead of chasing after price based on typical retail indicators, you start looking for the big moves that smart money is making. You begin to notice when the market is setting traps for retail traders, and how these large players accumulate positions before pushing price in a big way.
With SMC, you stop guessing and start anticipating. By looking for liquidity zones, order blocks, and market structure shifts, you can get in sync with the big players and follow their moves, not fight them.
Conclusion
Smart Money Concepts are all about shifting your perspective. Instead of thinking like a retail trader looking for quick breakouts, oversold/overbought conditions, or chasing trends — start looking at the market as the big players do. Pay attention to where the liquidity is, identify key order blocks, and use market structure shifts to guide your trades.
By learning to spot these key signs, you’ll stop being the one who’s trapped and start being the one who’s in sync with the smart money.
Ready to trade smarter? Keep an eye on those order blocks and liquidity zones — they’re where the real money is made.
Next Steps
- Start practicing by reviewing charts through the SMC lens.
- Keep refining your understanding of market structure, liquidity, and order blocks.
- Stay patient, smart money trades aren’t about quick wins, but about positioning yourself for big moves.
__________________________________________
Thanks for your support!
If you found this guide helpful or learned something new, drop a like 👍 and leave a comment, I’d love to hear your thoughts! 🚀
Make sure to follow me for more price action insights, free indicators, and trading strategies. Let’s grow and trade smarter together! 📈

EURUSD – Why This Key Level Could Decide the Next Big MoveAt the moment, EURUSD is maintaining a bearish market structure on both the 1-hour and 4-hour timeframes. Price action has been consistently forming lower highs and lower lows, which is a clear indication of sustained selling pressure in the market.
Zooming in, we’ve noticed that previous support zones are no longer being respected, which further supports the bearish narrative. These failed supports are now acting as weak resistance zones, and price is cutting through them with minimal hesitation — a sign that buyers are losing control while sellers continue to dominate the market.
One of the key technical levels on our radar is marked by a horizontal red line, currently acting as minor support. A candle close below this level would be highly significant. It would indicate that the temporary consolidation or hesitation we're seeing is breaking to the downside. If this scenario plays out, it could trigger a strong bearish continuation, with increased volume likely to enter the market from breakout traders and institutions scaling in.
The chart points to a clearly defined target area for this move, located in the 1.07500 to 1.07800 range, which is marked in green. This is a strong historical support zone — one that has previously held and sparked reversals. We anticipate that if price reaches this area, we may begin to see a slowdown in bearish momentum and a potential reversal setup.
1 hour trend
Trade Plan
Bearish Bias While Below the Red Line
If price closes below the red line (~1.09200), I’ll be watching for follow-through to the downside.
Entry opportunity may exist on the retest of this broken level, provided price shows rejection or continuation patterns.
Target area: 1.07500–1.07800 (green support zone)
Bullish Setup at Key Support
Should price reach the green zone, I’ll wait for confirmation before entering a long position.
Ideal signs: bullish candlestick patterns, slowing momentum, volume divergence, or strong reaction wicks.
Potential upside target: reversion back to broken structure or trendline zone.
Fundamental Analysis: U.S.-EU Tariff Situation
In addition to the technical structure, we also need to be mindful of the fundamental backdrop, particularly the recent escalation in tariff-related discussions between the U.S. and the European Union.
The Biden administration is reportedly exploring a fresh round of tariffs on EU imports in response to long-standing disagreements around digital services taxes and subsidies in the aviation industry. These talks have gained momentum recently, with the potential for announcements in the coming days or weeks.
Should these tariffs be confirmed, it would likely:
Weigh heavily on the Euro, especially if the EU responds with retaliatory measures.
Increase uncertainty in trade flows, damaging investor confidence in the region.
Trigger a flight to the U.S. dollar as a safe haven asset, further fueling EURUSD downside.
On the flip side, if negotiations lead to a positive resolution or postponement of tariffs, the Euro could see some relief, which may coincide with a bounce from the green support zone on the chart potentially lining up with our long bias at that level.
Conclusion
The EURUSD pair is currently offering a clean, high-probability setup driven by both technical and fundamental factors. With the market respecting bearish structure on the lower timeframes and support levels being broken with ease, the path of least resistance remains to the downside at least until the 1.07500–1.07800 zone is reached.
From there, a shift in momentum could present a great opportunity to switch bias and look for a long entry with favorable risk-reward.
This trade idea remains valid as long as price respects structure. Always manage risk and stay updated with any breaking news around U.S.–EU trade talks, as those developments could heavily influence the direction of EURUSD in the coming sessions.
__________________________________________
Thanks for your support!
If you found this idea helpful or learned something new, drop a like 👍 and leave a comment, I’d love to hear your thoughts! 🚀
Make sure to follow me for more price action insights, free indicators, and trading strategies. Let’s grow and trade smarter together! 📈

Bitcoin - Bears are winning: is $72k next?After holding strong above $81,000 for a while, Bitcoin has finally broken its critical support zone, diving as low as the $74,000 region. This move signals a clear shift in short-term momentum and brings us closer to a significant imbalance zone that has yet to be tested or filled. The drop wasn’t exactly unexpected, especially with the growing macroeconomic pressure weighing on all markets right now.
Last week’s tariff announcement triggered a wave of uncertainty, and we’re now seeing that impact ripple across crypto, equities, and commodities alike. Risk-on assets are feeling the heat, and BTC is no exception.
Why $72K Is So Important Right Now
Looking at the chart, there’s a large imbalance zone sitting just below current price, right around the $72,000 level. This is an area where price previously moved up very aggressively, leaving a gap in the market structure that now needs to be filled for a healthier market. Markets tend to come back to these areas to rebalance before making the next major move.
What makes this zone even more interesting is the fact that it aligns perfectly with the 0.618 Fibonacci level also known as the golden pocket. This confluence makes $72K a very strong support zone, and a likely area where buyers could start stepping back in.
Because of this, I’m expecting another short-term bearish leg into this zone to complete the imbalance fill and tap into the golden pocket. From there, if we see strong reaction and volume kicking in, this could mark the beginning of a new bullish wave.
But What If $72K Doesn’t Hold?
Of course, no level is guaranteed to hold especially in shaky market conditions. If Bitcoin fails to defend the $72K area and breaks down with conviction, the next major target to watch will be the lower imbalance zone at $64K. That would be a deeper correction, but still within the broader context of a bullish cycle rebalancing phase.
A drop to GETTEX:64K would likely shake out more weak hands and allow for a stronger, healthier base to form before BTC attempts to reclaim higher levels. It’s not the primary scenario, but it’s one we need to keep on the radar if things escalate further.
What Comes Next?
In the short term, eyes are on that $72K zone. If BTC finds support there and gives us bullish confirmation such as higher lows, increasing volume, or a strong engulfing candle we could see a swift move back toward the $85K-$95K range.
But with macro uncertainty still looming, caution is key. Monitor how price reacts at support, keep risk in check, and be prepared for both scenarios a bounce from $72K or a continuation to fill the imbalance at $64K.
__________________________________________
Thanks for your support!
If you found this idea helpful or learned something new, drop a like 👍 and leave a comment, I’d love to hear your thoughts! 🚀
Make sure to follow me for more price action insights, free indicators, and trading strategies. Let’s grow and trade smarter together! 📈

XAUUSD SHORT
On 4H, I see a strong confirmation of a bearish trend. Price closed magnificently below the prominent low. Now I am waiting for the Sweep of so marked high, which may look more clear and prominent on lower timeframes and I also want to see price filling the FVG on 4h. Then, after getting the strong bearish candle confirmation I will sell.
Also, according to Trumps' tariffs, the US economy should see an incline whilst being opposite for XAU
OANDA:XAUUSD

Gold - Bullish Trend Faces a Break – A Deeper Pullback Incoming?Gold has been enjoying a strong and steady uptrend, consistently forming higher highs and higher lows within a well-defined ascending channel. However, we’ve now seen a break of structure, with price closing below the lower boundary of the channel. This signals that Gold might be in for a short-term pullback, as the market seeks to rebalance before the next potential leg up.
A break of an ascending channel often suggests that bullish momentum is cooling off, at least temporarily. While this doesn’t necessarily mean a full reversal, it does indicate that buyers may be taking profits, allowing the market to correct before continuing higher. This is a normal and healthy phase in an overall bullish market.
Why a Drop to $2960 Makes Sense
One of the key reasons to expect a pullback is the large imbalance zone that remains unfilled below current price levels. Imbalances in the market occur when price moves aggressively in one direction without creating proper structural support on the way up. More often than not, the market likes to come back and fill these inefficiencies before continuing in its primary direction.
In this case, we have an important confluence around the $2960 level, where the unfilled imbalance meets the 0.618 Fibonacci retracement level (golden pocket). The golden pocket is a high-probability reversal zone, where price tends to react strongly due to the presence of large institutional orders waiting to be executed.
This area becomes even more significant when combined with psychological levels and previous price action support. If Gold pulls back to this level, it could be an optimal entry point for buyers looking to ride the next bullish wave.
What Comes Next?
Once Gold reaches the $2960 region, we will need to watch for strong bullish reactions. If buyers step in aggressively, we could see Gold resume its uptrend and potentially push towards new highs. However, if buyers fail to hold the line at this level, things could get more interesting.
A failed bounce at $2960 would open the door for a deeper correction, possibly extending down to the $2860 - $2900 zone, where we have additional technical support levels. While this is not the primary scenario, it’s important to remain aware of the possibility in case bearish momentum increases.
Final Thoughts
At the moment, Gold is showing early signs of a pullback after breaking out of its ascending channel. The $2960 level is my primary target for this retracement, as it aligns with both the golden pocket and the unfilled imbalance zone. If price reaches this level and reacts bullishly, it could provide a strong buying opportunity before Gold continues its march higher.
However, if $2960 fails to hold, we need to be prepared for a larger move downward before the uptrend resumes. Either way, the next few days will be crucial in determining Gold’s next big move.
__________________________________________
Thanks for your support!
If you found this idea helpful or learned something new, drop a like 👍 and leave a comment, I’d love to hear your thoughts! 🚀
Make sure to follow me for more price action insights, free indicators, and trading strategies. Let’s grow and trade smarter together! 📈

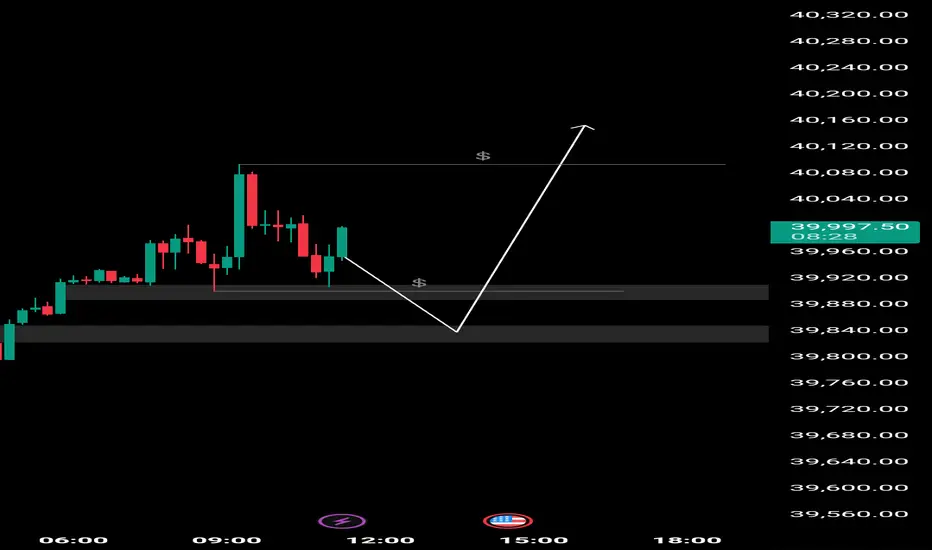
BTCUSDT – Short Setup Brewing at FVG with IFVG ConfirmationMarket Context:
Bitcoin (BTC) continues its retracement phase following a sharp decline, now approaching a high-probability reaction zone. Price is climbing back toward a previously identified Fair Value Gap (FVG), positioned within the premium Fibonacci retracement levels, suggesting a potential area for distribution and bearish continuation.
Technical Breakdown:
- Price bounced off a well-defined support zone, beginning a recovery toward the 0.618–0.65 Fibonacci zone, where the FVG exists.
- An additional Inverse Fair Value Gap (IFVG) has now formed just beneath the FVG zone, creating a dual-layer of imbalance—offering even more potential confluence for a reversal.
- A short position idea is highlighted with a trigger condition: **“If the gap inverses, possible short entry”**—meaning traders are looking for the IFVG to act as resistance following the FVG reaction.
Price Behavior & Trade Setup:
The green path illustrates the anticipated move higher into the FVG zone, likely grabbing liquidity above recent highs. Should price tap this supply zone and then reject into the IFVG, it would present an ideal scenario for a short entry confirmation.
Key Considerations:
- The presence of both FVG and IFVG increases the likelihood of strong resistance forming in this region.
- Rejection at this level would imply smart money distribution, and a renewed bearish leg could develop.
- Patience is key here—entry should only be considered if the IFVG confirms its role as resistance following the sweep into FVG.
Conclusion:
BTC is in a critical retracement phase, and the overlapping FVG and IFVG zones mark a high-confluence area to watch. If price shows weakness after filling the gap, it sets up a clean short opportunity targeting a return to lower support levels. Until that bearish confirmation appears, bulls still have short-term control, but risk is growing as price approaches imbalance zones.

ETHUSDT - Bearish Continuation Within a Descending StructureMarket Overview:
Ethereum (ETH) remains in a well-defined downtrend, consistently forming lower highs and lower lows. The market structure remains bearish, with price respecting the descending trendline. Currently, ETH is showing signs of a corrective move within this broader downtrend, approaching a key Fair Value Gap (FVG) region that could act as a supply zone before a potential continuation to the downside.
Technical Insights:
- The long-term downtrend is intact, as demonstrated by the trendline resistance capping any bullish attempts at recovery. Until price successfully breaks above this trendline with strong momentum, the bearish outlook remains dominant.
- A major support level has been tested multiple times, indicating strong demand in this area. However, repeated retests of support without significant bullish follow-through increase the likelihood of a breakdown.
- The price is currently retracing into an FVG region, which aligns with previous structural resistance. This could serve as an ideal area for sellers to re-enter the market, pushing price lower towards new lows.
Potential Scenario:
If price rejects the FVG zone and fails to break above the descending trendline, the bearish trend is expected to resume. A strong rejection here could lead to increased selling pressure, targeting the key support zone below. If this support breaks, ETH could see a continuation of its larger downtrend, potentially reaching lower price levels.
Risk Considerations:
While the overall trend remains bearish, traders should be cautious of any sudden shifts in momentum that could invalidate the bearish thesis. A strong bullish breakout above the descending trendline would suggest a change in market structure, requiring a reassessment of the outlook. Additionally, macroeconomic factors and broader market sentiment, including Bitcoin’s movement, could influence Ethereum’s price action.
Conclusion:
ETH remains in a clear downtrend, with price currently testing a critical FVG zone within a bearish structure. Unless a significant breakout occurs, the market is likely to continue its descent, with sellers targeting the major support area. Traders should closely monitor price action in the FVG zone for confirmation of the next move.

Bitcoin - Bulls Defend Support: Is a Sell-Off Still Possible?A Major Support Zone Holds Once Again
Bitcoin just tapped into a key 4-hour support level, a zone where price has repeatedly bounced in the past. This area has proven to be a strong demand zone, with buyers stepping in each time price reaches it. What makes this level even more significant is that it perfectly aligns with the golden pocket Fibonacci retracement level, a key technical area where price often finds support before continuing its trend.
As expected, BTC reacted strongly upon reaching this zone, showing a sharp rejection and bounce to the upside. This confirms that buyers are still actively defending this area, and as long as we hold above this level, the probability of a move higher remains strong.
A Huge Imbalance Zone Above – Where Is BTC Likely Headed?
Looking ahead, the most interesting aspect of this setup is the large imbalance zone sitting above the current price. When price moves rapidly in one direction without much consolidation, it creates an inefficiency or imbalance in the market. These imbalances tend to get filled over time as price naturally retraces back to these areas.
In this case, there’s a significant imbalance above us, making it highly likely that Bitcoin will push higher in the coming sessions to correct this inefficiency. I’m targeting at least a 50% fill of this imbalance zone, as this is typically where price starts to show some reaction. This would put BTC at a critical decision point where we could either see further upside or a rejection back down.
If buyers remain in control, we could see Bitcoin fully filling this imbalance, which would push price towards the 84-85K range, a key area to watch for potential reversals.
What If Bitcoin Loses This Key Support?
While the current reaction from support looks promising, we always need to consider the bearish scenario. If Bitcoin fails to hold this golden pocket level and strong support zone, it could open the door for a much deeper retracement.
In this case, BTC could drop significantly, with the next major support sitting around the $72K level. This area represents a critical demand zone where buyers would likely step in more aggressively. A breakdown toward $72K would also signal a much larger corrective move within the broader trend, possibly shifting market sentiment in favor of bears.
What Comes Next?
Right now, Bitcoin is at a crucial point. The bounce from support suggests bullish strength, but the key test will be whether BTC can sustain this momentum and push into the imbalance zone. If we see a clean move into this area, I’ll be watching for potential short setups, as price often struggles to break through these zones in one attempt.
On the other hand, if Bitcoin fails to hold above this golden pocket and key support, the next logical move would be a retest of the $72K region, where buyers will have another chance to defend the trend.
For now, I remain cautiously bullish, expecting at least a partial fill of the imbalance before any major rejection. Let’s see how price action develops in the coming sessions!
__________________________________________
Thanks for your support!
If you found this idea helpful or learned something new, drop a like 👍 and leave a comment, I’d love to hear your thoughts! 🚀
Make sure to follow me for more price action insights, free indicators, and trading strategies. Let’s grow and trade smarter together! 📈

Bitcoin - Bulls Take Control: Short term rally to $86K?Bitcoin has once again reacted to the $81,000 support level, bouncing from this key demand zone and showing signs of bullish momentum. The price is currently moving upwards, and the next logical target appears to be the $85,500 – $86,000 zone, where a Fair Value Gap (FVG) and the Fibonacci golden pocket align. This area is expected to act as a significant resistance level, meaning we could see a rejection from there, leading to another move back toward support.
The plan is to monitor the price as it approaches $86,000, watching for signs of a reversal or continued strength. If a rejection occurs, Bitcoin could make its way back toward $81,000 or lower, providing another potential buying opportunity.
Bitcoin’s Reaction to $81,000 – A Strong Demand Zone
Bitcoin has consistently found support at $81,000, and this level once again played a crucial role in preventing further downside. This area has been tested multiple times, reinforcing its importance in the current price action. Each time the price has dropped to this level, buyers have stepped in aggressively, causing strong rejections to the upside.
The latest bounce from this support level suggests that there is still demand in the market, at least for now. The presence of long wicks at this level indicates that sellers attempted to push the price lower, but buyers quickly absorbed the selling pressure, resulting in a reversal. This move aligns with the broader market structure, which suggests that Bitcoin is still ranging between support at $81,000 and resistance near $86,000.
Short-Term Target: Fair Value Gap (FVG) & Golden Pocket at $86,000
Now that Bitcoin has rebounded from support, the next major area of interest is the Fair Value Gap (FVG) and the golden pocket retracement zone around $85,500 – $86,000. This level is important for several reasons.
First, the golden pocket (0.618 – 0.65 Fibonacci retracement) is a common area where price reversals occur, especially after a significant move. It acts as a magnet for price action, drawing the market toward it before a potential rejection.
Second, the Fair Value Gap (FVG) represents an imbalance in price, meaning Bitcoin could aim to "fill" this gap before making its next major move. Gaps like these often get revisited before the market decides on a new trend direction.
Finally, liquidity is likely concentrated above $85,000, meaning stop losses from short positions could be triggered in this zone, leading to increased volatility. If Bitcoin reaches this level, traders should closely monitor how price reacts. A strong rejection could signal a move back down, while a clean breakthrough could indicate further upside potential.
Potential Rejection and Move Back to Support
Despite the short-term bullish outlook, there is a high probability that Bitcoin will face resistance near $86,000, leading to a pullback. If this rejection occurs, the price could once again retest the $81,000 support level. This would keep Bitcoin within a broader trading range and present another opportunity for buyers to step in.
A failure to hold $81,000 on the next test could open the door for a deeper correction toward $78,000 – $76,000, where more buyers might be waiting. However, as long as Bitcoin remains above the $81,000 mark, the market structure remains relatively stable.
Final Thoughts
Bitcoin is currently in a short-term bullish phase, with price targeting the $86,000 resistance zone. However, traders should be cautious as this level aligns with key technical factors such as the golden pocket, Fair Value Gap, and potential liquidity grab. A rejection from this area could lead to another move back down to support.
For now, the key levels to watch are $86,000 for a potential rejection and $81,000 for a potential retest. If Bitcoin breaks through resistance convincingly, we could see a more extended rally, but until then, the market remains within a defined range.
__________________________________________
Thanks for your support!
If you found this idea helpful or learned something new, drop a like 👍 and leave a comment, I’d love to hear your thoughts! 🚀

ADA - Bearish Rejection from Fair Value Gap (FVG)?This 4-hour chart of ADA/USDT shows price making a strong recovery after a significant drop. However, it is now approaching a key resistance area—a Fair Value Gap (FVG) near the 0.618-0.65 Fibonacci retracement levels.
Here’s the potential setup:
🔹 FVG Resistance: Price is entering a liquidity zone where sellers might step in.
🔹 Possible Double Top Formation: A rejection at this level could lead to a bearish reversal, forming a distribution pattern before dropping.
🔹 Bearish Continuation? If the FVG acts as resistance, ADA could resume its downtrend, targeting lower support zones.
Will this resistance hold, or will ADA break through and continue higher? Drop your thoughts below! 🔥📉

XRP - Decision Point at Fair Value Gap (FVG)This 1-hour XRP/USDT chart shows price consolidating inside a descending channel, approaching a critical Fair Value Gap (FVG) zone.
Key Observations:
🔹 FVG Support: Price is testing an area of inefficiency, which could act as a turning point.
🔹 Two Possible Scenarios:
- Bullish Case: If price holds the FVG and breaks upward, a push toward channel resistance is likely.
- Bearish Case: Failure to hold the FVG could result in a drop toward the lower channel boundary.
Which way will XRP move next? 🚀📉 Let’s discuss!

Cardano - Bullish Breakout! Can Bulls Finally Take Control? Cardano (ADA) has recently broken out of a prolonged bearish trend on the 4-hour chart, signaling a potential shift in market sentiment. This breakout suggests that bullish momentum could be building, paving the way for a move higher. The price action indicates that ADA may now target areas of confluence, where technical factors align to create significant levels of interest. The breakout itself is a strong indication that buyers are gaining control, pushing the price above previous resistance levels. This shift in momentum could be the start of a more substantial rally, especially if ADA continues to attract buyers as it moves higher.
The breakout from the bearish trend also marks a change in the broader market structure. Previously, ADA was confined within a downward trend, but now it appears to be transitioning into a more bullish phase. This transition is crucial for traders, as it presents opportunities for both short-term gains and longer-term investment strategies. As ADA moves higher, it will be important to monitor how it interacts with key technical levels, as these will provide insight into whether the breakout is sustainable or if it will be met with resistance.
Short-Term Target: Golden Pocket and Fair Value Gap
The next logical target for ADA is the golden pocket zone (0.618–0.65 Fibonacci retracement level), which coincides with a Fair Value Gap (FVG). This confluence creates a magnet for price action due to several reasons. The golden pocket is a key area where reversals or consolidations often occur after significant moves. It acts as a strong resistance level and is widely monitored by traders because it represents a point where price action tends to stabilize or reverse. Historically, the golden pocket has been a reliable indicator of potential price reversals, making it a critical area to watch for traders looking to capitalize on ADA's current momentum.
The Fair Value Gap (FVG) represents an imbalance in price caused by rapid movement, leaving untraded zones behind. Price tends to revisit these areas to "fill" the gap, making this level crucial for predicting future movements. Gaps like these often get revisited before the market decides on a new trend direction, which means that ADA's approach to this zone could be pivotal in determining its next major move. Additionally, liquidity is likely concentrated around this area, as stop-loss orders from short positions could be triggered here, leading to increased volatility. If ADA reaches this level, traders should closely monitor how price reacts. A strong rejection could signal a move back down, while a clean breakthrough could indicate further upside potential.
Potential Rejection and Support Levels
While the breakout is promising, there remains a high probability of resistance at the golden pocket and FVG zone. If ADA faces rejection here, it could retrace toward key support levels. The primary support zone, which has held firm during recent consolidation phases, will be crucial in determining whether ADA can maintain its bullish momentum. A retest of this area would provide another opportunity for buyers to step in, potentially leading to a continuation of the current trend.
In the event of a rejection, ADA might initially pull back to test its recent breakout levels. If this support holds, it would reinforce the idea that the breakout is legitimate and that ADA is poised for further gains. However, failure to hold these levels could open the door for ADA to drop toward secondary support zones. These areas, typically marked by previous lows or significant trading volumes, would be critical in preventing a deeper correction. If ADA fails to find support at these levels, it could signal a broader reversal in the market, potentially leading to a retest of lower support zones.
Final Thoughts
Cardano’s breakout from its bearish trend presents an exciting opportunity for traders. The golden pocket and FVG alignment around the target zone make it a critical area to watch. Traders should remain cautious as price approaches this resistance level, looking for signs of rejection or continued strength. Monitoring the price action closely will be essential in determining whether ADA has the momentum to push through resistance or if it will be forced back into a consolidation phase.
For now, the key levels to monitor include the resistance at the golden pocket/FVG zone and the support at recent breakout levels. A decisive breakout above resistance could signal further upside potential, while failure might keep ADA within its broader range structure. As ADA navigates these technical levels, traders should be prepared for increased volatility and potential trading opportunities. Whether ADA continues its ascent or faces a pullback, the current market conditions offer a compelling setup for traders looking to capitalize on the cryptocurrency's movements.
__________________________________________
Thanks for your support!
If you found this idea helpful or learned something new, drop a like 👍 and leave a comment, I’d love to hear your thoughts! 🚀
Make sure to follow me for more price action insights, free indicators, and trading strategies. Let’s grow and trade smarter together! 📈
