Spy - 3 levels to amazing entryHello everyone, as we can see our last 2 major financial crysis were 3 and 2 years, and each of them we had a drop of around 50%. This virus started the crysis and even if people say that the virus is not as serious as the media makes it out to be, people's perception of the virus is that the virus is really serious, so this is why the panic could be hard to be stopped so easily. I would say that we have 3 key levels that we could buy or add to our positions, which I have listed on the chart. I am waiting for support 2 or 3, because I believe now is too early for making a higher high anytime soon, but this is just opinion, not a financial advice! Like and follow for more ideas!
Fall


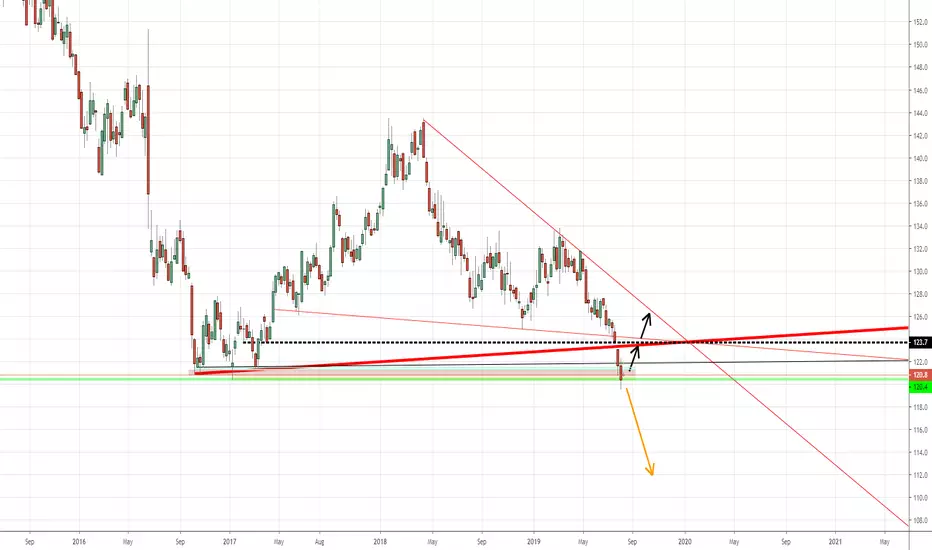
GBPUSDSHORTS TO 1.25000, IF MARKETS KEEP GETTING SHREDDED AND THE BRITISH ECONOMY WEAKENS, BUT WE CAN SEE RISE IF THIS IS THE END OF THE OF THE BLOODSHED!

Gold - retracement to the supportAs we can see on the daily chart, we have big divergence, we had a big rise that needs a retracement, so we expect going back to the support of the channel and possible break of the channel.

Hang Seng Index Near to Its Weekly 200 EMAHang Seng (HongKong) Index Daily Chart trading Below All its 50 100 200 EMA.
Expecting Support from Weekly 200 EMA Levels 26600.
If Broken Further Downfall can be expected As per the levels on the chart.
Do Your Own Analysis Before Investments.

In an Ascending Channel & Meeting Descending ResistanceIn an ascending channel & meeting the descending resistance. Ascending channels breakout to the downside. We were rejected at the descending resistance, and have ran out of steam. I expect us to fall to $7,500 BTC. The numbers all over the chart are the top 5 largest BTC wallets showing when and how many BTC were moved into those wallets. Each color represents a wallet/person.

The crysis is coming. I don't know the zone the point exactly, but we are very close of the fall of the indices.

XRPUSD SELL (+2.6 to 6% gain)Here are 2 takeProfit/support levels I've drawn. XRP should hit those levels, with most probability on hitting the first one
Right now I've placed a SELL margin-trade at Krakken at 0.18553. I've placed also my takeProfit on the 1st level.
(2,6% is already nice). But I'll keep on watching what's happening, and will surely move the TP
a bit below later (if TP not yet reached).
I think that second levels will be a battle to reach, but it will go there I think. (I mean the 6% TP level).
In fact we have a better visibility on 15-MIN chart. The lines I've drawn are in fact from that 15MIN chart. But it's okay on 1HOUR though.
Don't take my words for granted, do your analysis, analyze again, then trade at your own risks.
Don't hesistate to hit the LIKE BUTTON and SUBSCRIBE for more ideas to come. Thank you


BNB - THE TURNING POINT IS NOW!Hi Guys!
We will now see a moment of decision.
If BNB stops the fall and returns to rise, then we will know that it is in a primary uptrend, which reassures all of us that we have their currencies.
But (!) if that falls beyond the point of 15.33 on the daily candle, then we are experiencing a big downtrend and it is better to get off the boat.
I believe in bulls, but the overall timing of cryptocurrencies is shaken, so we can't believe anything.
Check out the full chart below

$7800 BROKEN !!!!!! GET READY !!!$7800 has been BROKEN, $7500 is next target , get ready and set up smart stop losses .
Also historically, GMT 5PM - 9PM are the daily bear timezone for BTC, so get ready for futher price fall.


XBTUSD Blood on the street, how longer? #XBTUSD Update
Hey members, bloody days.
#BITCOIN broke the triangle wich we have more than a month following carefully and as i said in the last TA. Moving us to the current support levels around $7200 - $8547.
So, whats our actual see about the markets?
The Cryptocurrency Total Market Cap lost around 20% of its value this week, that means a loss of $35Bn USD in less than 2 days.
The next relevant zone that investors will be looking at closely is the $45-40Bn level, which may attract fresh capital if the BTC index pulls back positively.
If we take confluences into consideration, the next bounce we are expecting is highly correlated with BTC's next key support at $7400-$6500. The recovery of this week’s fall won't happen overnight, it could well tale a few weeks until bulls regain control.
So, there is a strong probability of another drop in both markets, Altcoins and majors, of around 15-20%. Large-cap funds are likely to wait for the next reliable bottom to re-enter.


when bears enjoy the flight... :)NYSE:BA is extremely extremely bearish
this guy probably is not gonna land in the airport but the toilet :D
Sell aggressively

Bitcoin - Gods are talking about the next BIG MOVE!!Hello guys!
I just kidding, gods didn't talk nothing for me is just another analysis from your friend UNCODED.
Today we can see a probabilistic prediction for the Bitcoin in next coming weeks!
So, we probably can test/fall to the area around:
$8064 - $7582
And after that we can see a litle pump to the $14k area, so let's see.
That's it for now!
Follow me and if u have any questions send me a msg on instagram!
@uncodedmind

BXY (among others) be scared... Cliff fall is entirely possible.MANY of the major currencies are close to breaking their floors.
They have no real support after this collapse...
This makes the USD incredibly stong (NOT a good thing)
Only do to the fact that it is the global reserve and every other currency is in free fall...
BE CAREFULL, BE PROFITABLE!
Bitcoin plans to violate the fallen angelfallen angles btc is here what i said
cross line is acting like heal just for those one who lost their benefits
but after 8500$ btc act like hammer of thor
just this one firing this heal to which number again ? what is your idea
13.000$
25.000$
88.000$
write your idea

RISE or FALL!? Big Movements to be made!So we can see Bitcoin forming a potential head and shoulders, very clear! At the same time it is also following a nice trend support line and Bullish Symmetric Triangle.
BEARISH: If Bitcoin drops below the trend support line i will be very bearish as it heads for my minor support zone at the 0.618 Fib at roughly the $10000 mark. Breaking this support zone will see as crashing to the major support zone i have outlined at the point 0.786 fib at around $8900 before bouncing.
BULLISH: If Bitcoin respects the support trend line and Bullish Symmetric Triangle you can find us retesting the new resistance levels at around $12441 which in my opinion shouldn't be too hard to break.
GOODLUCK my friends :)
Aus -

Comparison of parabolic moves in BitcoinGiven the recent parabolic move in Bitcoin, I thought I would take a look at previous parabolic moves.
Disclaimer: The below is by no means an exact calculation, but more some things I noticed and wanted to share. Also, the dataset is way too small to get to any exact conclusions. Also, this is my first publication ;-)
PAST
I started with identifying all the parabolic moves I could find on the daily or weekly timeframes and draw best fitting arcs (yellow A-G), making sure the arcs would only move up and right (no down or left movement allowed).
Then I added the measurements of the move up and the following maximum move down (white dashed arrows), giving me percentages. Now, the markets are not exact, so these measurements should me looked at in a rough way.
What I first noticed, was that the bigger the parabolic movement up, the bigger the crash afterwards (percentage wise). Let's see if we can more details on that.
First, I looked at A and B. They are very similar in the up move (200 vs 250%), and also quite similar in the down move (50-55% respectively). Let's just say for simplicity that a 250% parabolic up move results in a 55% down move.
Then I looked at C and D. Very similar up moves (roughly around 2000%), and very similar down moves (roughly 85%).
Now we get to E: the move up is only about half of A or B, and also the down move is less: about 40%. So, if the up move is twice as big (120 vs 250%), the down move is only about 15 percentage points bigger (40 vs 55%).
Did I already mention that these numbers are not exact, and that I'm rounding them a lot? ;-)
Now let's compare C & D with A & B: An up move of about 8x bigger (250 vs 2000%), results in a down move that is 30% percentage points bigger (85 vs 55%).
Now, I looked at F, the mother of all bull markets in BTC. This curve show an increase of roughly 5500%, more than 2.5 times the increase of C & D. We don't know what the full down move is, since we're not sure the bear market is over. Now for simplicity's sake, let's just assume it is 2x the increase (way off, but this is just to illustrate an idea).
So:
E: 1x up move = -40%
A & B: 2x up move = -55% (-15% extra)
C & D: 16x up move = -85% (-30% extra; 8x compared with A & B, 16x compared with E)
F: 32x up move = ?
Now, looking at the above, one would conclude that the drop after F is probably larger than the drop after C or D, because the up move is also bigger. How much? Well, it's not linear and it has to be less than 100%, so let's see what we can find.
I decided to plot the few datapoints we have in a graph, drawn by hand ;) To me, it looks like a parabolic curve, although more datapoints would be better.
PRESENT AND FUTURE
As you can see in the graph, the projection for the drop of our parabolic F move hardly fits on the graph, but the estimated drop would be something like 90-95%. I drew some orange arrows in the chart from the top of F to 1830 and 1360 levels, and those ended up being 90-93%, both likely targets (long term). We already dropped 84% to the 3000 area, which was also an area of support.
Now we have started another parabolic move from 3k upwards, and as of writing we are at the 11k level. So far that is a 260% move up. Where will this move end? I decided to draw a best fit trend line (magenta) from 2012 through 2017 and right through the point where we dropped from 6k to 3k. Right now we are very close to this trend line and I think this will be big resistance, just like the diagonal trendline (in red) was when we got to 20k. If this magenta trend line happens to be the top of this parabolic move, and comparing with the previous parabolic moves, I expect a drop of about 55%. Targets of 6k (50%) and 5k (60%) are likely support areas here.
Now what will happen in the future... nobody knows, but based on the parabolic curves I can see at least a bullish and a bearish scenario, assuming that we can't break the magenta trend line:
BULLISH
We drop about 55% from around the 11k level and stay above the green supporting trend line. This could set us up for another parabolic move, just like we got a big move F after E. This could take us to 250-500k bitcoin in a couple of years.
BEARISH
We drop about 55% from about the current 11k level and eventually drop below the green support line. I think it is then very likely we go to 1800-1300 levels and we'll have some more bear market for some years to come.
If we happen to drop 85% from the current parabolic move (G) we end up at the 90-95% target for curve F (but that doesn't fit the idea).

Fall will continue ? BitcoinThe trend line was broken with consolidation below, this decrease can be called a pulse, therefore, based on the pulse analysis, we will see a continuation of the decline, the first zone 6800-7100 is the fibbo level and the last hope of bulls.
At the moment, I see flat and bullish signals on the indicators, but from this moment, while we are under 8300 - short priority, but only after the breakdown of 8300 you can re-enter longs, but this will not happen, most likely as always - we will see flat after which there will be a continuation of the decline, on the principle of inertia.

USD - THE FALL OF THE US DOLLERLonger term anaylsis
Rising edge / bearish flag forming
topping out at the golden 61.8 ratio
drop is coming

New Zealand Dollar TraceAt the 4 hour chart we're at a 50% pullback which also respects trend line area, following the trend we could look at a fall to 0.64600 as a daily support.
