Falling

Cardano (ADA/BTC)Cardano:
- RSI @ 47 (nearing oversold).
- MACD crossed on Feb 9th., holding trend now, may continue sideways.
Falling Wedge?
Symmetrical triangle?
Can it break past 0.236 Fib Retracement level (black lines) or the 0.382 Retracement level (orange lines)?
New upper price channel forming?
Watch Bitcoin, everything is following btc right now. If BTC dips again under past 8k, expect ADA to follow and dip as well, down below the symmetrical triangle. If BTC can hold steady or take off to 9k-10k, expect ADA to follow similarly with bullish movements, hopefully breaking out of the symmetrical triangle towards the first resistance level - 0.236 Fib retracement level.

Ichimoku bounce completed. Waiting to the second one!Well, as you can see 99% of ideas was canceled due to market collapse. For most of us it was unpredictable situation. I also was hoping to enter ALL IN in long position after bouncing @ 1.08 but this does not happened.
Now we can see strong bearish trend, bulls are tired now.
Ichimoku cloud concept defines trend bouncing 2-3 times per cycle. We already see first well recognizable bounce, and waiting for the second one. There is a strong support at daily 200 EMA at 0.75, which can retrace ripple to the ichimoku cloud at 0.85 where strong resistance is located. Re-bouncing 0.85 will make second wave to the lower support at 0.40.
If ripple brokes Ichimoku cloud, then we can expect consolidating, and future reversal, but this is unlikely.
I am short on this buying at 0.85, Target 0.40, Stop 0.95
Happy trading, and make some profit. This is not an advice. This is my own decision.

DASH going way downChart : 4 hourly
Pattern : down breakout from symmetrical triangle
Prediction duration : 4-6 days
Target: 305 $ based on Fib retracement level
Range : 1117.5 $ to 614.88 $
Fibonacci retracement 1.61 level : 304.24 $
Supporting indicator : 12 and 26 SMA show downtrend and diverging with 12 SMA below 26 SMA.

SPY wedge breaks to upside is my guess.Falling wedge pattern in prices with rising relative strength. Looking to see if prior support holds and prices break to upside.

SNT - Still Not Tanking coinWhile many other coins have been falling strongly against BTC in the past week or so, SNTBTC has stayed relatively stable.
Currently, volume is low, and it is forming a falling wedge (orange lines). We could soon see a breakout. If this happens, it will test 3000 sats resistance, then 3500.
A breakout from the sideways parallel channel happens if it breaks 3500 convincingly, and should take us to new highs.
2 ways to play this: wait for a falling wedge breakout before buying, or near the bottom line of the wedge. The first option is recommended. 1st target: 3500 sats.

Falling wedge TRX - ready to change trendThe falling wedge pattern of tron is almost at its end.
The optimistic side of me thinks it will make a run towards the ATH.
But it could as easily stay hovering within it's new trading range.
Which scenario and height do you think it will head for?


IOTAUSD - Correction is done, time to start the rocket again.Here's my new favorite: IOTA.
Technical:
During the ABC - correction, a falling wedge was created. Falling wedges are normally known as bullish chart patterns. IOTA breaking this wedge in combination with the bullish divergence both in the MACD and the Stochastic RSI gives a strong bullish signal. Because there is a more or less strong resistance at 4.00$ now, we can use this as a bullish confirmation and open trades as soon as IOTA rises above this point.
Fundamental:
A lot of hype was created around IOTA lately causing and because of the 1000% rise in only two weeks. At the moment, the high media presence of Bitcoin attracts new investors. Those are often looking for the "next Bitcoin". As IOTA kickstarted this rocket lately and as there are many new people, we've got a bunch of new money in the game that wants to be thrown into IOTA.
We have to look carefully what Bitcoin is doing. A correction is overdue. On the other hand, it can go nuts again every second. The altcoin market, including IOTA, always has to bleed in both cases.
Good Luck.
Disclaimer: I'm a relatively unexperienced trader, so don't consider this investment advice.

Long Opportunity - Falling Wedge/Bearish Cypher - At Buy LevelAVT has been firmly stuck in a bear trend for the week or so. The chart started off looking very bullish, but has since pulled all the way back to the original .786 fib line. It appears we should be nearing a reversal, as two patterns have clearly formed that suggest a breakout above $3 is on the horizon.
When we look at the trend lines we see a falling wedge, but it is also set up to complete the CD leg of a bearish cypher. The indicators are still bearish so we need confirmation of a reversal & volume has been low which will obviously need to change. Overall, I think this is a good opportunity given how this chart has played out so far with high probability. Set a tight stop as this pattern can't go very much lower & still be valid.
Buy: 2.5 - 2.7
Stop: 2.45
Target: 3.98

$KORE wanting to break out of the falling wedge??Kore has been very volatile over the last couple of weeks . . . However. A trend is emerging, and with the new wallet being updated to Bittrex, I think we can witness a TO DA MOON event!

BTC Falling Wedge in 12h Chart. BullishFalling wedge in 12h chart. Ignoring the FUD sell due to China news which was rejected by the market straight away.

14/09/2017 BTC/USD AnalysisPrice had a big fall after the announcements of China. www.reuters.com
www.reuters.com

17/08/2017 S&P500 Analysis"Stocks, U.S. yields fall on U.S. policy doubts, Barcelona attack" www.reuters.com

AUDUSD SHORTThis pair has been on my radar for a while and I have also been in this trade with 2 positions from where my predictions starts. It is a slow Monday ATM for this chart but i am expecting a breakout of this pair to the downside as price broke resistance but has now falling back into place. This price action has taking longer than expected but still in profit.
PATIENCE IS KEY!!
FALL, FALL, FALL
0.77190 as support but TP at 0.77525 to allow for margin of error.

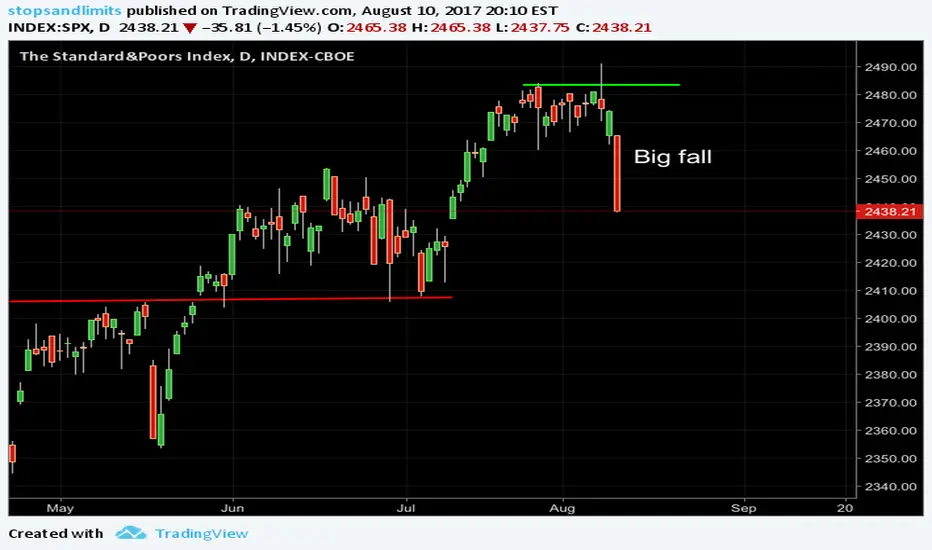
10/08/2017 S&P500 Analysis"S&P falls 1.4 percent in safety flight on North Korea tensions".
TVC:SPX
www.reuters.com
medium term buy set uplooking to the upside, if price struggles to break above the pattern take profits


20/06/2017 S&P500 AnalysisAfter a bullish day, Tuesday was a day in red for most of the markets worldwide. Generated mainly by a fall in oil prices, which led to levels that it did not reach for many days. www.reuters.com

USD BITCOIN: How to hedge against a falling $ this weekendDXY: Dollar Index The Dollar closed on its lows for the weekend and will likely be sold off heavily if not in Tokyo, in London come Monday. it should fall a further 1.7% from here.
But there could still be an opportunity this weekend to hedge - it depends on Bitcoin breaking above 2460. If it does, it should be worth following. Please see Bitcoin comment also.


FALLING IN LOVE - GBP/USD SHORT SETUP | RR 3,61Hey Guys,
here comes the free fall. Enjoy it. Peaceeee :)
