BITCOIN → From consolidation to distribution. Market weaknessBINANCE:BTCUSDT.P is moving from consolidation to a correction phase. The price broke through the support zone of 114.5–115.5, closing within the Friday trading session in the sell zone...
Previous idea from July 22: BITCOIN → Consolidation and compression to 116K. Correction?
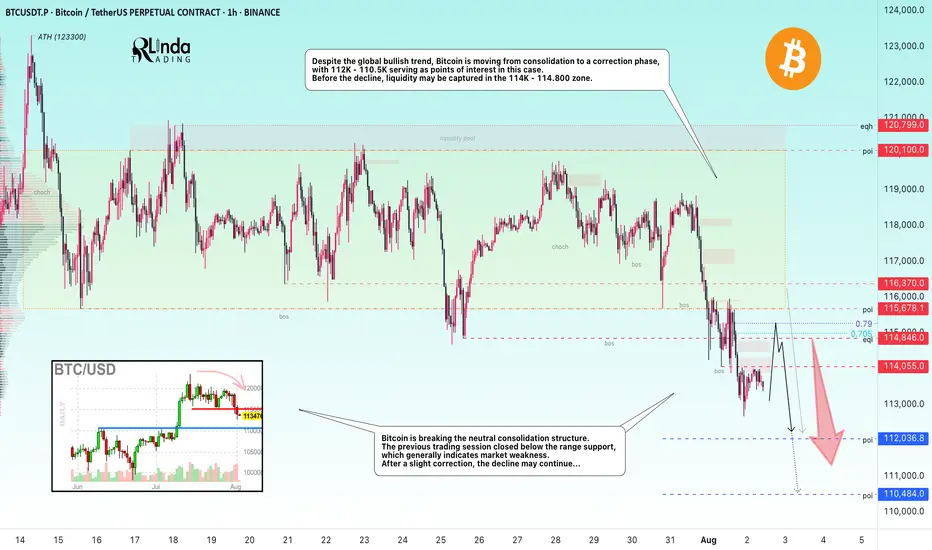
The fundamental background is shifting to neutral, the hype has temporarily ended, and there are no bullish drivers yet. And for the health of the market, a correction is needed. Bitcoin is breaking the neutral consolidation structure. The previous trading session closed below the support range, which generally indicates market weakness. Despite the global bullish trend, Bitcoin is moving from consolidation to a correction phase, with 112K - 110.5K serving as points of interest in this case. Before the fall, liquidity may be captured in the 114K - 114.800 zone.
Resistance levels: 114.05, 114.85, 115.67
Support levels: 112.03, 110.48
After a strong movement, the market may enter a correction or local consolidation, during which it may test the specified resistance zones before continuing its downward movement to the zone of interest and liquidity at 112 - 110.5.
Best regards, R. Linda!
Falling Wedge
XRPUSDT → Range formation. Retest of resistanceBINANCE:XRPUSDT.P , after a false breakout of the daily resistance level of 3.352 and the elimination of traders, has entered a correction phase. The trading range shown below has been formed, with an emphasis on resistance...
XRP previously formed a false breakout of the daily resistance level of 3.352, as indicated in the idea above. After changing its market character, the price entered a correction phase. Focus on the range of 3.00 - 3.264. A retest of resistance (zone of interest and liquidity) is possible before falling to 3.161, 3.05 or to the liquidity zone of 3.00. There are no technical or fundamental reasons for exiting the consolidation; most likely, a retest of the zone of interest may end in manipulation and a pullback to support...
Resistance levels: 3.1609, 3.264, 3.352
Support levels: 3.05, 3.00
I do not rule out the fact that a retest of the 3.264 resistance level may have a breakout structure and the price will continue to rise, but based on the price behavior pattern on D1, the market structure, and market stagnation, I conclude that at the moment, the chances of seeing a correction from resistance are higher. Further developments will need to be considered after the retest of key zones on the chart...
Best regards, R. Linda!

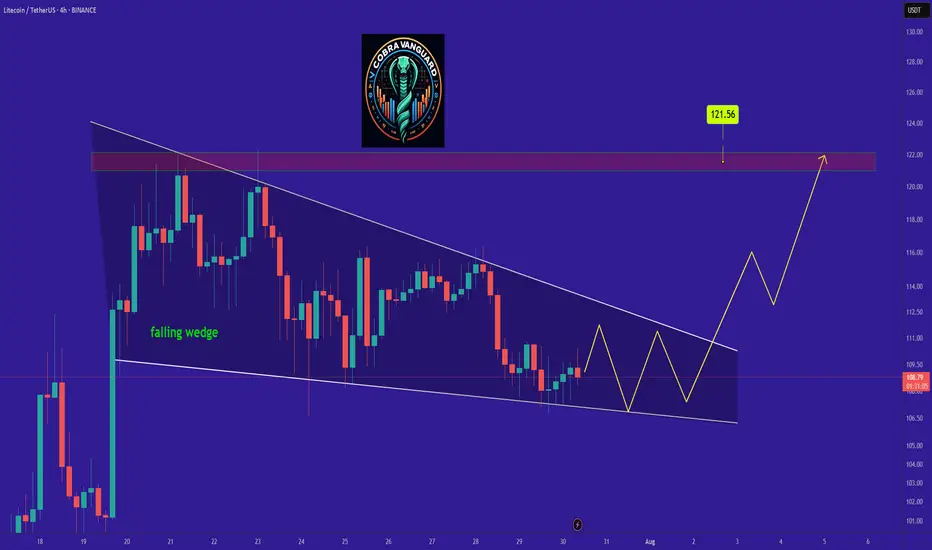
LTC is bullish now and many Traders don't see itSo if you pay attention to the LTC chart you can see that the price has formed a Ascending wedge which means it is expected to price move as equal as the measured price movement.( AB=CD )
NOTE: wait for break of the WEDGE .
Best regards CobraVanguard.💚
BITCOIN → Hunting for liquidity. Retest resistance before a fallBINANCE:BTCUSDT.P continues to consolidate after a strong rally. There is no strong driver yet, and Bitcoin is reacting weakly to economic data. There is a possibility of a continued correction...
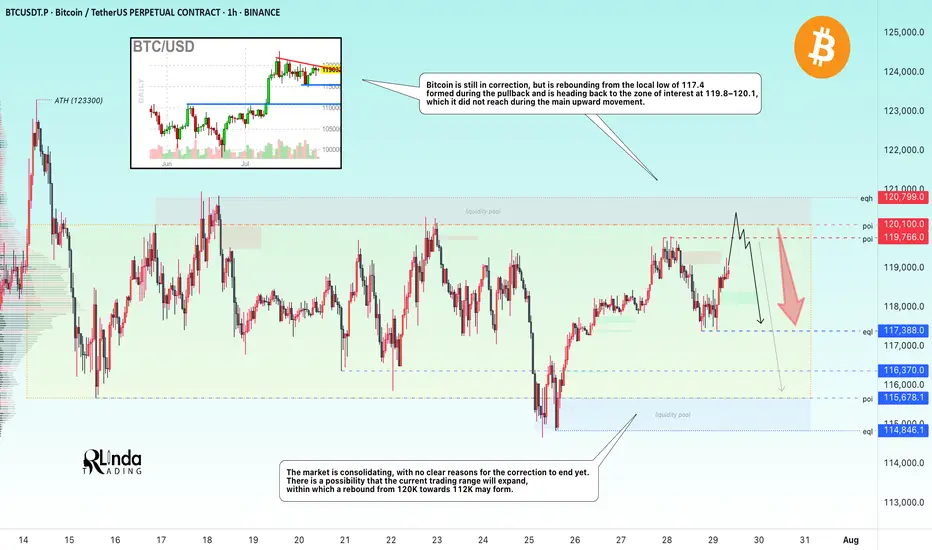
Bitcoin is still in correction, but is rebounding from the local low of 117.4, formed during the pullback, and is heading back up towards the zone of interest at 119.8-120.1, which it did not reach during the main upward movement. I see no fundamental or technical reasons for the correction to end and for growth beyond 121K. I expect a rebound from the resistance zone towards 115-114K. However, in the medium term, I expect the market to attempt to close half or all of the gap between 112K and 114.8K, thereby expanding the key trading range.
Resistance levels: 119.77, 120.1K, 120.8K
Support levels: 117.4, 116.37, 115.68
Technically, a false breakout (liquidity capture) of key resistance and price consolidation in the selling zone could trigger bearish pressure on the market, which in turn would lead to a correction.
Best regards, R. Linda!
GOLD → Retest of trend support. Consolidation...GOLD is consolidating below the previously broken trend support. On Sunday, Trump announced a trade deal with the EU, which is putting pressure on the market along with the rising dollar...
Gold rebounded from support at $3310 after a week-long low, interrupting a three-day decline amid profit-taking. However, the overall downtrend remains intact as markets brace for a busy week with the release of US GDP data and the Fed's decision. Optimism surrounding US-China trade talks and the US-EU framework agreement is reducing demand for safe-haven assets. Additional pressure on gold is coming from easing geopolitical tensions: Thailand and Cambodia have agreed to ceasefire talks. The metal's recovery may be short-lived.
Technically, we have global and local bullish trends, against which gold is testing support, but as we can see, buyers are trying to hold back the decline due to uncertainty over interest rates. There is a chance that we will see active action by the Fed, behind which lies a rate cut, this week...
Resistance levels: 3345, 3375
Support levels: 3320, 3287
At the moment, I do not see a proper reaction to the support breakout. The price is consolidating after confirming the key trigger at 3345. Thus, if the price starts to return to 3345, test and consolidate above the level, we will have a chance for growth. I do not rule out a liquidity grab from 3325 (false breakout) before the rise.
BUT! The structure will be broken if the price breaks 3325 - 3320 and begins to consolidate below this zone. In this case, gold may fall to 3287
Best regards, R. Linda!

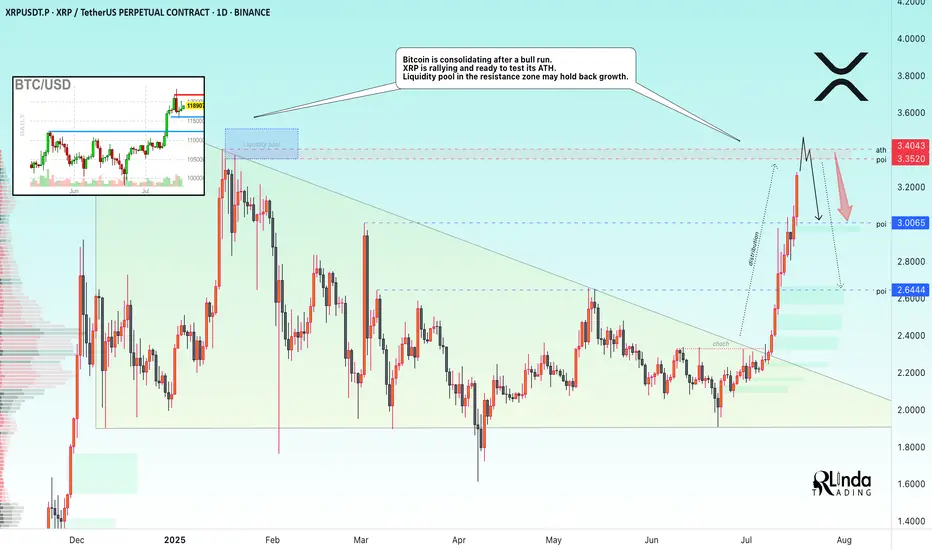
XRP → ATH retest. Reversal or continued growth?BINANCE:XRPUSDT.P is rallying and ready to test the resistance zone - ATH. Against this backdrop, Bitcoin is consolidating after a bull run. The liquidity pool may hold back growth.
Fundamentally, there is excitement across the entire cryptocurrency market. Altcoins are rallying after Bitcoin hit a new high and entered consolidation. The BTC.D index is declining, which generally provides a good opportunity for altcoins to grow. However, the index is approaching technical support, which may affect market sentiment overall...
As for XRP, there is a fairly strong liquidity pool ahead — the ATH resistance zone. The price is in a distribution phase after a change in character and a breakout of the downtrend resistance in the 2.33 zone. The momentum may exhaust its potential to break through the 3.35-3.34 zone, and growth may be halted for correction or reversal (in correlation with Bitcoin's dominance in the market).
Resistance levels: 3.35-3.40
Support levels: 3.0, 2.64
A breakout of resistance without the possibility of further growth, a return of the price below the level (i.e., inside the global flat) will confirm the fact of a false breakout of resistance, which may trigger a correction or even a reversal.
Best regards, R. Linda!
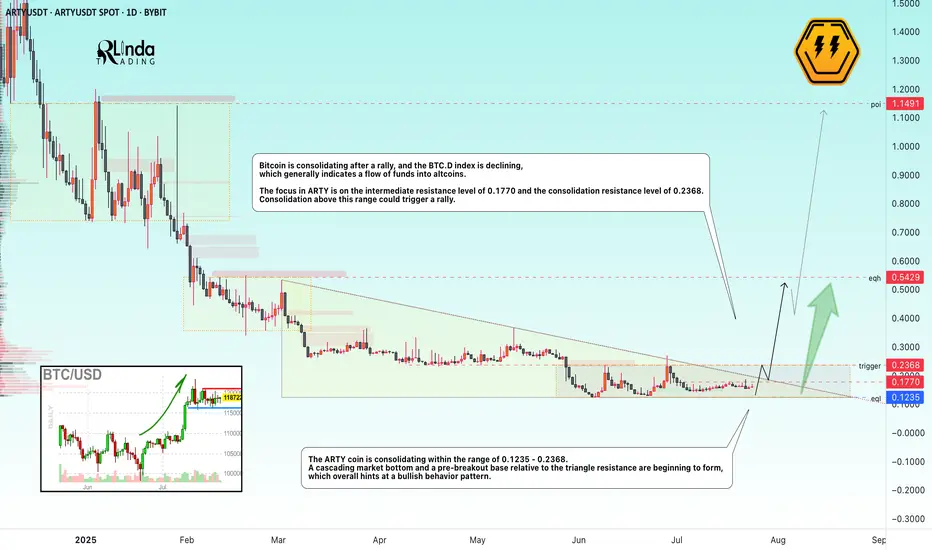
ARTYUSDT → A breakout of resistance could trigger another rallyBYBIT:ARTYUSDT is forming a cascading bottom as part of consolidation before a possible breakout of resistance. The decline in Bitcoin's market dominance gives altcoins a chance.
( (Idea from September 29, 2024!) We previously discussed this coin before its 300% rally. The root causes of its emergence from accumulation and readiness for strong growth were correctly identified).
The dump phase is coming to an end, a cascading market bottom is beginning to form, and a pre-breakout base relative to the triangle resistance is forming, which overall hints at a bullish behavior pattern.
Bitcoin is currently consolidating after the rally, and the Bitcoin dominance index is declining, which generally indicates a flow of funds into altcoins. The situation is such that the altcoin market has another chance for the season. The correction across the entire market may end in the near future, and under favorable conditions (the fundamental background is strengthening, Trump has announced another important event for cryptocurrencies), the market may return to strong movements...
The focus in ARTY is on the intermediate resistance at 0.1770 and the consolidation resistance at 0.2368. Consolidation above this range could trigger a rally.
Resistance levels: 0.2368
Support levels: 0.1235
Technically, a few days ago, the coin tested the consolidation resistance, but the decline did not continue, which generally indicates that buyers are showing interest and holding the market. Consolidation in the near term may end with a retest of 0.1770, 0.2368, a breakout, and further growth.
Best regards, R. Linda!
Trading Divergences With Wedges in ForexTrading Divergences With Wedges in Forex
Divergence trading in forex is a powerful technique for analysing market movements, as is observing rising and falling wedges. This article explores the synergy between divergence trading and wedges in forex, offering insights into how traders can leverage these signals. From the basics to advanced strategies, learn how you could utilise this approach effectively, potentially enhancing your trading skills in the dynamic forex market.
Understanding Divergences
In forex trading, the concept of divergence plays a pivotal role in identifying potential market shifts. A divergence in forex, meaning a situation where price action and a technical indicator like the Relative Strength Index (RSI) or Moving Average Convergence Divergence (MACD) move in opposite directions, often signals a weakening trend. This discrepancy is a valuable tool in divergence chart trading, as it may indicate a possible reversal or continuation of the current trend.
There are two primary types of divergence in forex—regular and hidden. Regular divergence occurs when the price makes higher highs or lower lows while the indicator does the opposite, often signalling a reversal. Hidden divergence, on the other hand, happens when the price makes lower highs or higher lows while the indicator shows higher highs or lower lows, typically suggesting a continuation of the current trend.
Trading Rising and Falling Wedges
Rising and falling wedges are significant patterns in forex trading, often signalling potential trend reversals. A rising wedge, formed by converging upward trendlines, often indicates a bearish reversal if it appears in an uptrend. Conversely, a falling wedge, characterised by converging downward trendlines, typically reflects a bullish reversal if it occurs in a downtrend.
Traders often look for a breakout from these patterns as a signal to enter trades. For rising wedges, a downward breakout can be seen as a sell signal, while an upward breakout from a falling wedge is often interpreted as a buy signal. When combined with divergences, this chart pattern can add confirmation and precede strong movements.
Best Practices for Trading Divergences
Trading divergence patterns in forex requires a keen eye for detail and a disciplined, holistic approach. Here are key practices for effective trading:
- Comprehensive Analysis: Before trading on divergence and wedges, be sure to analyse overall market conditions.
- Selecting the Right Indicator: Choose a forex divergence indicator that suits your trading style. Common choices include RSI, MACD, and Stochastic.
- Confirmation Is Key: It’s best to watch for additional confirmation from price action or other technical tools before entering a trade.
- Risk Management: Traders always set stop-loss orders to manage risk effectively. Divergence trading isn't foolproof; protecting your capital is crucial.
- Patience in Entry and Exit: Be patient as the divergence develops and confirm with your chosen indicators before entering or exiting a trade.
Strategy 1: RSI and Wedge Divergence
Traders focus on regular divergence patterns when the RSI is above 70 (overbought) or below 30 (oversold), combined with a rising or falling wedge pattern. The strategy hinges on identifying highs or lows within these RSI extremes. It's not crucial if the RSI remains consistently overbought or oversold, or if it fluctuates in and out of these zones.
Entry
- Traders may observe a regular divergence where both the price highs/lows and RSI readings are above 70 or below 30.
- After the formation of a lower high (in an overbought zone) or a higher low (in an oversold zone) in the RSI, traders typically watch as the RSI crosses back below 70 or above 30. This is accompanied by a breakout from a rising or falling wedge, acting as a potential signal to enter.
Stop Loss
- Stop losses might be set just beyond the high or low of the wedge.
Take Profit
- Profit targets may be established at suitable support/resistance levels.
- Another potential approach is to exit when the RSI crosses back into the opposite overbought/oversold territory.
Strategy 2: MACD and Wedge Divergence
Regarded as one of the best divergence trading strategies, MACD divergence focuses on the discrepancy between price action and the MACD histogram. The strategy is particularly potent when combined with a rising or falling wedge pattern in price.
Entry
- Traders typically observe for the MACD histogram to diverge from the price. This divergence manifests as the price reaching new highs or lows while the MACD histogram fails to do the same.
- The strategy involves waiting for the MACD signal line to cross over the MACD line in the direction of the anticipated reversal. This crossover should coincide with a breakout from the rising or falling wedge.
- After these conditions are met, traders may consider entering a trade in anticipation of a trend reversal.
Stop Loss
- Stop losses may be set beyond the high or low of the wedge, which may help traders manage risk by identifying a clear exit point if the anticipated reversal does not materialise.
Take Profit
- Profit targets might be established at nearby support or resistance levels, allowing traders to capitalise on the expected move while managing potential downside.
Strategy 3: Stochastic and Wedge Divergence
Stochastic divergence is a key technique for divergence day trading in forex, especially useful for identifying potential trend reversals. This strategy typically employs the Stochastic Oscillator with settings of 14, 3, 3.
Entry
- Traders may look for divergence scenarios where the Stochastic readings are above 80 or below 20, mirroring the RSI approach.
- This divergence is observed in conjunction with price action, forming a rising or falling wedge.
- Entry may be considered following a breakout from the wedge, which signals a potential shift in market direction.
Stop Loss
- Setting stop losses just beyond the high or low of the wedge might be an effective approach.
Take Profit
- Profit targets may be set at key support/resistance levels.
The Bottom Line
Divergence trading, coupled with the analysis of rising and falling wedges, offers a comprehensive approach to navigating the forex market. By integrating the discussed strategies with sound risk management and market analysis, traders may potentially enhance their ability to make informed decisions in the dynamic world of forex.
This article represents the opinion of the Companies operating under the FXOpen brand only. It is not to be construed as an offer, solicitation, or recommendation with respect to products and services provided by the Companies operating under the FXOpen brand, nor is it to be considered financial advice.

BITCOIN → Consolidation and compression to 116K. Correction?BINANCE:BTCUSDT.P continues to consolidate, with the price testing support at 116K, leaving behind the zone of interest at 120K-121K. Are there any chances for further growth?
(Alternative scenario (if growth to 120K does not occur))
Fundamentally, there is nothing particularly new, and the hype surrounding Bitcoin is stagnating. Technically, on D1, consolidation is underway with pressure from bears against the backdrop of an outflow of funds into altcoins. However, the dominance index is starting to rise, which could trigger some correction in the market. The price on the working timeframe, without updating local highs, is testing lows, and the latest retest of the liquidity zone is provoking a fairly aggressive reaction that could bring the price to retest the zone of interest at 120K-121K.
But! If the price is squeezed between 116K and 0.5 Fib with a gradual squeeze towards support, the chances of a breakdown and a premature fall will increase.
Support levels: 116370, 115860
Resistance levels: 119650, 120100
Technically, the market needs a breather or correction, which is generally a sign of health. The nuance with Bitcoin is that below 115860 there is no support until 112K, and if the market breaks the current consolidation boundary, the further correction could be quite deep. In the current situation, I do not yet see any drivers or reasons for another rally.
Best regards, R. Linda!

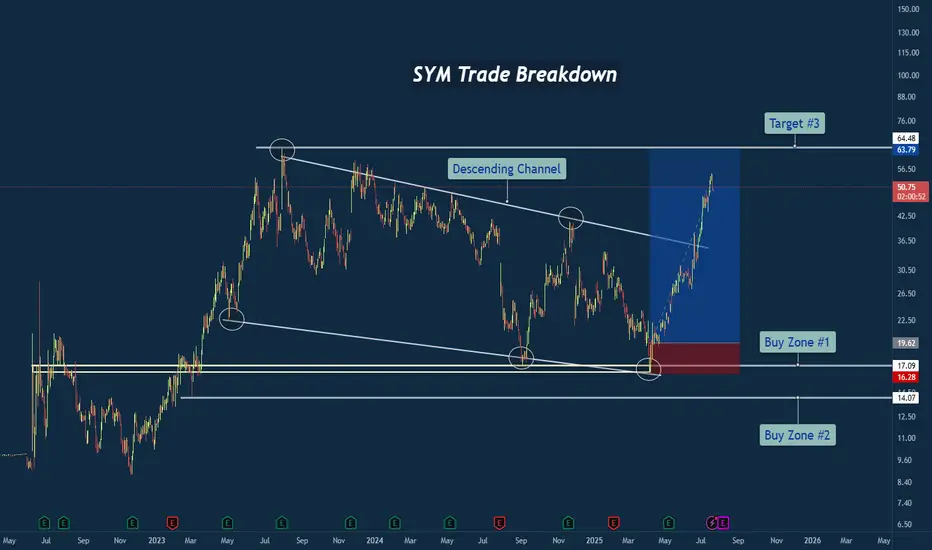
SYM Trade Breakdown – Robotics Meets Smart Technical's🧪 Company: Symbotic Inc. ( NASDAQ:SYM )
🗓️ Entry: April–May 2025
🧠 Trade Type: Swing / Breakout Reversal
🎯 Entry Zone: $16.28–$17.09
⛔ Stop Loss: Below $14.00
🎯 Target Zone: $50–$64+
📈 Status: Strong Rally in Motion
📊 Why This Trade Setup Stood Out
✅ Macro Falling Wedge Reversal
After nearly two years of compression inside a falling wedge, price finally tapped multi-year structural support and fired off with strength. This wasn’t just a bottom — it was a structural inflection point.
✅ Triple Tap at Demand Zone
Symbotic tapped the ~$17 area multiple times, signaling strong accumulation. Volume and momentum picked up with each successive test, showing institutional interest.
✅ Clean Break of Trendline
Price broke through the falling resistance trendline decisively, confirming the bullish reversal and unleashing stored energy from months of sideways structure.
🔍 Company Narrative Backdrop
Symbotic Inc. isn't just any tech stock. It’s at the forefront of automation and AI-powered supply chain solutions, with real-world robotics deployed in major retail warehouses. That kind of secular growth narrative adds rocket fuel to technical setups like this — especially during AI adoption surges.
Founded in 2020, Symbotic has quickly become a rising name in logistics and warehouse automation, serving the U.S. and Canadian markets. With robotics in demand and investors chasing future-ready tech, the price action aligned perfectly with the macro theme.
🧠 Lessons from the Trade
⚡ Compression = Expansion: Wedges like this build pressure. When they break, the moves are violent.
🧱 Structure Never Lies: The $17 zone was no accident — it was respected over and over.
🤖 Tech Narrative Boosts Confidence: Trading is easier when the fundamentals align with the technicals.
💬 What’s Next for SYM?
If price holds above the wedge and clears the $64 resistance, we could be looking at new all-time highs in the next cycle. Watching for consolidation and retests as opportunity zones.
#SYM #Symbotic #Robotics #Automation #AIStocks #BreakoutTrade #FallingWedge #SwingTrade #TechnicalAnalysis #TradingView #TradeRecap #SupplyChainTech
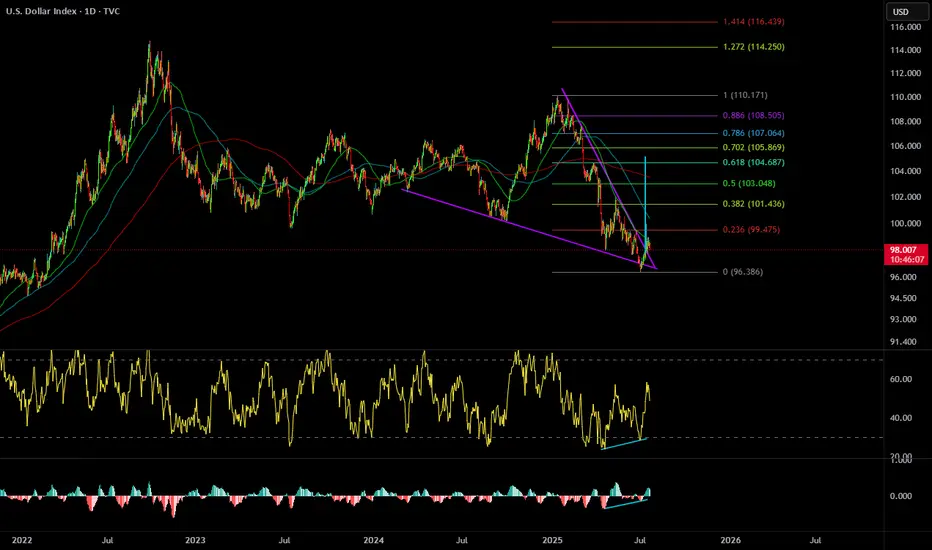
Dollar $DXY Bullish WedgePretty clean falling wedge with divergence. Aligns with a pullback to come on BTC and Stocks.
A move back to 104 area would do some damage to risk on assets.
Follow for updates.
GOLD-XAUUSD vs. The FED: Technicals or Fundamentals?Good Morning Traders,
Let’s break down what gold is showing us on the 1-day chart:
- **Resistance:** 3,378
- **Support:** 3,282
- There’s a noticeable **head and shoulders pattern** on the chart. Under normal conditions, gold’s target sits at **3,170**.
Gold is highly sensitive to fundamental factors. Sudden war news or events like last week’s rumors about Trump firing the Fed Chair can trigger serious volatility.
That’s why I always combine **technical and fundamental analysis** in my approach.
For gold to reach the 3,170 target, the **3,282 support level must first be broken**. Since that hasn't happened yet, we can't confirm a bearish move—fundamentals play a key role here.
Keep in mind: this is a **swing trade** setup based on a 1-day chart. Reaching the target could take time.
I want to sincerely thank everyone who’s been supporting my analyses with likes—your support is
my biggest source of motivation when it comes to sharing content.
Much love and respect to you all.💛

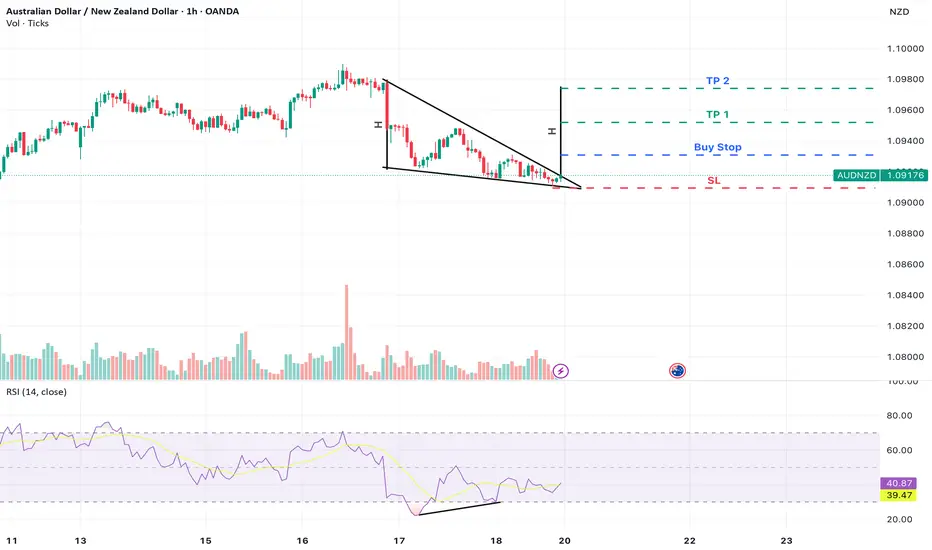
AUD/NZD – Falling Wedge Breakout with Bullish DivergenceAUD/NZD is currently forming a falling wedge pattern on the 1-hour timeframe, a structure typically associated with bullish reversals. Notably, bullish divergence on the RSI is developing while price continues to print lower lows, RSI is making higher lows, indicating weakening selling momentum.
Trade Setup:
Buy Stop Entry: 1.09309 (above recent Lower High — confirmation of breakout)
Stop Loss: 1.09094 (recent Lower Low )
Take Profit 1 : 1.09520
Take Profit 2 : 1.09740 (full pattern projection target)
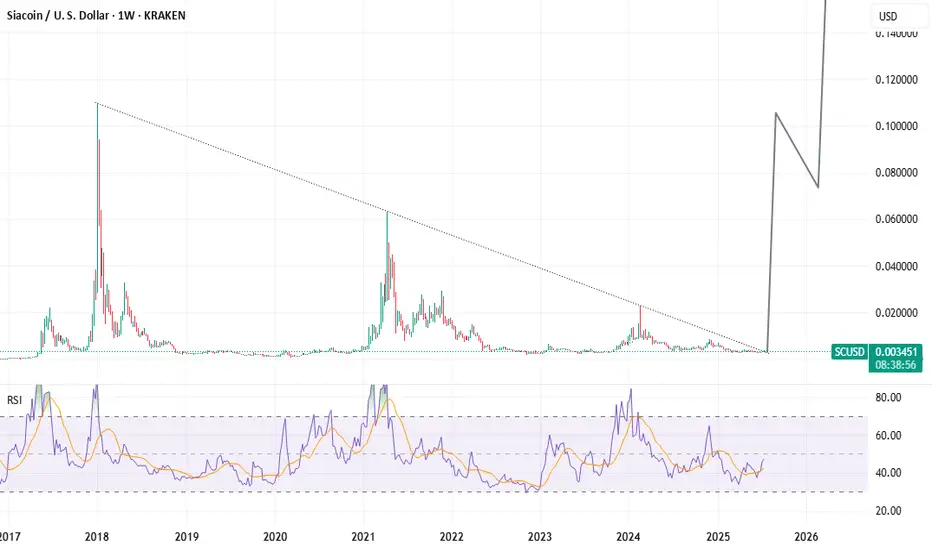
8-Year Breakout Confirmed! SIACOIN Hardfork Activated!Breaking out from a near-identical structure to XRP’s Q3 2024 move, Siacoin (SC) is poised to moon.
Once a top 20 crypto, SC has just closed outside an 8-year falling wedge on the weekly—marking the end of nearly a decade of compression.
But this isn’t just a pattern breakout—it coincides with the biggest technical overhaul in Sia’s history, rolled out on the 10-year anniversary of the token’s launch. Some of the new features:
- Full protocol overhaul — complete rewrite in Go (from siad to hostd/renterd)
- Faster performance — significantly improved upload/download speeds
- Modular architecture — easier dev integration, plug-and-play infrastructure
- Efficient storage contracts — new ephemeral account system for faster payments
- Lower gas costs — more cost-effective microtransactions for storage users
- Better redundancy & reliability — improved renter-host coordination
- Stronger developer tools — RESTful APIs + CLI tools for building on Sia
V2 basically turned Sia from a clunky decentralized Dropbox into a scalable, developer-friendly Web3 storage protocol, just in time for the AI + data sovereignty wave.
Still buried in market cap rankings, SC has the potential to quietly reclaim a top 30 spot as the world rediscovers decentralized storage. This isn’t a meme coin—it’s a battle-tested, utility-rich project with real infrastructure, real adoption potential, and serious upside.
#Siacoin #SC #Sia
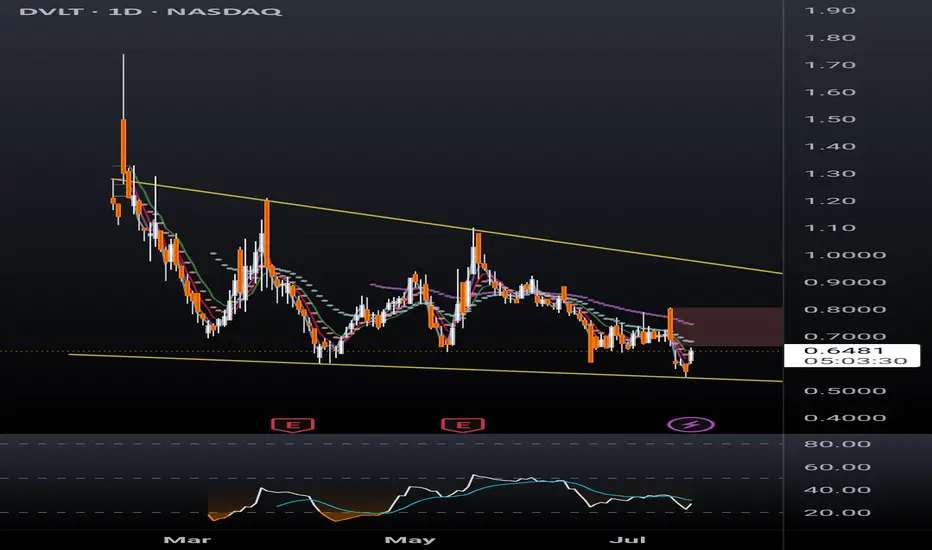
OMSE falling wedge after IPONeutral on OMSE, another relatively new ticker. Similar to my previous post on DVLT, this ticker is fundamentally strong but stuck in a falling wedge after IPO. Price is struggling to break the daily 20EMA (overlayed on this 4H chart) and has rejected multiple times. The company has strong financials, take the time to do some DD, however this pattern could break to the downside and hit new lows before we see any type of rally given the weakness in this sector at the moment. Set alerts and watch the price action play out, or don't bet your rent money on any direction if entering a position.
I'm just a cat not a financial advisor.

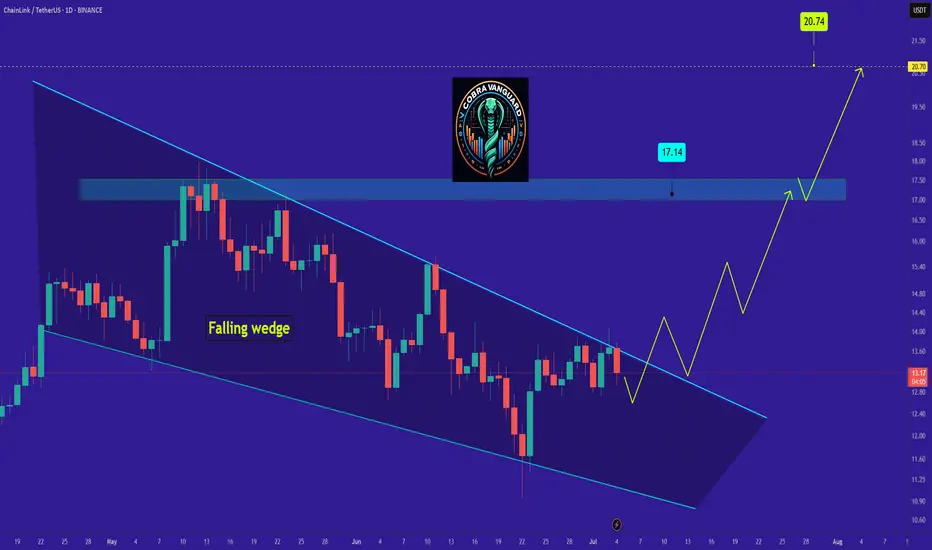
LINK's Situation, A Comprehensive Analysis !!!So if you pay attention to the LINK chart you can see that the price has formed a Ascending wedge which means it is expected to price move as equal as the measured price movement.( AB=CD )
NOTE: wait for break of the WEDGE .
Best regards CobraVanguard.💚
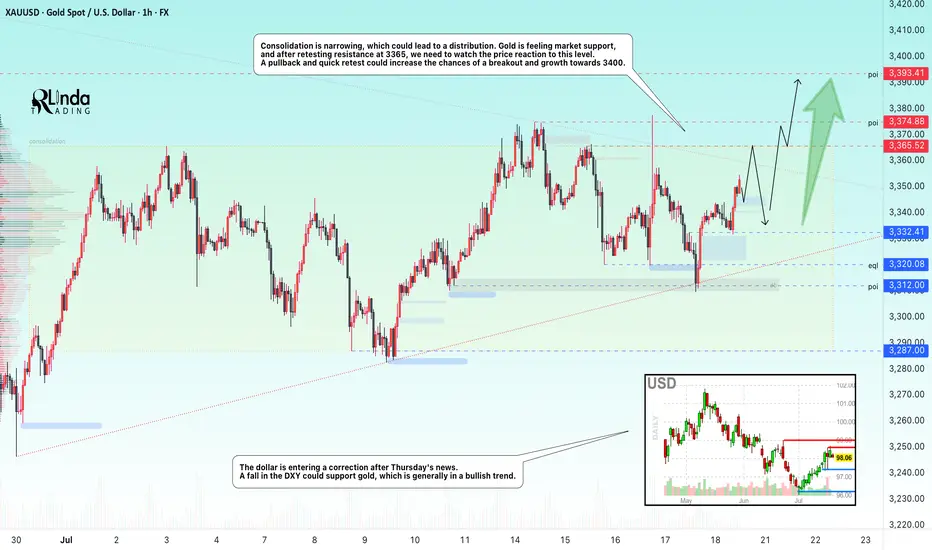
GOLD → Retest of consolidation resistance. Chances of a breakoutFX:XAUUSD bounces off support at 3312, forming a false breakdown at 3320. The price is heading towards consolidation resistance. The chances of continued growth are increasing...
Gold rebounded from its low amid statements by Fed member Waller about a possible rate cut in July. However, strong US sales and labor market data strengthened the dollar and held back XAU/USD growth. Despite statements by some Fed members about maintaining a tight policy, traders continue to expect rate cuts before the end of the year. The focus is on new economic data that could affect the dollar and gold prices.
Technically, consolidation is narrowing, which could lead to distribution. Gold is feeling market support, and after retesting resistance at 3365, we need to watch the price reaction to the level. A pullback and quick retest could increase the chances of a breakout and growth to 3400.
Resistance levels: 3365, 3375
Support levels: 3332, 3320, 3312
There is a high probability that there will be an attempt to break through the consolidation resistance amid expectations of a rate cut. This phase may be accompanied by either a correction to retest and return for a breakout, or a breakout and consolidation of the price above the level. Today, Friday, I expect a retest and correction, as there may not be enough local potential for a breakout of this level, and the price has already lost some of its momentum since the opening of the session...
Best regards, Linda!
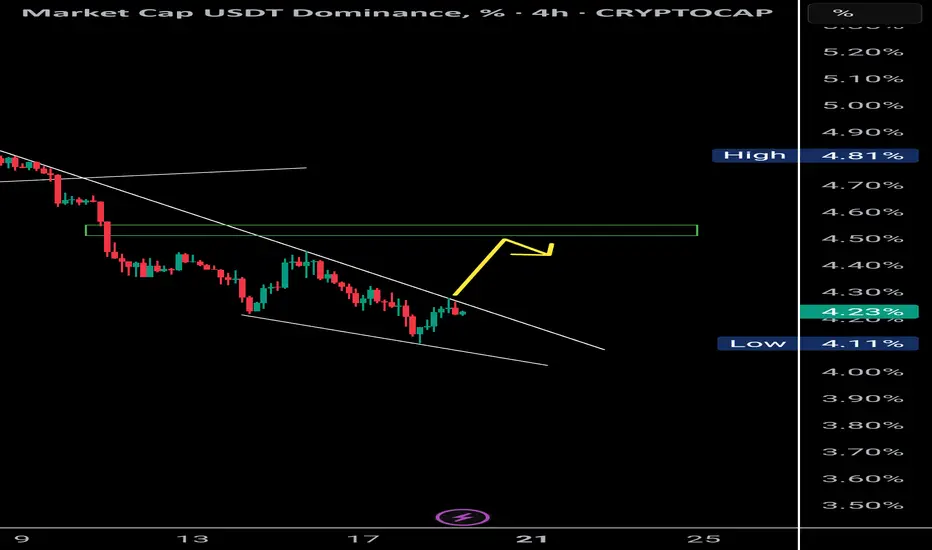
USDT Dominance Forming Bullish Divergence | Altcoins May Retest 📉 USDT Dominance (4H):
Currently forming a bullish divergence with RSI, supported by a falling wedge structure. Price is respecting a clear supply OB (resistance zone) and might retest the 4.55% level.
🔁 Historically, a rise in USDT.D signals short-term corrections in BTC and altcoins, creating opportunities for OB/supply fills and long setups.
📊 This could be the retest phase for major crypto assets before resuming upward momentum.
🧠 Use this phase wisely — it’s where strong setups begin to form.
DVLT falling wedge, TP $1+DVLT a relatively new ticker is already drawing a lot of attention. Up 13% today after hitting new all time low yesterday, sure to catch a lot of eyes from retail investors. With recent news releases such as a licensing agreement with IBM, a lawsuit against naked short selling, and US patent allowances, target prices have been announced ranging from $3 to $11/share.
Disclaimer, this ticker is PRONE TO HEAVY DILUTION, however in order to remain listed on NASDAQ the SP will have to hit $1 and remain there. This being the case, the company must have something in the books to break upward out of this falling wedge and give shareholders a reason to stay with the company long term.
I'm just a cat not a financial advisor.
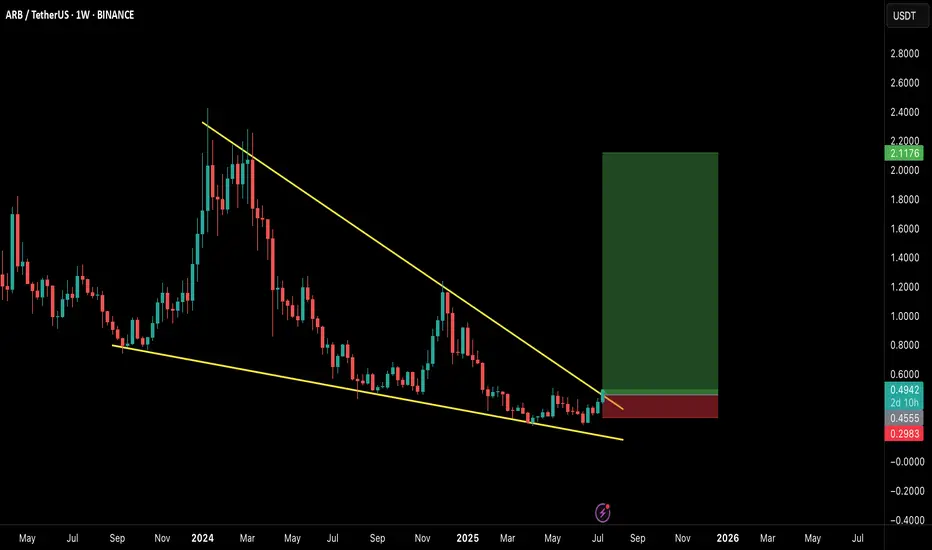
ARB/USDT – Weekly Breakout Setup!Hey Traders!
If you’re finding value in this analysis, smash that 👍 and hit Follow for high-accuracy trade setups that actually deliver!
Massive Falling Wedge Breakout in Play!
ARB just confirmed a breakout from a long-term falling wedge pattern on the weekly timeframe, which has historically been one of the most reliable bullish reversal structures in technical analysis.
🧠 Why this setup matters:
The falling wedge has been forming for over a year, indicating long-term accumulation and compression.
Price has clearly broken above the descending resistance, suggesting a potential shift in momentum.
The structure resembles previous explosive moves, and this could just be the start of a multi-month rally.
🟢 Trade Setup:
Entry: CMP ($0.49) & accumulate on any dips
Targets:
🎯 $0.85
🎯 $1.30
🎯 $2.10+ (Full wedge target)
Stop-loss: 🔴 Close below $0.30
Timeframe: Mid to long term (6–12 weeks or more)
🚀 Bullish Signals:
Weekly breakout candle with strong volume (confirmation pending close).
Market-wide sentiment is gradually turning, and ARB may become one of the leaders.
📌 Final Thoughts:
This is a high-conviction swing setup with a strong reward-to-risk ratio. Keep an eye on weekly close confirmation and market sentiment for better entries.
💬 Let me know your thoughts or if you’re riding this setup too!
XRP's situation+ Target PredictionThe XRP is in a Bullish phase by a Falling Wedge Pattern.
A falling wedge indicates the potential for price to reach to $3.
Note if the PRZ ZONE is broken downwards with the strength of Bearish candles , this analysis of ours will be failed.
Best regards CobraVanguard.💚

GOLD → The triangle is contracting. Retest of support...FX:XAUUSD tested a local high of 3375 but quickly returned to consolidation. The reason is manipulation by the US administration related to Powell, inflation, and interest rates...
Demand for gold has risen sharply amid global risks: Trump's aggressive tariff plans, strong inflation, and uncertainty about the Fed's actions have increased interest in defensive assets. Despite the temporary strengthening of the dollar, gold remains a popular hedging instrument. Technical analysis also points to a bullish outlook. However, growth potential is limited until the Fed clarifies its interest rate policy
Technically, on the D1 chart, it is clear that the price is consolidating, with the range continuing to narrow. Due to the bullish factors listed above, we can expect growth to continue. However, it is difficult to say where and when the growth will begin due to the uncertainty factor. All attention is on the support at 3320-3312, the triangle support, as well as the consolidation support at 3287.
Resistance levels: 3365, 3375
Support levels: 3320, 3312, 3287
Since the opening of the session, the price has spent part of its daily range, so there may not be enough potential for the decline to continue. A false breakdown of support and consolidation of the price above the key zone may attract buyers, which will trigger growth towards resistance.
Best regards, R. Linda!

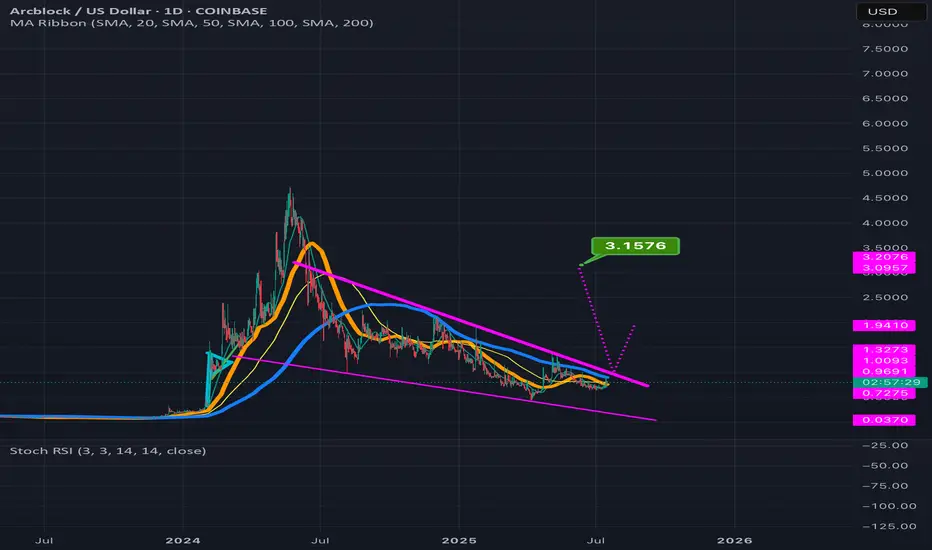
ABT can potentially 4x in value reading up from the wedge its inThe smaller pink dotted measured move line is for the inv h&s pattern its formed inside the wedge with the top trendline of the wedge doubling as the invh&s pattern’s neckline. Hitting that smaller target is more or less a 2x from current price action. If we hit the full falling wedge target that’s a 4x from where it is currently. *not financial advice*